Modeling and Simulation of Fixed bed Adsorption column: Effect of Velocity Variation * B.V. Babu and Suresh Gupta Department of Chemical Engineering Birla Institute of Technology & Science Pilani 333031 (Rajasthan) India
Abstract The kinetic behavior of a fixed-bed adsorber can be explained and the characteristic breakthrough curve of the adsorption phenomena can be obtained through mathematical models. In the earlier models, the kinetics is explained using a mathematical model that takes into account of external and internal masstransfer resistances with a nonideal plug flow behavior. The variation of fluid velocity along the column is an important aspect, which has not been accounted so far. In the present study, a mathematical model is proposed for explaining the kinetic behavior of adsorption phenomena incorporating the fluid velocity variation along the column length also. Internal mass-transfer resistances due to pore diffusion mechanism are considered in the model. The proposed mathematical model for fixed-bed adsorption is solved numerically and compared with earlier model reported in literature. The results show that the breakpoint is obtained earlier which represents the realistic behavior in adsorption phenomena. Initially the sharp front of the breakthrough curve is seen followed by broadening of tail of the breakthrough curve. Simulations are carried out using the present model for a systematic parametric study. The effects of various important and influencing parameters such as flow rate, bed height, inlet adsorbate concentration and particle diameter on breakthrough curve are studied in detail. Keywords: adsorption; modeling; pore diffusion control; breakthrough curve; mass transfer
1. Introduction Use of adsorption contacting systems for industrial and municipal wastewater treatment has become more prevalent during recent years [1]. The process of adsorption of the components of a fluid mixture flowing through a packed bed of an adsorbent porous material is the basis of several important applications in chemical engineering. These include continuous separation processes for large-scale applications such as bulk separations [2], and also chromatographic processes for both analytical and preparative purposes [3]. As a consequence of this applicative interest, a great amount of work has been devoted to the modeling of these processes [4]. * Corresponding Author: Assistant Dean - ESD & Head of Chemical Engineering Department, B.I.T.S., PILANI-333031 (Rajasthan) INDIA. Email:
[email protected]; Home Page: http://discovery.bits-pilani.ac.in/discipline/chemical/BVb/index.html; Phone: +91-01596-245073 Ext. 205 / 224; Fax: +91-01596-244183;
1
Nomenclature aP
radius of the adsorbent pellets, m
A
area of cross section, m2
b
Langmuir isotherm parameter, ml/mg
c
solute concentration in the liquid phase inside the pores, mg/l
Cb
bulk phase dye concentration, mg/ml
Cs
liquid phase concentration in equilibrium with qs on the surface, mg/ml
Cbo
inlet adsorbate concentration, mg/ml
DL
axial dispersion coefficient, m2/s
DP
pore diffusion coefficient, m2/s
kf
external film mass transfer coefficient, m/s
L
column length, m
q
average adsorbed phase dye concentration, mg/g
qm
Langmuir isotherm parameter, mg/g
qs
concentration on the surface of the pellet, mg/g
Q
flow rate, ml/min
r
radial coordinate, m
t
time, sec
V
superficial velocity, m/s
Vo
initial superficial velocity, m/s
Vi
interstitial velocity inside the bed, m/s
z
axial coordinate, m
Greek letters
ε
bed porosity
εp
porosity of the adsorbent pellet
l
solution density, kg/m3
p
particle density, kg/m3
b
bed density, kg/m3
2
The key parameters for design of an adsorption system are the process parameters that are used for modeling the system for predicting the quality of effluent under a wide range of operating conditions [5]. In most of the large-scale processes, relatively large porous particles (50-1,000 m in diameter) are used to reduce pressure drop and sorbent cost. Intraparticle diffusion is usually the rate-limiting step in these systems and it controls the sharpness of breakthrough curves [6]. One of these models describes diffusion as the mechanism occurring in the fluid phase with a distributed adsorption along the pore walls, i.e., the pore diffusion model [7]. For low-affinity solutes in macroporous sorbents, pore diffusion is usually the dominant intraparticle diffusion mechanism [8]. Pore diffusion model has been used for predicting the kinetics of fixed bed adsorption process [6,9,10,11]. These models take account of both external and internal masstransfer resistances as well as of nonideal plug flow along the column. The above models have not incorporated the fluid velocity variation along the bed, which makes a significant effect on breakthrough curve. In the present work, the effect of operating variables on the process of fixed-bed adsorption is studied. Furthermore, the kinetics is studied using a mathematical model that takes account of both external and internal masstransfer resistances, nonideal plug flow along the column and the variation of fluid velocity along the column. 2. Mathematical Modeling Before discussing the assumptions needed for model formulation, we first introduce the physical process considered in this model. Convection along the column axial direction and axial dispersion are the mass transport mechanisms in the bulk phase. Molecules from the bulk interstitial phase are transported via axial convection and Fickian diffusion (film diffusion) onto the particle surface. Inside the particle, molecules can diffuse into the inner portion of particle via surface diffusion, pore diffusion, or both. This study focuses on understanding the mechanism in pore diffusion. Bautista et al. [9] proposed the kinetic mechanism for the adsorption of -amylase from Aspergillus oryzane in a fixed bed. The model takes account of both external and internal
3
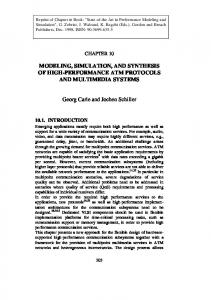
mass-transfer resistances as well as of nonideal plug flow along the column. They did not consider the fluid velocity variation along the bed to predict the behavior of breakthrough curve. In the present study this model is modified by considering the variation of velocity along the column. To formulate a generalized model corresponding to the pore diffusion mechanism, following assumptions are made: 1. The system operates under isothermal conditions. 2. The equilibrium of adsorption is described by Langmuir isotherm, a nonlinear isotherm. 3. Intra-particle mass transport is due to Fickian diffusion, and it is characterized by the pore diffusion coefficient, DP. 4. Mass transfer across the boundary layer surrounding the solid particles is characterized by the external-film mass transfer coefficient, kf. 5. The linear velocity of the liquid phase varies along the column. 6. The macro porous adsorbent particles are spherical and homogeneous in size and density. Based on the preceding assumptions, for the control volume, Adz (Figure 1), for limiting situation z − DL
0, net rate of accumulation or depletion is given as
∂ 2C
∂q ∂C ∂C p b +V b + C ∂V + b + ρ 1 − ε =0 b ∂z p ε ∂z ∂t ∂t ∂z 2
(1)
V C b ( z , t ),
dz Cb +
∂C b ∂z
∂ (C bV ) dz , ∂z
Figure 1: Mass balance in element of fixed bed
4
∂C b ∂ 2C b + dz ∂z ∂z 2
The following initial condition is considered C b = C bo
z = 0, t = 0
(2)
Cb = 0
0 < z ≤ L, t = 0
(3)
The contour conditions at both ends of the column are given by the following equations DL
∂C b = −V0 (C bo − C b ), z = 0, t > 0 ∂z
∂C b = 0, ∂z
(4)
z = L, t ≥ 0
(5)
The superficial velocity, V in fixed-bed adsorption is not constant because of adsorption. The following equation was used to estimate (dV/dz), the variation of velocity of bulk fluid along the axial direction of the bed. For liquid adsorption, assuming the liquid density to be constant, then the total mass balance gives
ρl
∂q p ∂V = −(1 − ε ) ρ s ∂z ∂t
(6)
Velocity boundary conditions V = V0 ,
z = 0, t > 0
∂V = 0, ∂t
(7)
z = L, t > 0
(8)
The inter-phase mass transfer rate may be expressed as
ρs
∂q p ∂t
=
3k f (C b − C s ) ap
(9)
The intra-pellet mass transfer is due to the diffusion of adsorbate molecules through the pore. The macroscopic conservation equation is given as
εp
∂c ∂q ∂ 2 c 2 ∂c + (1 − ε p ) ρ p = Dp + ∂t ∂t ∂r 2 r ∂r
(10)
Assuming instantaneous equilibrium ∂q ∂c ∂q = ∂t ∂t ∂c
(11)
Then rearranging equation (3)
5
∂c = ∂t
1 1 − ε P ∂q 1 + ρp ε P ∂c
DP
∂ 2 c 2 ∂c + ∂r 2 r ∂r
(12)
The following initial condition is considered c = 0, q = 0,
0 < r < ap , t = 0
(13)
The symmetry condition at the center of the particles and continuity condition on the external surface of the adsorbent bed are expressed as ∂c = 0, ∂r k f (C b − C s ) = Dp
∂c , ∂r
r = 0, t > 0
(14)
r = ap , t > 0
(15)
The adsorption isotherm was favorable and nonlinear, and it described by Langmuir isotherm q=
q m bc 1 + bc
(16)
2.1 Simulation Technique
Since nonlinear adsorption equilibrium is considered, the preceding set of partial differential equations (1 to 16) is solved numerically by a reduction to set of ordinary differential equations using the Explicit Finite Difference technique. Finite difference technique has successfully applied to solve such type of partial differential equations in other studies by Babu and Chaurasia [12,13,14,15,16,17]. A mathematical algorithm to solve these coupled equations is developed and implemented into a computer program using MATLAB (v.6.1) software. The same parameters reported by Bautista et al. [9] are used for simulation in present study, which are given in Table 1. 3. Results and Discussion
The model used, as described above, determines the outlet adsorbate concentration at different times based on different operating conditions. In the present model, linear velocity variation along the bed is considered and the obtained results are compared with the previous model given by Bautista et al. [9]. Same parameters given by Bautista et al.
6
Table 1: Model parameters value for simulation [9] Parameter
Value
ε ,Bed porosity, (-)
0.58
εp, Particle porosity, (-)
0.53
p,
Particle density, kg/m3
1970
b,
Bed density, kg/m3 ($)
900
l,
Liquid density, kg/m3 ($)
1000
DL, Axial dispersion coefficient, m2/s ($)
5.9 x 10⁻¹⁰
qm, Maximum adsorption capacity, mg/g
45.4
b, Langmuir isotherm constant, ml/mg
0.84
Dp, Pore diffusivity, m2/sec
2.5 x 10⁻¹¹
kf, External mass transfer coefficient, m/sec
1.5 x 10⁻⁶
d, Bed diameter, m
0.016
($) The values not reported in literature
[9] are used and some parameters (see Table 1) are assumed which are not given in literature. The present model results show an improvement over the previous model given by Bautista et al. [9] with respect to better steepness of the breakthrough curve which is being validated by earlier study [6,18]. The results show that the breakpoint is obtained earlier (Figure 2). Initially the sharp front of the breakthrough curve is seen followed by broadening of tail of the breakthrough curve as shown in Figure 2 [18]. These obtained results are more justifiable with theoretical phenomena occurring in the adsorption system. The fluid velocity along the bed is a decreasing function of bed length [18]. The velocity continuously decreases inside the bed with respect to bed length. This phenomenon is validated by the mass balance (Eq. 6) for velocity variation.
This
establishes the fact that the effect of velocity variation on breakthrough curve is significant. This fact is also in agreement with the results reported in the literature [18]. Based on the successful implementation of velocity variation in the model, and supporting evidence in the literature, the simulations are carried out using the present model to carryout a systematic parametric study. The present model is studied by varying
7
the different important parameters such as flow rate, bed height, inlet adsorbate concentration and particle diameter. 1.0
0.8
without velocity variation with velocity variation
Cb/Cbo
0.6
0.4
0.2
0.0 0
2000
4000
6000
8000
Time (sec) Figure 2: Breakthrough curve with and without fluid velocity variation for a velocity of V=0.0020 cm/sec
3.1 Effect of flow rate
The results for different solution flow rates are plotted for a bed height of 0.163 m and an inlet adsorbate concentration of 1 mg/ml in Figure 3. The flow rates considered are 0.25, 0.5 and 1.0 ml/min. Figure 3 reveals that as the flow rate increases from 0.25 to 1.0 ml/min, the breakthrough curve becomes steeper. The break point time decreases from 1600 to 750 sec without considering the velocity variation along the bed and 1150 to 500 sec with velocity variation. This is because of the residence time of the solute in the column, which is not long enough for adsorption equilibrium to be reached at high flow rate. So at high flow rate the adsorbate solution leaves the column before equilibrium occurs. Furthermore, a fixed saturation capacity of bed based on the same driving force gives rise to a shorter time for saturation at higher flow rate. As the flow rate is 0.25 ml/min, the break point time is 1600 sec without considering velocity variation and 1150
8
sec with velocity variation along the bed. The percentage change in break point time is 28%. For the flow rates 0.5 and 1.0 ml/min, the percentage change in breakpoint time (that is a ratio of difference between breakpoint time without velocity variation and with velocity variation to the maximum breakpoint time obtained) are 17% and 15%, respectively. This shows as the flow rate increases the velocity variation effect on breakthrough curve decreases. 1.0
0.8
Q = 0.25 ml/min Q = 0.25 ml/min(*) Q = 0.5 ml/min Q = 0.5 ml/min(*) Q = 1.0 ml/min Q = 1.0 ml/min(*)
Cb/Cbo
0.6
0.4
0.2
0.0 0
2000
4000
6000
8000
Time (sec)
Figure 3: Effect of flow rate on breakthrough curve (*) indicates model results with velocity variation
3.2 Effect of bed height
The effect of bed height on the effluent adsorbate concentration is presented for flow rate of 0.25 ml/min and inlet adsorbate concentration of 1 mg/ml in Figure 4. The bed heights considered are 0.163 and 0.20 m. It is observed that as the bed height increases from 0.163 to 0.20 m, the break point time increases from 1600 to 3475 sec without considering the velocity variation and 1150 to 2625 sec with velocity variation along the bed. This shows that at smaller bed height the effluent adsorbate concentration ratio increases more rapidly than for a higher bed height. Furthermore, the bed is saturated in less time for smaller bed heights. Smaller bed height corresponds to less amount of 9
adsorbent. Consequently, a smaller capacity for the bed to adsorb adsorbate from solution and a faster increase in rate of adsorbate adsorption is expected. For the bed height of 0.163 m, the break point time is 1600 sec without considering velocity variation and 1150 sec with velocity variation along the bed. The percentage change in break point time is 13%. The percentage change in breakpoint time is 24% for bed height of 0.20 m. This shows as the bed height increases the velocity variation effect on breakthrough curve increases. 1.0
0.8
L = 0.163 m L = 0.163 m(*) L = 0.20 m L = 0.20 m(*)
Cb/Cbo
0.6
0.4
0.2
0.0 0
2000
4000
6000
8000
Time (sec) Figure 4: Effect of bed height on breakthrough curve (*) indicates model results with velocity variation
3.3 Effect of Inlet concentration
The effect of inlet adsorbate concentration on effluent concentration is shown in Figure 5. The two-inlet adsorbate concentrations considered are 0.5 and 1.5 mg/ml. During these simulations other parameters such as bed height and flow rate are kept constant. It is observed that as the inlet adsorbate concentration increases from 0.5 to 1.5 mg/ml, the break point time decreases from 2525 to 2275 sec without considering the velocity variation and 1875 to 1575 sec with velocity variation along the bed. For larger feed concentration, steeper breakthrough curves are found, because of the lower mass-transfer
10
flux from the bulk solution to the particle surface due to the weaker driving force. In addition, at high concentration, the isotherm gradient is lower, yielding a higher driving force along the pores. Thus the equilibrium is attained faster for values of higher adsorbate concentration. For the inlet adsorbate concentration of 0.5 mg/ml, the break point time is 2525 sec without considering velocity variation and 1875 sec with velocity variation along the bed. The percentage change in break point time is 26%. The percentage change in breakpoint time is 28% for inlet adsorbate concentration of 1.5 mg/ml. This indicates that as the inlet adsorbate concentration increases, there is no significant effect of the velocity variation on breakthrough curve. 1.0
0.8
Cbo = 0.5 mg/ml Cbo = 0.5 mg/ml(*) Cbo = 1.5 mg/ml Cbo = 1.5 mg/ml(*)
Cb/Cbo
0.6
0.4
0.2
0.0 0
2000
4000
6000
8000
Time (sec) Figure 5: Effect of inlet adsorbate concentration on breakthrough curve (*) indicates model results with velocity variation
3.4 Effect of particle radius
The effect of particle size on effluent concentration is shown in Figure 6. The particle radii considered are 3.1 x 10⁻⁴, 4.1 x 10⁻⁴ and 6.1 x 10⁻⁴ m. During these simulations other parameters such as flow rate, bed height, and inlet adsorbate concentration are kept constant. Figure 6 reveals that as the particle radius increases from 3.1 x 10⁻⁴ to 6.1 x 10⁻⁴
11
m, the steepness of the breakthrough curve decreases. The break point time increases from 1325 to 2050 sec without considering the velocity variation and 975 to 1450 sec with velocity variation along the bed. Smaller particle size resins provide quicker kinetic equilibrium and therefore better breakthrough capacity is obtained at higher linear velocities. This allows faster cycle times with no reduction in the resin capacity. As the diameter of the particle increases, the thickness of stagnant film around the particles increases, and also the total length of the path inside the pores increases. Under these conditions, the overall kinetics of the process is slow, because the time for a molecule of adsorbate to reach the adsorption site is more, as the diffusional path along the pores is large. As the particle radius is 3.1 x 10⁻⁴ m, the break point time is 1325 sec without considering velocity variation and 975 sec with velocity variation along the bed. The percentage change in break point time is 17%. For the particle radii 4.1 x 10⁻⁴ and 6.1 x 10⁻⁴ m, the percentage change in breakpoint time is 22% and 29%, respectively. This shows as the particle radius increases the velocity variation effect on breakthrough curve increases. 1.0
0.8
aP = 3.1 x 10⁻⁴ m aP = 3.1 x 10⁻⁴ m(*) aP = 4.1 x 10⁻⁴ m aP = 4.1 x 10⁻⁴ m(*) aP = 6.1 x 10⁻⁴ m aP = 6.1 x 10⁻⁴ m(*)
Cb/Cbo
0.6
0.4
0.2
0.0 0
2000
4000
6000
Time (sec) Figure 6: Effect of particle radius on breakthrough curve (*) indicates model results with velocity variation
12
8000
4. Conclusions
A generalized model that incorporates external film mass transfer resistance and pore diffusion resistance with velocity variation through column bed has been formulated and solved numerically. Following conclusions are drawn from the above-discussed results: 1.
There is a significant effect of velocity variation through the bed on breakthrough curve, wherein the break point is obtained earlier. Initially the sharp front of the breakthrough curve is seen followed by broadening of tail of the breakthrough curve.
2.
As the flow rate is increased, the breakthrough curve becomes steeper. The break point time is obtained earlier and effluent adsorbate concentration ratio increases more rapidly.
3.
For smaller bed height, the effluent adsorbate concentration ratio increases more rapidly than for a higher bed height.
4.
For larger feed concentration, steeper breakthrough curves are obtained and break point time is achieved sooner.
5.
With decrease in particle radius, the breakthrough curve becomes steeper and the break point time decreases.
These results improve the understanding of adsorption phenomena with reference to pore diffusion, and are very useful in the design of adsorption columns. References
[1]
[2] [3] [4] [5]
B.V. Babu, S. Gupta, “Modeling and Simulation for Dynamics of Packed Bed Adsorption”, Proceedings of International Symposium & 57th Annual Session of IIChE in association with AIChE (CHEMCON-2004), Mumbai, December 27-30, 2004. D.M. Ruthven, and C.B. Ching, “Counter-current and simulated counter-current adsorption separation processes”, Chemical Engineering Science, 44 (1989) 10111038. G. Ganetsos, P.E. Barker, “Preparative and Production Scale Chromatography”, Marcel Dekker, New York, 1993. K. Kaczmarski, M. Mazzotti, G. Storti, M. Morbidelli, “Modeling fixed-bed adsorption columns through orthogonal collocations on moving finite elements”, Computers and Chemical Engineering, 21 (1997) 641-660. B.V. Babu, V. Ramakrishna, “Dominant Design Variables and Modeling Parameters for Adsorption in Batch Studies”, Proceedings of International
13
[6] [7] [8] [9] [10] [11] [12] [13] [14] [15] [16] [17] [18]
Symposium & 57th Annual Session of IIChE in association with AIChE (CHEMCON-2004), Mumbai, December 27-30, 2004. Z. Ma, R.D. Whitley, N.H.L. Wang, “Pore and Surface Diffusion in Multicomponent Adsorption and Liquid Chromatography Systems”, AIChE Journal, 42 (1996) 1244-1262. T.W. Webi, R.K. Chakravort, “Pore and Solid Diffusion Models for Fixed-Bed Adsorbers”, AIChE Journal, 20 (1974) 228-238. E. Furuya, Y. Takeuchi, K.E. Noll, “Intraparticle Diffusion of phenols within Bidispersed Macroreticular Resin Particles”, J. Chem. Eng. Japan, 22 (1989) 670L.F. Bautista, M. Martinez, J. Aracil, “Adsorption of -Amylase in a Fixed Bed: Operating Efficiency and Kinetic Modeling”, AIChE Journal, 49 (2003) 2631-2641. S. Ghorai, K.K. Pant, “Investigations on the column performance of fluoride adsorption by activated alumina in a fixed-bed”, Chemical Engineering Journal, 98 (2004) 165-173. J.L. Sotelo, M.A. Uguina, J.A. Delgado, L.I. Celemin, “Adsorption of methyl ethyl ketone and trichloroethane from aqueous solutions onto activated carbon fixed-bed adsorbers”, Separation and Purification Technology, 37 (2004) 149-160. B.V. Babu, A.S. Chaurasia, “Modeling, Simulation, and Estimation of Optimum Parameters in Pyrolysis of Biomass”, Energy Conversion and Management, 44 (2003) 2135-2158. B.V. Babu, A.S. Chaurasia, “Modeling for Pyrolysis of Solid Particle: Kinetics and Heat Transfer Effects”, Energy Conversion and Management, 44 (2003) 2251-2275. B.V. Babu, A.S. Chaurasia, “Parametric Study of Thermal and Thermodynamic Properties on Pyrolysis of Biomass in Thermally Thick Regime”, Energy Conversion and Management, 45 (2004) 53-72. B.V. Babu, A.S. Chaurasia, “Dominant Design Variables in Pyrolysis of Biomass Particles of Different Geometries in Thermally Thick Regime”, Chemical Engineering Science, 59 (2004) 611-622. B.V. Babu, A.S. Chaurasia, “Pyrolysis of Biomass: Improved Models for Simultaneous Kinetics & Transport of Heat, Mass, and Momentum”, Energy Conversion and Management, 45 (2004) 1297-1327. B.V. Babu, A.S. Chaurasia, “Heat Transfer and Kinetics in the Pyrolysis of Shrinking Biomass Particle”, Chemical Engineering Science, 59 (2004) 1999-2012. D.M. Ruthven, “Principles of Adsorption and Adsorption Processes”, John Wiley & Sons, New York, 1984.
14
Profiles of Authors: Dr B V Babu is Professor & Head of Chemical Engineering Department apart from being Assistant Dean of Engineering Services Division (ESD) at Birla Institute of Technology and Science (BITS), Pilani. His biography is included in 2005 & 2006 editions of Marquis Who’s Who in the World, and Thirty-Third Edition of the Dictionary of International Biography in September 2006.
He has 20 years of Teaching, Research, Consultancy, and Administrative experience. He guided 2 PhD students, 25 ME Dissertation students and 24 Thesis students and around 160 Project students. He is currently guiding 7 PhD candidates, 3 Dissertation students and 10 Project students. He currently has 3 research projects from UGC & DST. His research interests include Evolutionary Computation (Population-based search algorithms for optimization of highly complex and non-linear engineering problems), Environmental Engineering, Biomass Gasification, Energy Integration, Artificial Neural Networks, Nano Technology, and Modeling & Simulation. He is the recipient of many National and International awards, and the Life member of various professional bodies such as IIChE, ISTE, IE, IEA, SOM, Fellow of ICCE, and Associate Member of ISSMO. He has around 102 research publications (International & National Journals & Conference Proceedings) to his credit. He completed three consultancy projects. He is a Panel Expert for www.chemicalhouse.com. He has published three books and has written several chapters in various books and lecture notes of different intensive courses. He was the Invited Chief Guest and delivered the Keynote addresses at one international conference and three national seminars. He organized many Seminars & Conferences, and member of various academic and administrative committees at BITS-Pilani. He also chaired 10 Technical Sessions at various International & National Conferences. He delivered 23 invited lectures at various IITs and Univeristies. He is Editorial Board Member of two International Journals ‘Energy Education Science & Technology’ and ‘Research Journal of Chemistry and Environment’. He is the referee & expert reviewer of 15 International Journals, and on the Programme Committees as an expert reviewer at 12 International Conferences. He reviewed three books of McGraw Hill, Oxford University Press, and Tata McGraw Hill publishers. He is PhD Examiner for one candidate and PhD Thesis Reviewer for 3 Candidates.
Mr. Suresh Gupta is a Lecturer in Chemical Engineering Department at BITS-Pilani, and currently pursuing his PhD under the supervision of Prof B V Babu. He has 3 publications to his credit. He is associate life member of IIChE.
15