Modeling Application Performance by Convolving Machine Signatures with Application Profiles Allan Snavely San Diego Supercomputer Center
[email protected]
Nicole Wolter San Diego Supercomputer Center
[email protected]
Abstract This paper presents a performance modeling methodology that is faster than traditional cycle-accurate simulation, more sophisticated than performance estimation based on system peak-performance metrics, and is shown to be effective on a class of High Performance Computing benchmarks. The method yields insight into the factors that affect performance on single-processor and parallel computers.
1. Introduction The Performance Modeling and Characterization (PMaC, see www.sdsc.edu/PMaC) lab at San Diego Supercomputer Center (SDSC) is focused on developing methods and tools for understanding and predicting the performance of scientific applications on HPC platforms. If one can determine the factors that affect an application’s performance, one can determine the best machine for the application, or tune the application in a guided fashion on the machine at hand, or meaningfully compare machines for their performance on applications. The scientific applications that are of interest to us are compute intensive parallel applications, which make up the majority of the applications on National Partnership for Advanced Computational Infrastructure (NPACI) allocated systems. In order to decrease the complexity of the task of understanding and modeling performance, we began by developing methods and tools for benchmark versions of a class of scientific applications run on current parallel platforms. These applications are kernels from the NAS Parallel Benchmarks[4] (NPBs) representing the compute intensive sections of computational fluid dynamics (CFD) parallel applications. The NPBs consist of 5 kernels and 3 mini-applications each with 5 different size problems. The sizes range from small test size (class S), workstation test size (class W), and three High Performance
Laura Carrington San Diego Supercomputer Center
[email protected]
Computing (HPC) test sizes (class A, B, and C). Using the serial (non-parallel) versions of the NPBs, methods and tools were first perfected for the prediction of single processor performance. The techniques were then extended to the per-processor performance of the parallel versions of two kernels, the Conjugate Gradient (CG) kernel and the Multigrid (MG) kernel. The per-processor performance estimates were then fed into a network simulator called DIMEMAS[1] that can simulate the performance of a parallel execution. Accurate performance modeling embodies understanding into the factors that affect performance; our plan is that these methods and tools, once perfected, can be applied to the prediction of larger scientific applications.
2. Other Work This work diverges from most work by other researchers in that previous work either developed very detailed models for performance[6,7,9,15,21], or concentrated on tool development[10,11], or was very specific to a given application domain[12,13,14], or focused on predicting scalability[18]. Also, some previous work by Worley[23] was in the domain of traditional evaluation of specific machines via benchmarking. What distinguishes this work is that we concentrate initially on very simple models and add complexity only as required to obtain greater accuracy. Also, we are in the process of developing a framework that we believe can be applicable across many different machines and a range of applications to provide usefully accurate performance modeling in reasonably computable time.
3. Modeling via Abstraction The observed performance of a parallel HPC application is complicated; it is a function of (at least) algorithm, implementation, compiler, operating system, underlying processor architecture, and interconnect
technology. The approach adopted here is to proceed via principles of simplicity and extraction. We assume that a parallel application’s performance is based on two major factors: its single processor performance and its use of the network. For the second factor the use of a network simulator can give reasonable results. For single processor performance we disentangle the various factors affecting performance by measuring each in isolation and then combining factors to arrive at models predictive of performance. Specifically, we gather: Machine Signatures: characterizations of the rates at which a machine can (or is projected to) carry out fundamental operations abstract from the particular application. Application Profiles: detailed summaries of the fundamental operations to be carried out by the application independent of any particular machine. We then apply Convolution Methods: algebraic mappings of the Application Profiles on to the Machine Signatures to arrive at a performance prediction. Our investigations to date have focused on memory bound codes, such as the NPB kernels, where the ratio of memory accesses to floating point operations is no less than 1/4 and where the fraction of memory references that are random is at least 10%.
3.1 Methodology and Tools In the development of methods and tools for performance prediction we have been guided by two "rules of thumb" that, while not guaranteed to be true in all cases, have proved themselves generally true on numerous scientific applications: I. the per-processor performance of an application is predominately a function of how it exercises the memory subsystem. (The memory-bound rule.) II. the scalability of an application is primarily a function of how it exercises the interconnect. In order to predict per-processor and/or single processor performance PMaC developed two tools to generate Machine Signatures and Application Profiles based on rule I. These tools are: MAPS (Memory Access Pattern Signature): a probe developed for determining the "feeds and speeds" at which a single-processor or SMP node can sustain rates of loads and stores depending on size of problem and access pattern. It thus captures a Machine Signature with emphasis on memory access patterns (described further in section 4). MetaSim: a runtime trace utility, which snoops the address bus and statistically bins local memory references during program execution. It thus captures
an Application Profile with emphasis on memory access patterns (described further in section 5). Using the per-processor predictions determined from MAPS and MetaSim, the network simulator DIMEMAS [1] then uses these results to predict the performance of the parallel application. DIMEMAS is a network simulator developed by our collaborators in Europe that consumes MPI traces and predicts performance of parallel applications on real or hypothetical machines (see section 6 for more details).
4. MAPS MAPS is a benchmark probe to measure the rate at which a single processor can sustain rates of loads and stores depending on the size of the problem and the access pattern. MAPS has been ported to many HPC platforms including IBM Power3, Compaq Alpha, Intel Itanium, Cray T3E and T90 and SV1, NEC SX-4 and SX-5, Sun HPC 10K, and Fujitsu VPP700 and VPP5000. It is derived from the STREAMS benchmark[2] and extends STREAMS to various strides and random access patterns. A great deal of MAPS data on various machines is available at www.sdsc.edu/PMaC. Figure 1 below is the MAPS curve for stride-one loads for the Power3 NightHawk II processor enhanced with some information about the hardware. This shows how a MAPS curve reveals attributes of the machine, and the likely performance implications, at a glance.
Figure 1. A MAPS generated signature for Blue Horizon. The Power3 (like many modern processors with large L2 cache) does not fully map the L2 cache in the TLB. Thus we get a "three stair step" function for memory accesses, one that is especially pronounced when pre-fetching is enabled.
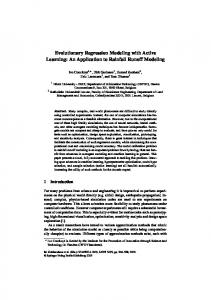
Figure 2 below shows a typical MAPS generated Machine Signature for stride-one and random loads on a Cray T3E600.
Figure 2. A MAPS generated signature for the T3E 600. The random load curve is marked with the L1 cache miss rate and (lower down) both L1 and L2 miss rates. Figure 2 shows that the sustainable rate of memory loads depends on the size of the problem and the memory access pattern. A large load-bound problem with a random memory access pattern may run 10 or even 100 times slower than a small problem that fits in L1 cache and accesses memory sequentially or better yet has a small working set yielding significant cache reuse. Figure 2 also illustrates that a high hit rate in cache is required on the T3E-600 for the cache to be useful as latency hiding tool. A miss rate of 85% in L2 is sufficient to reduce the speed of random loads to nearly the rate expected for random main-memory loads. (Similar results apply to many cache-based architectures we have measured). When modeling the performance of an application, it is important to map its loops and subroutines to their expected performance on the MAPS curve. Statistics to enable this mapping can be gathered with MetaSim.
5. MetaSim MetaSim is a tool developed by PMaC to generate an Application Profile based on its use of a processor’s memory hierarchy. MetaSim works by gathering statistics on expected cache hit rates of routines and loops in an application. It accomplishes this by snooping the memory bus to determine memory access patterns and catching addresses as they are generated by load and store operations. It then statistically bins these into stride buckets based on comparison with the last N addresses it
has seen. It thus works analogous to the hardware prefetching mechanism on some modern processors to dynamically discover the memory access patterns of the program under instrumented execution. MetaSim generates an Application Profile for a particular machine by processing the application’s address stream against the memory subsystem of a user-supplied parameterization of a (hypothetical or real) machine. MetaSim associates memory access pattern information along with dynamic counts of instructions classified by type with the basic block that generated them. What emerges is a detailed profile of basic blocks sorted by their contribution to the dynamic instruction count and further profiled by instruction mix, ratio of arithmetic operations (as distinct from control flow operations) to memory operations, and memory access pattern. Such a profile is orders of magnitude smaller than an address trace file, yet contains an abundance of information suitable for careful performance analysis. MetaSim is implemented on top of the ATOM toolkit available only on Alphas. We have an ongoing effort to implement it on top of DyninstAPI[3], a portable instrumentation library. However, while MetaSim only runs on Alphas, it can emulate an arbitrary machine with less than 100-fold slowdown and so is much faster than traditional cycle-accurate simulators. Intuitively it may seem that a faster, simpler simulator is a less accurate simulator. However two factors may work counter to this intuition; simulators that model many architectural features have equally many possible sources for error; also, simple regular programs may be predicted within the margin of error of a complex simulator by a simple simulator. Gibson et. al.[7] supply a fairly comprehensive report on these phenomena and show that cycle-accurate simulators may have error greater than 50% and that simple simulators are sometimes more accurate than complex ones. An example may serve to elucidate how MetaSim works: The following is the inner loop of the CG kernel from NPBs version 2.3. do j=1,lastrow-firstrow+1 sum = 0.d0 do k=rowstr(j),rowstr(j+1)-1 sum = sum + a(k)*p(colidx(k)) enddo w(j) = sum enddo It is apparent that the inner loop accesses three arrays, two sequentially and one randomly; the ratio of floating point operations to memory loads is 2/3. MetaSim identifies the two stride-one accesses and the one striderandom access in this basic block. In addition, it generates a list of basic blocks sorted by contribution to the total dynamic instruction count. There are in fact several hundred basic blocks in CG but MetaSim determines that
over 85% of the time is spent in the basic block containing the above loop. Table 1 shows the first few entries in a basic block report generated by MetaSim simulating the execution of NPB Serial CG kernel of size Class W. As can be seen, three basic blocks account for 99% of the total dynamic memory references (and total execution time). When constructing a performance model for CG, at least for this size problem, we need only be concerned with accurately modeling these three basic blocks. The summary report lists the basic blocks in the order of contribution to total dynamic memory references, and provides for each basic block its percentage of dynamic memory references, its ratio of floating point operations to memory operations, the fraction of its memory accesses that are stride-random (the tool can generate a more detailed analysis of stride patterns), and the hit rates in L1 and L2 cache. For something as simple as CG we could obtain the information in Table 1 (likely) by a visual examination of the code. However other kernels from the NAS benchmarks have twenty or thirty basic blocks that contribute significantly to performance, and real apps may have several hundred significant basic blocks. Therefore automated gathering and summary of program properties is essential to enable performance analysis. Table 1.MetaSim output for CG simulating Blue Horizon. BB #
Cum Mem Ref %
308
85.58% 85.58% 0.66
0.33 88.1% 98.61%
309
94.85% 9.27% 0.83
0.44 89.32% 99.97%
311
99.66% 4.81% 0.5
0.37 92.11% 99.98%
Mem Ref %
different from the number of processors the trace was gathered on. However one can simulate the execution of an application on a machine (real or hypothetical) other than that where the trace was gathered. One specifies a processor ratio for the speed of the simulated machine relative to the machine where the trace is gathered. One further specifies network topology and characteristics of the machine to be simulated. DIMEMAS does a good job of modeling the network but provides little guidance in picking processor speed ratios. In this study we supply that deficiency by using MAPS and MetaSim to model single-processor performance.
7. Convolution Method A Convolution Method is a way of mapping a Machine Signature to an Application Profile to arrive at a perprocessor or single processor performance prediction. We determine the predicted sustainable rate of loads and stores by mapping the MetaSim profile block-byblock onto the MAPS curve points that match profiled cache hit rates and memory access patterns. Often, the per-processor performance of memory bound codes is determined by the rate at which the machine can do loads and stores and other architectural and application features are in the noise with respect to performance prediction. Figure 3 below shows a Machine Signature (MAPS plot) and the enclosed table 2 that is the MetaSim data.
FLOPS/ Frac L1 Hit L2 Hit MOPS Rand Rate Rate
MetaSim can directly measure cache hit rates on the machine where it runs; but MetaSim can also calculate the cache hit rates that would have resulted if the same address stream were generated on a processor of arbitrary configuration with respect to cache sizes, line lengths, and associativities. In section 7 we show how we use this information to map each basic block to its expected performance on the MAPS curve and weight each basic block appropriately to predict how a program will perform on an arbitrary processor.
6. DIMEMAS DIMEMAS, developed by the European Center for Parallelism of Barcelona [1], is a network simulator that consumes MPI and/or OpenMP traces to allow modeling of an interconnect of arbitrary topology, and bandwidthlatency characteristics. It does not attempt to simulate the execution of an application on a number of processors
Figure 3. Blue Horizon Machine signature with MetaSim data. The data generated from MetaSim is convolved with the data measured by the MAPS curves. Table 2 is an example of such data for those basic blocks with randomloads from memory. Once the bandwidths have been collected off of the appropriate MAPS curve for all basic blocks, equation 1 (a simple convolution) is used to sum the weighted bandwidths of each basic block to calculate its MetaSim number, which is the applications expected performance on that machine. The ratio of two such numbers is used as a processor speed ratio supplied to the DIMEMAS network simulator.
(1)
n
MetaSim Number = å (Wt. BB i ∗ Rate BB i ) i =1
In equation 1 BBi is a basic block, Wt. BBi is the percentage of total dynamic memory references in the program contributed by this basic block, and Rate BBi is the MAPS measured rate at which MetaSim reports the basic block can sustain loads and stores based on the size of its working set and its access pattern. For the prediction of the serial NPB kernels the calculation of an application’s MFLOPs is needed. The MetaSim number in equation 1 is modified, see equation 2, in order to calculate a serial applications predicted MFLOPs. (2) MFLOPs = n (Wt. BB ∗ Rate BB * Intensity BB )
å
i
i
performance predicted on SDSC's Blue Horizon. Predicted results are compared to actual observed performance. The kernels are predicted well within the accuracy usually associated with cycle-accurate simulation; this at the cost of a sixty-fold slowdown for profiling with MetaSim and a roughly equal amount of time spent in gathering Blue Horizon's MAPS profile. In fact the performance predictions are within the variability of observed runtimes on Blue Horizon. This suggests that high cost of a cycle-accurate simulation (frequently as high as a 6 orders of magnitude slowdown) would be overkill for these memory-bound kernels.
i
i =1
Intensity BBi, in equation 2, is the ratio of floating-point operations to load-store operations in the basic block. This is based on the idea that a basic block will achieve the MFLOPS predicted by multiplying its ratio of floating point operations by the rate at which it is predicted to sustain memory loads and stores (the "memory-bound" rule-of-thumb). We predict that a basic block will contribute a fraction of the total MFLOPS for the program equal to its share of the dynamic memory references (an extension of the "memory-bound" rule-of-thumb). We do not expect that such simple convolutions can yield accurate performance predictions in all cases—next we report the degree of accuracy yielded by such simple models and add additional complexity only when it required to explain observed phenomena.
8. Results The tools and methods described in the previous sections were used in two performance prediction studies. The first was the prediction of the serial versions of the NPB kernels. The convolution method used to map the Application Profile to the Machine Signature developed in this study was also used for the per-processor predicted performance in the second study. The second study was the prediction of the parallel version of the NPB CG and MG kernels. This section describes how we use the tools described in previous sections to arrive at application specific performance models; and how to use the models to predict performance.
8.1. Single Processor Experimental Results Figure 4 below shows the results of applying the convolution in equation 2 to the serial NPB floating-point intensive kernels. As can be seen, the method is extremely accurate for these simple kernels. In this case the kernels were profiled on the Compaq Alpha cluster at Pittsburgh Supercomputer Center using MetaSim and their
Figure 4. Single Processor Kernel Predictions vs. Observed Timings and Error on Predictions of Blue Horizon (Power3 node processors). Our results confirm those indicated by Gustafson[5] and show that the information contained in a few scattered data points for the NPB kernels can be thought of as samples of the performance spectrum provided by the MAPS profile. In other words, if you have a complete picture of the "feeds & speeds" of which the machine is capable, you already have all the information contained in memory-bound kernels; and the performance of those kernels is completely predicted by the MAPS profile. Of course accurately predicting the performance of Blue Horizon would only be useful if the machine were not built yet! But understanding why codes perform as they do, and knowing that in this case the performance is strictly determined by the performance of the memory subsystem, is invaluable for guiding tuning, informing system design, or evaluating architectural design alternatives. We do not wish to make the computational complexity of our simulations greater than that which is needed to explain observed phenomena. Figure 5 shows that error increases when using the simple convolution to predict
performance of several serial NPB mini-applications. (Note: we use the small Class S and Class W sizes because the supercomputer Class A, B and C all run out of main memory on most single processors and thus are slow, easy to predict, and uninteresting). However, the error is less than 20% in all cases for the applications. Given a tradeoff between simulation time and accuracy, and given the 4 orders of magnitude difference between our time complexity and that of traditional cycle-accurate simulators such as[6], and further given that cycle accurate such as[6] and[7] have significant error rates anyway (often exceeding 20%), it may well be thought more practical to base performance estimates on simple, calculable, models of machines and applications such as this one.
estimated per-processor performance is used in this ratio and input into the DIMEMAS trace-based simulation. Figure 6 shows predictions for the MG kernel class B on a Cray T3E-600 and the relative errors for those predictions. In these predictions the theoretical MFLOPs of the processors was compared with the MAPS/MetaSim ratio. Traces were gathered on Blue Horizon and then fed into DIMEMAS, along with a relative processor speed ratio, to predict runtimes on the T3E-600. Two different processor speed ratios were evaluated; • DIMEMAS Flop: the ratio of theoretical peak MFLOPS of the two different processors (600/1500) • DIMEMAS MAPS/MetaSim: The MAPS/MetaSim predicted ratio for the convolved machine signature and application profile (which presumably is a more accurate ratio of performance for the machines on the code in question) It is apparent from Figure 6 that the ratio of peak MFLOPS is not a useful predictor of the performance of this memory-bound kernel. Thus, given the performance of a memory-bound parallel code on a given machine, one will be unlikely to be able to predict its performance on another parallel machine by consulting the Top500 [8] list (for example) to obtain relative peak ratings.
Figure 5. Single Processor Apps Predictions v.s. Observed Timings on Blue Horizon (Power3 nodes processors).
8.2 Multi-Processor Experimental Results It is common to compare parallel machines by their manufacturer’s specifications for peak processor speed and peak bandwidth of interconnect. The Top500 list [8], for example, ranks the 500 largest machines in the world by their performance on a benchmark that correlates highly to peak processor performance. In what follows we show that peak ratings provide little useful insight into the performance of the NPB kernels. But our methods do better by using the real capability of the machine to access data and send messages in the sizes and patterns of the real applications. In order to model and predict the performance of parallel MPI programs, we estimate per-processor performance using MAPS/MetaSim and the Convolution Method described in equation 1. As described in section 6, DIMEMAS uses a relative processor speed ratio. The
Figure 6. Observed vs. predicted times for MG kernel class B on the Cray T3E-600. The capability of the machine to do loads and stores (MAPS data) and the data reference pattern and working set size of the application’s basic blocks (MetaSim) provide enough information to model relative processor speeds within useful error bounds. Figures 7 and 8 display prediction results for CG kernel class B on the T3E and MG kernel class B on PSC’s Compaq based TCSini. In this case, it was necessary to refine the convolution in order to obtain reasonably accurate results. Above we use peak measured bandwidth obtained by a simple ping-pong test as the input to DIMEMAS characterizing the bandwidth
lower than the other two methods of prediction. This confirms that using peak numbers, even measured ones is not a useful way to predict the performance of these applications. A method that takes into account memory access patterns of the application and sustainable rates of memory access of the machine, along with communication size and patterns of the application and sustainable rates of these on the interconnect, yields reasonable accurate performance estimates in reasonable time. One may ask, is a 20% error reasonably useful? This depends on the discriminative power needed. In this case the relative capabilities of the T3E and Compaq based TCSini for these applications is captured. And the shape of the performance curve based on number of processors devoted to the same size problem was captured on both machines. And the factors that explained around 80% of the performance of these applications was reduced to 2 factors—the local memory subsystem and the interconnect. Since both of these machines actually exist we were able to exactly determine the error in our predictions. If we extend these methods to simulate machines that do not exist yet, it is very unclear that cycle-accurate methods can do much better even with many more factors modeled and several orders of magnitude more time spent in simulation.
properties of the machine. This is akin to say a naïve assumption like expecting to get L1 access to main memory regardless of problem size and access pattern. Real applications see bandwidths and latencies on the interconnect that depend on the size of messages exchanged and the communications pattern. In this case we added a more refined Machine Signature (with results shown under CG comm. and MG comm. below) that included measured results from a MPI benchmark with a similar communication pattern to each kernel, developed by PMaC. These new bandwidths were used in the prediction and show much improved predictions over the peak MPI bandwidths predictions.
9. Conclusion Figure 7. Observed vs. predicted times for CG kernel class B on the Cray T3E-600.
This paper has given an update on our ongoing efforts to develop performance models that are not as naïve as extrapolating performance from peak machine specifications, nor as difficult to compute as cycleaccurate simulations, and can provide useful insight into the factors that affect performance on serial and parallel systems. Future work will include the extension of these techniques to more and larger applications and the (judicious) introduction of more modeling factors if they can be shown to greatly improve accuracy without greatly increasing the computational complexity of the models.
Acknowledgments This work was sponsored the Department of Energy Office of Science through SciDAC award “High-End Computer System Performance: Science and Engineering”.
Figure 8. Observed vs. predicted times for MG kernel class B on the TCSini. The average error for the MAPS/MetaSim ratio used with peak MPI bandwidths is 44%. This was a slight improvement over the 51% average error for the predictions involving peak processor MFLOPs and peak MPI bandwidths. But it required predictions using the MetaSim ratio and more the complex interconnect signature to yield in an average error of 23%, significantly
References 1. 2. 3.
See http://www.cepba.upc.es/tools_i.html See http://www.cs.virginia.edu/stream/ B. Buck, J. Hollingsworth, “An API for Runtime Code Patching’’, The International Journal of High
4. 5.
6.
7.
8. 9.
10.
11.
12.
13
14.
15.
Performance Computing Applications , 2000 See http://science.nas.nasa.gov/Software/NPB. J. Gustafson, R. Todi, “Conventional Benchmarks as a Sample of the Performance Spectrum”, Proceedings of the 31st Hawaii International Conference on System Sciences (HICSS'98) , 1998. J. Lo, S. Egger, J. Emer, H. Levy, R. Stamm, and D. Tullsen, “Converting Thread-Level Parallelism to Instruction-Level Parallelism via Simultaneous Multithreading”, ACM Transactions on Computer Systems , August 1997. J. Gibson, R. Kunz, D. Ofelt, M. Horowitz, J. Hennessy, and M. Heinrich. “FLASH vs. (Simulated) FLASH: Closing the Simulation Loop”, In Proceedings of the 9th International Conference on Architectural Support for Programming Languages and Operating Systems (ASPLOS), pages 49-58, November 2000. See top500.org S. E. Chatterjee, E. Parker, P. J. Hanlon, and A. R. Lebeck., “Exact Analysis of Cache Misses in Nested Loops,” ACM SIGPLAN 2001 Conference on Programming Language Design and Implementation, June 20-22, 2001, Snowbird, Utah (to appear). L. DeRose, and D. A. Reed, “Pablo: A Multilanguage, Architecture-Independent Performance Analysis System”, International Conference on Parallel Processing, August 1999. L. DeRose, Y. Zhang, and D. A. Reed, “SvPablo: A Multi-Language Performance Analysis System,” 10th International Conference on Computer Performance Evaluation – Modeling Techniques and Tools – Performance Tools’98, Palma de Mallorca, Spain, September 1998, pp. 352-355. I. T. Foster, B. Toonen and P. H. Worley, “Performance of Parallel Computers for Spectral Atmospheric Models”, Journal Atmospheric and Oceanic Techology, vol. 13, no. 5, pg. 1031-1045, 1996. I. T. Foster and P. H. Worley, “Parallel Algorithms for the Spectral Transform Method”, SIAM Journal on Scientific and Statistical Computing, vol. 18, no. 3, pg. 806-837, 1997. W. D. Gropp, D.K. Kaushik, D.E. Keyes and B.F. Smith, “Toward Realistic Performance Bounds for Implicit CFD Codes”, Proceedings of Parallel CFD’99, May 23-26, 1999, Williamsburg, Virginia. S. Ghosh, M. Martonosi and S. Malik, “Caches Miss Equations: A Compiler Framework for Analyzing and Tuning Memory Behavior”, ACM Transactions on Programming Languages and Systems, vol. 21, no. 4, pg. 703-746, July, 1999.
16.
17.
18.
19. 20.
21.
22.
23.
J. K. Hollingsworth and P. J. Keleher, “Prediction and Adaptation in Active harmony”, The Seventh International Symposium on High Performance Distributed Computing, July 1998, pg. 180-188. J. K. Hollingsworth, P. Keleher and K. D. Ryu, “Resource-Aware Meta-Computing”, in Advances in Computers, M. V. Zelkowitz, ed., Academic Press, 2000, pg. 109-169. C. L. Mendes, and D. A. Reed, “Integrated Compilation and Scalability Analysis for Parallel Systems”, International Conference on Parallel Architectures and Compilation Techniques (PACT’98), Paris, France, October 1998, pp.385392. S.E. Perl and W.E. Weihl, “Performance Assertion Checking”, Proc. 14th ACM Symp. Operating Systems Principles, 1993, pp. 134-45. J.S. Vetter, “Performance Analysis of Distributed Applications Using Automatic Classification of Communication Inefficiencies”, Proc. ACM Int'l Conf. Supercomputing (ICS), 2000. D. A. B. Weikle, S.A. McKee, K. Skadron and W.A. Wulf, “Caches as Filters: A Framework for the Analysis of Caching Systems”, Third Grace Hopper Celebration of Women in Computing, Sept. 14-16, 2000, Cape Cod, Massachusetts. P. H. Worley, “Impact of Communication Protocol on Performance”, Second International Workshop on Software Engineering and Code Design in Parallel Meteorological and Oceanographic Applications, June 15-18, 1998, Scottsdale, AZ, NASA Conference Publication 1998-206860, pg. 277-288. P. H. Worley, “Performance Evaluation of the IBM SP and the Compaq AlphaServer SC”, ACM International Conference of Supercomputing 2000, Santa Fe, New Mexico, May 8 - 11, 2000.