MODELING CAPACITY IN AD HOC NETWORKS∗ Laura Marie Feeney Computer and Network Architecture Laboratory Swedish Institute of Computer Science Kista, Sweden
and Department of Information Technology Uppsala University Uppsala, Sweden
[email protected]
Christian Rohner Department of Information Technology Uppsala University Uppsala, Sweden
[email protected]
Abstract
1.
We describe a simple network model for efficiently simulating the CBR flow capacity of a multi-hop wireless network. The model is particularly intended for studying the behavior of asynchronous protocols, particularly power save protocols, where it is useful to examine many scheduling variations as well as many topologies and network configurations. We describe our experience using the model in some experiments in which we examine how the network performance is sensitive to the timing to scheduling variations induced by the operation of a simple power save protocol. We note that the model also seems seems suitable for combinatoric and probabilistic analysis, which is on-going work.
Introduction
In this poster abstract, we describe a simplified network model that we use for efficiently simulating the CBR flow capacity and latency of an ad hoc network. The model is particularly intended for studying the behavior of asynchronous power save protocols, where it is necessary to
∗ insert
thanks here
2 consider not only the usual large sample of network topologies, but also the timing relationships between the nodes schedules. We believe that the model is also suitable for studying various questions of latency, as well. We also describe our experience using the model in some experiments and comment on some artifacts in the results. The model also seems suitable for combinatoric analysis and we are pursuing work in this direction.
2.
Background
An ad hoc network is a decentralized, multi-hop wireless network in which nodes cooperatively provide routing and other services. Among the key constraints governing such networks are the limited communication capacity, which is the result of complex patterns of intra- and inter-flow contention and interference ?, and limited battery capacity. The limited battery capacity requires that nodes conserve energy by keeping their network interface in the low energy consumption sleep state as much as possible. Because nodes in a multi-hop routing environment cannot predict when they must be available to receive and forward traffic, nodes must develop protocols that allow them to wakeup and rendezvous with their neighbors to exchange pending traffic. A variety of power save protocols have been proposed for ad hoc networks: Many such proposals are based on synchronous operation, where nodes periodially exchange traffic announcement messages (e.g. ?. The capacity and energy efficiency of this approach can be significantly improved by distributed election to to partition the network into clusters and routing backbones (e.g. ?). A number of asynchronous protocols have also been proposed. These include randomized protocols (e.g. ?), deterministic protocols based on structures such as quorum scheduling and block coding (e.g. ?, ?, ?), as well as hybrid protocols (e.g. ?). The operation of an asynchronous power impose a wakeup schedule distribution on the network, as communication between neighboring nodes is possible only when both nodes We hypothesize that these patterns can affect the capacity of the network - the model The model and its implementation in a simulation environment make it possible to quickly obtain a sense the variation in performance especially in response to the natural timing variation that results from the operation of power save protocols.
Modelling capacity in ad hoc networks
3
They are not intended to be a substitute for more detailed simulation environments, We present the network model, describe its use in a series of experiments we performed investigating the affect of timing patterns on network performance, and discuss a hypotheses about some observed internal behaviors of the model.
3.
Network Model
Because our goal is to study the effect A simplified model of network operation allows us to efficiently examine the network performance of many wakeup distributions for each of many traffic and topology scenarios. This goal naturally requires some compromises in fidelity. The model is based on the steady state operation of a static network and (CBR) traffic whose periodicity is compatible with the periodicity of the wakeup schedule. This approach allows us to avoid modeling the time evolution of the network and evaluate only a single “representative” period. In this approach, only the data traffic, not the operational traffic associated with the power save protocol, is modeled. Shortest path routes are assumed; the operation of a routing protocol is not modeled. Transient variations in traffic, such as the route discovery and repair messages associated with on-demand routing protocols, are not modeled. Similarly, local background traffic, such as link-layer HELLO messages, is not modeled. The (CSMA-CA) MAC layer is assumed to operate without error to prevent conflicting transmissions and to avoid large variation in channel access times. The model is clearly less realistic than a conventional simulator such as ns-2, but it allows us to efficiently simulate (statistically) many wakeup schedule distributions for each of many topologies. Moreover, we are more interested in qualitative behavior, i.e. to distinguish the relative sensitivity to timing variation rather than absolute capacity or latency measurements.
3.1
Model description
The model is described in more detail below. In particular, we examine the timing model, the communication model, and the traffic model.
Timing model. Because the wakeup schedule and traffic are assumed to have the same (or compatible) periods and no transient effects
4
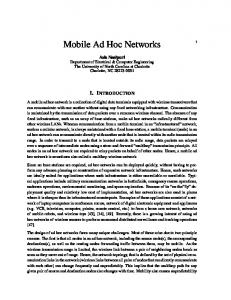
B −> D
D A
C −> A
A 00000110000000011000 B 00000110000000011000
B
C (a) Sample topology
C 00000000000000011000 D 00000110000000000000 (b) Representation of the channel occupancy for transmissions C → A and D → B. Transmissions from C are assumed not to result in interference at D and vice verse.
or timing variability are introduced by the lower layers, it is only necessary to model a single period of the wakeup schedule. The period is divided into resolution time slots and all events are defined in terms of slots. The resolution determines the granularity of the simulation; it is not intended to imply slotted or synchronous operation of the MAC layer. (Indeed, slot synchronization in TDMAbased ad hoc networks is a well-known problem ?).
Communication model. Nodes are deployed on a rectangular field, with x- and y-coordinates uniformly distributed random variables over the size of the field. Nodes are stationary. Each node has a circular transmit radius xmit and interference radius intf ≥ xmit. Nodes are assumed to communicate without error to any node within their transmit radius. Nodes within the interference radius will sense the channel as busy. The MAC protocol is assumed to operate without error to schedule channel access so as to prevent conflicting transmissions. For each node, the state of the channel is represented as a sequence of resolution values indicating the channel state in that slot. A node can transmit in a slot if the channel is free at both the transmitter and receiver. Each transmission occupies the channel at all nodes within interference range of the transmitter or within communication range of the receiver. This rule roughly models the RTS/CTS operation of IEEE 802.11. The time that the transmission occupies the channel is intended to reflect the complete channel access process, with an implicit assumption that the variation in channel access time (e.g. random CW backoff) is small relative to the allocated time. A transmission is feasible if the transmitter and receiver both have a unoccupied channel for a sequence of contiguous time slots corresponding
Modelling capacity in ad hoc networks
5
to the packet transmission time. The transmission is assigned to the earliest set of slots that meets these criteria. This assignment is fixed and is not adapted to the optimize the channel utilization. (Such explicit optimization would be probably be complex in practice, as well.) Because the model is based on analysis of a single period, it implicitly assumes that the MAC protocol will obtain consistent scheduling. That is, node T is assumed to transmit to node R at the same time in each period. This assumption is true in many TDMA MACs. In CSMA MACs there will be less consistency in the transmission schedule, but the expectation is that that period that is modeled will be “representative” of the average performance. In addition to its computational efficiency, one advantage of the model is that it is straightforward to deal with hypothetical questions about channel availability (e.g. What proportion of the time is the channel still available at some node?).
Sleep/wake schedule. The operation of the power save protocol is represented by the marking the node as unavailable during the times when a node is asleep. In order for a transmission to be feasible, both the channel and the node must be available in the relevant slots. Traffic model. All flows are assumed to be CBR flows with the same (or compatible) period as the power save protocol, e.g. a CBR flow with ten packets per second and power save protocol with a period of 100 ms. As stated above, no other traffic (e.g. overhead) is modeled. A flow is feasible if each transmission along its route is feasible in a single period. That is, the source and each forwarding node must be able to transmit once each each period, so that one packet enters and one packet leaves the network in each period. (For a long period in the power save protocol and faster CBR flow, several packets would enter and leave the network.) Latency, that is, whether the packet is transmitted in the same period or the following one, must be tracked separately. Routes are fixed, shortest path routes, computed once for each topology. More significantly, the routing is not adaptive, so it is not possible for flows to dynamically“discover” a longer, but still feasible route. Some throughput models (e.g. ?), as well as many proposed routing protocols, indicate that adaptive routing can be an effective strategy. Such adaptation is not, however, directly supported in standards-oriented protocols (e.g. ?). Implementation note. The model is computationally simple because connectivity, interference, wakeup schedules, and channel state
6 are represented as integer matrices. Testing and setting the channel occupancy matrix can be done using simple matrix operations. The heaviest operation is a matrix multiplication of 1 × slots by slots × slots matrices. The simulation is implemented in Matlab and is currently capable of computing CBR flow capacity in large (> 125 nodes) networks for 50 topologies × 350 power save schedule distributions in less than 20 hours on a conventional desktop machine. (The authors expect to be able to make the code available to interested researchers.)
4.
Experience using the model
We have recently been using this model to study the impact of the random scheduling variation imposed the power save protocol on overall network capacity. Intuitively, one would expect that the sleep/wake pattern of a power save protocol would affect the capacity of the network – interfering transmissions should be “out of phase” with each other as much as possible. We outline our experience with using the model and simulation to try to understand whether there exist particularly good or bad schedules (with an eventual goal of finding ways to obtain them explicitly).
4.1
Simulation experiment
We define our experiment as follows: We generate a fixed topology and an offered load that is a set CBR flows bewteen randomly selected source-destination pairs. The network is slightly under-dimensioned: most, but not all, flows are admissible. Each flow in the offered load is evaluated in turn; the flow capacity is the total number of admitted flows. (The limited size of the offered load helps prevent “cherry picking” easy (e.g. isolated, one-hop) flows.) For each topology, we generate a large number of wakeup schedule distributions and determine the flow capacity of each. It is this computational load – to simulate a (statistically) large number of wakeup schedules for each of a (statistically) large number of topologies – that led us to build a simplified alternative to more realistic discrete event simulators. The flow capacity measurements will define some probability distribution. A narrow distribution implies that the performance is not too much affected by wakeup distribution: what is good for some flows is bad for others and it is difficult to obtain some overall advantage. Conversely, a flatter performance distribution means that changing the wakeup distri-
7
Modelling capacity in ad hoc networks
probability
low sensitivity high sensivitiy
"performance"
Fig. 1: In our experiment, we would like to distinguish between these cases. That is, we are more interested in the shape of the curve than in absoulute values. bution – easy to do, given that the system is defined to be asynchronous – is likely to noticeably affect the network performance. All of the experiments use a resolution of 500. For a wakeup schedule period of 100ms, each slot corresponds to 200µs. The power save protocol uses 55% duty cycle, so that each node is awake just over half of the time, as required to obtain the predictable overlap described above. In our example, this would correspond to a wakeup schedule of 55ms on and 45ms off. The experiments also used a variety of network topologies (up to 150 nodes) and sizes, with mean path lengths up to 5 hops. All the network topologies were (nearly) fully connected. The simulation results show that the flow capacity is roughly normally distributed with regards to wakeup schedule variation. Over a wide range of scenarios, most of the wakeup schedules have a capacity centered about the median. The extremes, however, vary 20-25% about the median, implying that the best distributions are nearly twice as good as the worst - a substantive difference.
4.2
Internal behaviors
To better understand how the operation of the power save protocol affects that performance of the network, we examined some internal statistics of the simulation data. In particular, we study the relationship between the number of admitted flows and their mean path length. One explanation for the observed variation in the number of admitted flows simply mirrors the variation in their path-length and has little to do with the wakeup schedule distribution. That is, each topology accommodates some number of transmissions and if more flows are admitted, their mean path length must be smaller. However, the simulation results show that total number of transmissions is not constant - it varies as much as the flow capacity - confirming that the wakeup schedule distribution is indeed significant. Moreover, we can calculate for each topology the correlation coefficient between the
8 correlation between flow capacity and mean path length mean and one std dev large network " " small network " "
correlation coefficient
0.6 0.4 0.2 0 -0.2 -0.4 0
20
40
60
80
100
120
140
nodes
Fig. 2: Unexpected positive correlation between mean path length and flow capacity. C −> A
C −> A A −> BB −> D A
C
D
A 00001111111110000000
B
B 00001111111110000000 C 00001111110000000000 D 00000001111110000000
(a) Sequentially scheduled transmissions may be more efficiently packed...
A
C
B −> D
A −> B
D
A 00111000011100111000
B
B 00111000011100111000 C 00111000000000111000 D 00000000011100111000
(b) than transmissions belonging to different flows.
number of admitted flows and their mean path length. If the number of transmissions is roughly fixed, the number of admissible flows increases, then their mean path length must decrease and we expect the correlation between these two values to be negative. On the contrary: We see that the correlation coefficient are generally positive, with mean values from +0.1 − +0.29. Moreover, the high standard deviation in correlation coefficient and examination of the data shows that there are a fair number of topologies which exhibit positive correlation (> 0.4 − 0.7), while there are almost none that exhibit similar negative correlation. Although such a correlation coefficient is not strongly positive, it is rather sunrising that it is positive at all. One hypothesis is that this effect is due to the higher probability of efficient “packing” of a set of transmissions when they are scheduled in sequence as part of long path-length flow. By contrast, if transmissions are scheduled independently, there is greater risk that the transmissions are scheduled less contiguously, leaving intervals in which the channel is available, but the (CBR) packets cannot be scheduled. The effect would be less obvious in a less rigid timing model or if a more natural mix of background and management traffic were included in the model.
9
nodes 1..N
Modelling capacity in ad hoc networks
0
T
X X 0
0
0
R 0
T
0
0
X 0
R T
0
0
0
0
X R 0
0
0
0
X 0
slots 1..S
Fig. 3: We can model the probability of channel occupancy at a given node during a given slot as a “balls in boxes” problem.
We also note that this effect does not seem to be related to the actual variation, which did not show any dependence on the magnitude of the correlation coefficient for any given topology.
5.
Analytic model
In addition to using the network model for simulation experiments described above, we have also made some preliminary investigation into using the model analytically as well. In particular, we would like evaluate the probability that k out of K candidate transmissions are feasible, for the case of one-hop and two-hop transmissions. To do this, we propose a simple geometric model for computing the probability that a node is exposed to interference from a transmission between two other nodes, combined with a combinatoric analysis of the probability that one or more of 1..k − 1 previous transmissions has taken place in that slot. This study is the topic of ongoing work.
6.
Conclusions
In this poster abstract, we have presented the design and implementation of a network model for studying capacity and latency variation in ad hoc networks. We present an experiment we have performed using the model and discussion some of the internal behaviors that we have observed. We suggest that the model is also amenable to analytic evaluation.
Acknowledgments The authors would like to acknowledge helpful contributions of Bengt Ahlgren, of the Computer and Network Architecture Laboratory at
10 SICS, and Supriya Krishnamurthy of the Distributed Systems Laboratory at SICS.
References I can’t get their provided bibliography stuff to work properly. It doesn’t seem to accept bibtex...