Modeling chlorophyll-a and dissolved oxygen concentration in tropical floodplain lakes (Paraná River, Brazil) Rocha, RRA., Thomaz, SM.*, Carvalho, P. and Gomes, LC. Núcleo de Pesquisas em Limnologia Ictiologia e Aqüicultura, Universidade Estadual de Maringá – UEM, Av. Colombo, 5790, CEP 87020-900, Maringá, PR, Brasil *e-mail:
[email protected] Received November 10, 2008 – Accepted March 7, 2009 – Distributed June 30, 2009 (With 3 figures)
Abstract The need for prediction is widely recognized in limnology. In this study, data from 25 lakes of the Upper Paraná River floodplain were used to build models to predict chlorophyll-a and dissolved oxygen concentrations. Akaike’s information criterion (AIC) was used as a criterion for model selection. Models were validated with independent data obtained in the same lakes in 2001. Predictor variables that significantly explained chlorophyll-a concentration were pH, electrical conductivity, total seston (positive correlation) and nitrate (negative correlation). This model explained 52% of chlorophyll variability. Variables that significantly explained dissolved oxygen concentration were pH, lake area and nitrate (all positive correlations); water temperature and electrical conductivity were negatively correlated with oxygen. This model explained 54% of oxygen variability. Validation with independent data showed that both models had the potential to predict algal biomass and dissolved oxygen concentration in these lakes. These findings suggest that multiple regression models are valuable and practical tools for understanding the dynamics of ecosystems and that predictive limnology may still be considered a powerful approach in aquatic ecology. Keywords: model, chlorophyll-a, oxygen, floodplain lakes.
Predição das concentrações de clorofila-a e oxigênio dissolvido em lagoas da planície de inundação do Alto Rio Paraná Resumo O objetivo desse estudo foi o de construir modelos para predizer as concentrações de clorofila-a e oxigênio dissolvido em lagoas da planície de inundação do Alto Rio Paraná. Para tanto, foram selecionadas 25 lagoas na planície de inundação. O critério de Akaike (AIC) foi utilizado para a seleção dos modelos. Posteriormente, os modelos foram validados utilizando dados independentes obtidos nas mesmas lagoas. As variáveis que explicaram significativamente as concentrações de clorofila-a (52%) foram pH, condutividade elétrica, material em suspensão (relação positiva) e nitrato (relação negativa). As variáveis que melhor explicaram as concentrações de oxigênio dissolvido (54%) foram pH, área das lagoas, nitrato (relação positiva), temperatura da água e condutividade elétrica (relação negativa). A elevada capacidade preditiva desses modelos foi demonstrada através da utilização de dados independentes. Esses resultados demonstraram que a limnologia preditiva continua sendo uma importante área de pesquisa na ecologia aquática. Palavras-chave: modelo, clorofila-a, oxigênio, lagoas.
1. Introduction The need for prediction is now widely recognized and frequently articulated as an objective of research programs in aquatic sciences. Predictions are required to anticipate the future state or dynamics of a system (temporal predictions), to characterize a new place (spatial predictions), and to characterize a new circumstance (altered systems) (Pace, 2001). The empirical limnology school advocates prediction mainly in the form of regression models (Rigler, 1982; Rigler and Peters, 1995; Gomes and Miranda, 2001; Pace, 2001), using a small number of variables, but with a long-term data set. Braz. J. Biol., 69(2, Suppl.): 491-500, 2009
An intuitive premise for ecological modeling is that interacting abiotic variables create environmental gradients that shape the spatial patterns of natural populations. In general, phytoplankton is the major source of pelagic carbon, and its abundance can be estimated through chlorophyll-a concentration. The relationship between nutrients and chlorophyll-a concentration in aquatic systems has yielded insights on nutrient limitation and is a valuable management tool (Peters, 1986). Regression and correlation analysis are widely used in water quality management as supplementary tools for 491
Rocha, RRA. et al.
dynamic models. These types of relationships can be used to improve estimations of chlorophyll-a and oxygen concentration in tropical aquatic ecosystems (e.g., Huszar et al., 2006). For instance, the Upper Paraná River floodplain (Paraná River, Brazil) is characterized by its high heterogeneity of aquatic habitats and diversity of organisms (Agostinho and Zalewski, 1995; Agostinho et al., 2004; Aoyagui and Bonecker, 2004). However, few predictive models have been described for this system (e.g., Thomaz et al., 2001) or for other Neotropical floodplains. Chlorophyll and oxygen are relevant parameters in tropical and sub-tropical river-floodplain systems. Phytoplankton (indexed by chlorophyll concentration) constitute an important carbon source for fish (e.g., Araújo-Lima et al., 1986; Lopes et al., 2007; Hoeinghaus et al., 2008), despite the apparent predominance of macrophytes in river-floodplain systems (Hoeinghaus et al., 2007). In addition, phytoplankton can develop conspicuously in floodplain lakes, leading to eutrophic conditions, especially during low-water periods (Carvalho et al., 2001; Rodrigues et al., 2002). Similarly, oxygen is important for aquatic fauna in floodplains, where extreme seasonal fluctuations in oxygen concentration are observed (Thomaz et al., 1992). This gas is also considered one of the most important abiotic factors affecting fish (Crampton, 1998; Agostinho et al., 2004; 2007; Soares et al., 2006) and invertebrate distribution (Bonecker and Lansac-Tôha, 1996; De Melo et al., 2004). Decreased oxygen concentration during rising and high waters can lead to fish kills in floodplain habitats (Hamilton et al., 1997). In this study, we used an extensive spatial (25 lakes) and temporal (4 samples per year) data set obtained in lakes of the Upper Paraná River floodplain to identify predictors or environmental forcing functions that could explain chlorophyll-a and dissolved oxygen concentrations. This stretch of the Paraná River and its remnant floodplain (the last stretch within Brazil) are key for maintaining the unique biological diversity of this river in the Brazilian territory, already threatened by numerous human impacts (e.g., flow regulation; Agostinho and Zalewski, 1995; Agostinho et al., 2004). We also tested the predictions of the models with independent data sets (validation), to evaluate the potential of these models. Finding models that represent causal relationships is fundamental to determine the most important variables linked to primary production and eutrophication (indexed by chlorophyll) and the integrity of bodies of water for wildlife (indicated by dissolved oxygen). These models represent important tools to predict the future state of the upper Paraná River floodplain, providing insight into possible management actions aimed at conservation. 1.1. Study area The Paraná basin covers a large area of the Brazilian territory (~802,150 km2). Several dams were built during the last three decades in the Paraná River and in its 492
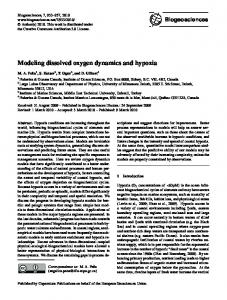
main tributaries. In the upper portion, the Paraná River presents a floodplain (5-20 km wide), which represents the last undammed stretch within Brazil. Three conservation units were recently created in this region, which is vital for biodiversity conservation of biological diversity and ecological functioning of this large river. The Paraná and its floodplain remnant are also one of the Brazilian sites belonging to the Long Term Ecological Research Program (LTER). The data set used includes 25 lakes located in the Upper Paraná River floodplain. These lakes belong to three different ecoregions, determined by the river that affects each most intensively: the Paraná, Baía or Ivinheima rivers (Figure 1). Some lakes are permanently connected with a river whereas others are connected only during high water periods (usually from December to March), due to overflow; however, communication through ground water is constant. Morphometric and limnological characteristics varied intensely among lakes (Thomaz et al., 2004a; Table 1).
2. Methods Water samples were taken in different seasons (February, May, August and November 2000), about 10 cm below the surface. Sampled lakes were shallow (depth < 2 m), except during high water periods when depths reached ~4-5 m. However, vertical mixing is common in these shallow lakes and stratification in physicochemistry is rarely found (Thomaz et al., 1992; Rodrigues et al., 2002; Rocha and Thomaz, 2004). Thus, surface samples are adequate to characterize water quality. For all 25 lakes, we obtained data for 19 morphometric and limnological variables: lake area (meters), water depth (meters), Secchi disc depth (meters), pH and electrical conductivity (μS.cm–1; digital portable potentiometers), dissolved oxygen (mg.L–1) and temperature (°C; digital portable YSI), turbidity (NTU; portable turbidimeter LaMotte) and total alkalinity (μEq.L–1; Gran titration; Carmouze, 1994). All these variables were measured during samplings. Sub-samples were filtered (Whatman GF/C membranes) and used to quantify chlorophyll-a (spectrophotometer, after acetone extraction; Golterman et al., 1978) and total seston (mg.L–1; gravimetry) concentrations. Total nitrogen concentrations (μg.L–1) were obtained after oxidation of the organic and inorganic nitrogen to N-nitrate, which was reduced to N-nitrite and examined in a spectrophotometer with a Flow Injection Analysis system (Zagatto et al., 1981). Nitrate and nitrite levels (μg.L–1) were determined spectrophotometrically with a Flow Injection Analysis System (Zagatto et al., 1981). N-ammonium concentrations (μg.L–1) were measured spectrophotometrically according to Mackereth et al. (1978). Total phosphorus (μg.L–1), reactive phosphate (μg.L–1) and dissolved phosphate (μg.L–1) were determined in a spectrophotometer after ascorbic acid-moBraz. J. Biol., 69(2, Suppl.): 491-500, 2009
Modeling limnological variables in tropical lakes
Figure 1. Study area in the Upper Paraná River floodplain. The lakes studied are connected to the Paraná, Baía and Ivinheima rivers; they are located within the dashed circles.
lybdate reaction (Golterman et al., 1978). A Shimadzu TOC 5000 apparatus measured dissolved organic carbon (DOC; mg.L–1). 2.1. Data analysis Before analyses, all data, except pH, were log-transformed to meet the assumptions of regression analysis. Multiple regression analysis was performed to obtain models that predicted chlorophyll-a and dissolved oxygen concentrations, taking into account the other limnological variables as predictor variables (see Table 1 for the list of variables). To circumvent multicollinearity problems, strongly correlated predictors (e.g., total seston and turbidity, electrical conductivity and total alkalinity) were not included in the same model. Thus, considering the different pairs of correlated variables, only the ones with the highest predictive power were retained in the multiple regression models. After this first step, a total of ten variables were retained to model chlorophyll-a and dissolved oxygen concentrations by different combinations of these variables as predictors: lake area (Area), temperature (Temp), pH, electrical conductivity (EC), total seston (TS), total phosphorus (TP), Nitrate (N-NO3), nitrite (N-NO2), N-ammonium (NH4) and dissolved organic carbon (DOC). Braz. J. Biol., 69(2, Suppl.): 491-500, 2009
The best models were selected using the model selection approach (Burhnham and Anderson, 1998). Akaike’s Information Criterion (AIC) is a recent tool that has been widely used as a criterion for model selection in ecology, but it is rarely applied to limnological data. Basically, AIC is defined as: AIC = - 2Ln[L(x|Mi)] + 2K
(1)
where Ln[L(x|Mi)] is the log-likelihood of data x given the model Mi; K is the number of parameters in the model. This measure combines the goodness of fit of a model to data and the number of estimated model parameters (complexity). In particular, we examined ∆i, the difference between AIC for any particular model and the minimum AIC for the best, most parsimonious model (best fit and complexity). As a rule of thumb, ∆i > 4-7 suggests that a model does not have strong empirical support (Burnham and Anderson, 1998). We validated the resulting models using independent data obtained in 2001 in the same lakes. Computer software for analyses included the open-source R and Statistica. Due to the high number of possible models (a total of ten variables considered), only the best one (lower AIC) is presented. 493
494
Area (m) Depth (m) Temperature (oC) Secchi depth (m) pH Electrical conductivity (μS.cm–1) Alkalinity (μEq.L–1) Turbidity (NTU) DO (mg.L–1) TS (mg.L–1) chlorophyll-a (μg.L–1) Nitrate (μg.L–1) Nitrite (μg.L–1) N-ammonium (μg.L–1) Total-N (μg.L–1) Ortho-P (μg.L–1) Dissolved-P (μg.L–1) Total-P (μg.L–1) DOC (mg.L–1)
Variables
Ivinheima River Mean (SD) Min 41.22 (42.77) 2.30 2.96 (0.84) 1.00 23.77 (3.71) 17.20 0.56 (0.46) 0.10 6.67 (0.53) 5.74 42.88 (12.44) 22.00 281.02 (161.27) 12.45 39.33 (45.02) 0.59 6.37 (1.42) 3.18 14.47 (10.82) 0.00 14.89 (25.11) 0.00 59.22 (82.23) 0.00 1.87 (2.0) 0.00 6.96 (12.38) 0.00 425.66 (184.61) 205.00 6.88 (9.68) 0.00 16.49 (15.02) 2.33 90.25 (185.43) 9.03 8.56 (5.83) 2.82 Max 113.80 4.25 28.50 2.40 8.62 95.00 697.60 217.00 8.88 46.00 143.34 355.00 10.00 66.18 879.61 48.22 78.74 1170.62 28.94
Baia River Mean (SD) Min 8.11 (8.66) 0.36 2.36 (0.49) 1.80 24.21 (4.09) 18.10 0.97 (0.44) 0.20 6.34 (0.55) 5.72 32.92 (10.51) 22.60 266.25 (205.62) 52.12 12.49 (14.98) 2.00 4.80 (1.99) 1.50 8.85 (7.83) 2.30 10.25 (14.9) 1.82 28.72 (86.86) 0.00 1.13 (0.91) 0.00 4.20 (9.16) 0.00 421.57 (183.52) 164.57 3.73 (5.51) 0.00 15.49 (24.85) 0.55 51.89 (48.97) 12.19 7.64 (3.20) 3.65 Max 27.20 4.00 31.80 2.00 8.85 75.40 870.30 67.60 10.87 34.50 89.56 485.95 4.05 45.38 902.50 25.73 144.23 289.57 20.01
Paraná River Mean (SD) Min 6.75 (5.96) 0.06 1.16 (0.52) 0.20 24.52 (4.04) 19.20 0.65 (0.28) 0.20 6.5 (0.34) 5.97 59.84 (16.91) 33.20 477.34 (277.24) 8.99 22.83 (21.72) 4.10 4.60 (2.14) 0.34 17.43 (14.04) 3.07 18.71 (16.75) 2.46 23.36 (48.57) 0.00 1.28 (1.04) 0.00 9.34 (19.79) 0.00 375.82 (187.14) 165.28 2.78 (2.96) 0.00 12.66 (9.56) 1.98 58.17 (39.96) 9.77 4.47 (2.11) 2.16
Max 14.10 2.25 32.60 1.20 7.47 107.50 1187.00 91.40 8.35 53.33 60.07 195.32 3.26 88.32 922.00 7.81 42.23 141.10 11.22
Table 1. Mean, standard deviation (SD), minimum (min) and maximum (max) values of each variable obtained in lakes connected to the rivers (Ivinhema, Baia and Paraná) in the Upper Paraná River floodplain (DO = dissolved oxygen; TS = total seston; DOC = dissolved organic carbon).
Rocha, RRA. et al.
Braz. J. Biol., 69(2, Suppl.): 491-500, 2009
Modeling limnological variables in tropical lakes
3. Results Overall, sampled lakes presented a wide range of morphometrical and limnological conditions (Table 1). Mean values of dissolved oxygen, nitrate, nitrite, total nitrogen, reactive phosphate, total phosphate and turbidity were higher in lakes of the Ivinheima River. Lakes of the Paraná River showed higher values of electrical conductivity, alkalinity and ammonium, whereas those of the Baía river had the highest mean Secchi depth and intermediate values for most of the remaining variables (Table 1). Following the AIC criterion, the best, most parsimonious model (fit and complexity), to predict chlorophyll-a concentration was:
concentration in these lakes. Similarly to chlorophyll, there was no trend in residuals along the oxygen concentration gradient (Figure 2b). Thus, the proposed model is adequate to predict dissolved oxygen concentration in the Paraná River floodplain lakes. To test the predictive power of both models, we used an independent data set obtained in the same lakes in 2001. We observed a significant relationship between chlorophyll-a concentrations estimated through the model and the chlorophyll-a concentrations measured independently in 2001 (r = 0.50; p < 0.001; n = 50) (Figure 3a). A significant relationship was also observed between dissolved oxygen concentrations estimated through the model and concentrations measured independently in 2001 (r = 0.75; p < 0.001; n = 43; Figure 3b). Therefore,
log (Chlor) = –3.747 + 0.422 (pH) + 0.528 log (EC) + 0.682 log (TS) – 0.191 log (N-NO3) (2)
a
with AIC = 198.2; ∆I = 34.1; n = 97; R² = 0.52; F = 36.89; p < 0.001. Predictor variables that significantly explained chlorophyll-a concentration were pH, electrical conductivity (EC), total seston (TS) (positive correlations) and nitrate (N-N03) (negative correlation) (Table 2). This model explained 52% of the total variation in levels of chlorophyll-a in these lakes. Residual analysis indicated that this model was adequate for describing chlorophyll-a (Figure 2a). Therefore, this is an indication that the resulting model is adequate to predict chlorophyll-a concentrations in the Paraná River floodplain lakes. The best, most parsimonious model to predict dissolved oxygen concentration was:
b
log (DO) = 2.92265 + 0.30255 (pH) + 0.06172 log(Area) – 0.60086 log (Temp) + 0.03999 log (N-NO3) – 0.36633 log (EC) (3) with AIC = 12.132; ∆I = 7.673; n = 89; R2 = 0.54; F = 21.76; p < 0.001. Predictor variables that significantly explained dissolved oxygen concentration were pH, lake area (Area) and nitrate (N-NO3) (positive correlations), and water temperature (Temp) and electrical conductivity (EC) (negative correlations) (Table 3). Overall, this model explained 54% of the total variation in dissolved oxygen
Table 2. Results of a multiple regression analysis of chlorophyll-a concentration against pH, electrical conductivity (EC), total seston (TS) and nitrate (N-NO3).
Predictor variables Intercept pH log EC log TS log N-NO3
B –3.747 0.421 0.527 0.682 –0.191
t (92) –3.575 3.231 2.646 7.584 –5.805
Braz. J. Biol., 69(2, Suppl.): 491-500, 2009
p 0.00056 0.0017 0.0095


![Photosynthesis - Dissolved Oxygen - GlobiSens [PDF]](https://m.moam.info/img/260x300/photosynthesis-dissolved-oxygen-globisens-pdf_64798deb098a9ea2708b4594.jpg)