Modeling Complex Control Systems to Identify Remotely Accessible Devices Vulnerable to Cyber Attack1 Daniel Conte de Leon and Jim Alves-Foss* Center for Secure and Dependable Systems University of Idaho Moscow, ID 83844-1008
[email protected] [email protected] (contact) Ph: (530) 752-1224, FX: (530) 752-4767 Abstract
In this paper, we present a model developed for Electric Power Management Systems (EPMS) and Supervisory Control and Data Acquisition (SCADA) systems that allows us to calculate device vulnerability and help power substation operators and administrators identify and harden those portions of the control system that are most vulnerable to cyber attack. We use graph theory to model electric power control and protection devices, and their associated connectivity. We introduce the concept of a device visibility path and use a small Prolog application to calculate a device vulnerability level for a target device within a hypothetical power substation. Our model sets the basis for a prototype expert system capable of answer questions about EPMS and SCADA systems such as: “Which is the most vulnerable device of our power substation under an attack scenario?” and “Why is this device highly vulnerable?” Although our focus and examples center on electric power control systems, our work has application in all real-time complex control systems, especially those found within critical infrastructures supporting today’s modern digital societies. Keywords: Security, Vulnerabilities, Cyber Attack, Critical Infrastructure Protection, Electric Power Management, SCADA.
Axel Krings and Paul Oman Computer Science Department University of Idaho Moscow, ID 83844-1010
[email protected] [email protected]
1. Introduction Today’s electric power substations are becoming more automated and connected to monitoring and/or corporate information systems because of the economic, management, and maintenance advantages provided by increased accessibility. In [Dolezilek, 2000] the author describes how remote monitoring and data analysis of power substations can improve power system operation and maintenance. In [Leal, et al., 1998] and [Massuco, et al., 1996] the authors explain why sharing power system information among utilities is necessary to operate in our new deregulated power markets. Computer controlled systems that allow operators to regulate power flow (generation, transmission, and distribution) are referred to as Electric Power Management Systems (EPMS). Control systems for monitoring the safety, reliability, and protective functions (e.g. breaker controls) of the power grid are referred to as Supervisory Control and Data Acquisition (SCADA) systems. Grid operators, administrators, and power brokers use the EPMS, while protection and automation/integration engineers use and are responsible for the SCADA system. The industry trend for both EPMS and SCADA systems is toward increased remote accessibility, including public telecomm and even the Internet and wireless media.
1. Portions of this work were funded by grant #60NANB1D0116 from the National Institute of Standards and Technology, U.S. Dept. of Commerce
However, this convenient accessibility to remote power substations and control centers comes with the added risk of cyber attack by hackers and/or terrorists. These intrusions would have disastrous effects if control devices were maliciously reconfigured. Hence, we need to identify where electric power substation vulnerabilities reside in order to harden those weak points and protect our electric power grid against malicious intruders and attackers. In the remainder of this section we describe threats to the electric power grid and discuss the need to model complex control system security. The next section describes the graph theoretic work of [Painton et. al, 1998] that we use to model control systems, and introduces a new property of the network topology that we term device visibility. Section 3 then extends the graph-theoretic model to include new device properties such as device visibility paths and device vulnerability levels. Section 4 then shows how our model can be implemented in Prolog, with resulting queries and outputs useful in assessing access vulnerability throughout the graph representation. Section 5 discusses conclusions and future work. 1.1
Threats to the Electric Power Grid
The report by the National Security Telecommunications Advisory Committee, [NSTAC, 1997] presents an analysis and description of current threats and vulnerabilities to electric power systems, including physical and electronic intrusions, which could be exploited by terrorists. In [Oman, et al., 2000] and [Oman, et al., 2001] the authors further define the set of substation threats and vulnerabilities, and describe attack scenarios and mitigations that the electric power industry can employ to safeguard their control systems. For the most part, the threats, vulnerabilities and mitigations correspond directly to existing computer and network security issues and practices, to the extent that established techniques such as strong authentication, encryption, firewalls, and intrusion detection systems are recommended by the authors. Perhaps the greatest distinguishing feature of an electric power EPMS or SCADA system is the ability of the system operators to open and close devices that regulate power flows. We focus our work on this
environment where electric power substation devices can be remotely accessed and manipulated. 1.2
EPMS and SCADA System Configurations
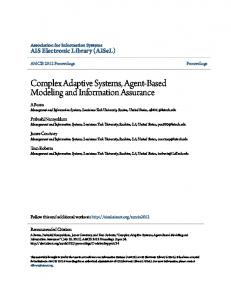
The goal of our research is to be able to answer questions such as: “Which is the most vulnerable device of our power substation under an attack scenario?” and “Why is this device highly vulnerable?” Manually analyzing all the information related to a power substation and its interconnected devices in order to answer these questions is a difficult task due to the complexity of the network and the variability of device types. To combat this complexity we adopt the graph theoretic formalism introduced by [Painton et al., 1998] and extend that work with the concepts of device visibility and device vulnerability and then evaluate the system using a simple expert system that enables us to answer queries similar the above. In the remainder of this subsection we describe the components of an EPMS or SCADA system. Figure 1 shows a hypothetical configuration for a power substation or control center. Note that several means of remote access are included here, even though all those access mechanisms would rarely be employed in a single site. Remotely accessible devices include any mechanism capable of circuit switching, analog or digital metering, calculating data values for protective functions, transmitting data to and from control power apparatus, and communications devices for remote access. Examples of remotely accessible supervisory and control devices include digital protective relays, telemetry devices, Remote Terminal Units (RTUs), Data Processing Units (DPUs), Programmable Logic Controllers (PLCs), Intelligent Electronic Devices (IEDs), and microprocessor-based substation controllers. There are several ways an intruder can gain remote access to electric power control and substation devices: They can dial-up and attempt to directly connect to RTUs or IEDs that offer dialup access; they can wiretap telecomm, LAN or WAN transmission; they can attack through the corporate Information Technology (IT) system and gain backdoor access to interconnected EPMS/SCADA systems; or they can attack through a telecomm or ISP provider. In [Hale and Bose,
2
1998], the authors describe how electric utilities are dependent upon their corporate IT systems and how interconnected SCADA systems greatly increase the vulnerability of the electric power grid. LAN / WAN
LAN SCADA User Interface
SCADA Master
Internet
Dedicated Fiber
Remote Access
Telephone Line Substation Controller
Remote Control
LAN / WAN
WAN - TCP/IP
Propietary Wiring
Local Console
WAN - TCP/IP Corporate Network
Wireless
Dedicated Line
Public Telephone Network Telephone Remote Access
Open Space Wireless
3Com
IED or RTU
3C om
3Co m
IED or RTU Propietary Control Link
IED or RTU
Remote Access
SD
Transformer
Circuit Breaker
Relay
Figure 1. Example Substation Control System. 1.3
Control Systems as Targets
The purpose of an EPMS or SCADA system is to supervise and control complex real-time systems that, during times of warfare and political or economic strife, are valuable assets viewed by opposing forces as targets. Target systems are usually components within critical infrastructures such as electric power plants, electric power transmission and distribution systems, water-, gasor oil pipelines, telecommunications systems, food processing plants, wastewater treatment plants, oil refineries, manufacturing plants, etc. Hence, we define a target system to be a control network consisting of apparatus and devices for supervision and control of complex real-time systems.
2. Modeling Control Systems In this section we describe a graph-based topological network model for a target control system. Our model is loosely based on previous work by [Painton et al., 1998]. Later, in the next section, we extend this graph-based model with logical connection information that permits us to implement a simple Prolog-based expert system in
order to represent a device visibility path and calculate device vulnerability. 2.1
Prior Work
In our work, we are less concerned with discovering attacks while they happen, after they happen, or identifying the sequence of events that comprise an attack. Rather, we are more concerned with modeling the disparate components and connectivity within a real-time control system in such a way as to permit logical queries as to the vulnerability of those systems. Evaluating prior research involving the modeling of attacks and vulnerabilities within a system, we found several disparate approaches. In [Moore et al., 2001] and [Linger and Moore, 2001] the authors use attack trees, while in [Painton et al., 1998] the authors use graphs to represent the network attack space. Other approaches by [Eckmann et al., 2000] and [Michel and Me, 2001] include the use of (more) formal description languages. Burmester, Desmedt, and Wang introduce the concept of AND/OR graphs to formally model survivable systems and their ability to overcome k-passive adversaries and k-active adversaries [Burmester, et al., 1998]. Other works by [Lee et al., 1998] and [Smith and Pedersen, 1996] provide still other mechanisms for modeling network attacks. As mentioned previously, we based our initial implementation on the work by Painton et al., and then expanded that design to allow a Prolog-based implementation to enable convenient “what-if” simulations. Our purpose in modeling the attack space was slightly different from Painton’s et al. The purpose of their model was not to model the network topology itself but to construct an attack graph based on the network topology information, an attacker profile, and an attack template. The resultant graph, models possible attacks that could be conducted against the input network given the attacker profile and the attack templates. We, however, are concerned with identifying which components of a control system are vulnerable targets of a cyber-attack. We would like to know which devices are visible from an attacker point of view, what is the connectivity enabled by that visibility, and what is the relative vulnerability of that connectivity. The notion of the visibility of a
3
device incorporates those conditions that have to be met in order for an attack to be possible against one of our devices. 2.2
A Network Topology Model
A finite graph G is an ordered pair ( V , E ) composed of a finite set of vertices V, and a binary relation E on V. Elements of E are called edges and are ordered pairs e = ( vi , vj ), where vi , vj ∈ V. To create our target topological model we map every control and auxiliary device, and every computer system to a vertex and every communication channel to an edge in a graph. If we let D be the set of devices belonging to our control system, and C the set of communication channels used to connect devices, our topology model for the target system is defined as a graph = ( D , C ), where: ∀ d ∈ D. ∃ v ∈ V, and ∀ c ∈ C. ∃ e ∈ E such that e = ( vi , vj ) denotes a connection between di with dj , where vi, vj are the respective mappings from di , dj .
SCADA User Interface
SCADA Master
Corporate Network
Local Substation Console
Internet Remote Access
Telephone Remote Access
Substation Controller
Remote IED Control
Wireless Remote Access
IED1
IED2
IED3
Transformer
Circuit Breaker
Relay
Figure 2. Example Control System Graph.
Figure 2 depicts a graph representation of our hypothetical substation control system introduced in Figure 1. Thus far our mapping is trivial, but a device d is more or less vulnerable to attacks and intrusions depending upon its properties and how it is connected to the network. Properties we are interested can be derived from questions like: Does it offer dial-in access?, Is dial-in access password protected? Does the device connect to a LAN? Does the device connect to a WAN? Is the device TCP/IP enabled? Are communications to and from the device encrypted? This additional information needs to be incorporated into the model, as do communication channel properties such as the type of communication media (copper wire, optic fiber, radio or microwaves, etc.), accessibility of cable junction boxes, transmission speed, etc. We now expand the model to incorporate connectivity and security parameters. 2.3
Defining Device Visibility
We describe a very simple model for device visibility from an attacker’s point of view. The model accommodates only the necessary information in order to identify what devices could be visible to an attacker and how well protected against electronic intrusions those devices are. Assume we have an attacker s targeting an attack object o. As described in [Oman, et al., 2002] the first attack step is to recognize the target network. After selecting a target system or device the attacker s will attempt to communicate with the attack object, or more likely, an intermediate object that provides access to the attack object. For example, assume we want to gain control of the circuit breaker depicted in the bottom-center of our hypothetical control system (Figure 1). As shown by the bold connections in Figure 3, Internet connectivity provides three different access paths to the attack object (circuit breaker) within the target system. Figure 4 shows the corresponding graph representation. Note that a vertex and edge have been added to our target topology to represent the attacker.
4
Attack Subject
cn=SCADA User Interface
Local Console
Attacker
LAN / WAN
LAN
WAN/TCPIP
cn=SCADA Master Dedicated Fiber
Internet WAN - TCP/IP
Propietary Wiring
3Com
3Com
IED1
WAN Remote Access Public Telephone NetworkTelephone
Telephone Line
Substation Controller
Remote Control Dedicated Line
Internet Access
Corporate Network
3C om
IED2
Open Wireless Space
IED3
Propietary Control Link
Wireless SD
Transformer
Remote Access
Circuit Breaker
Remote Access
Relay Attack Object
Figure 3. Example Substation Attack
SCADA Master
Corporate Network
Atacker
SCADA User Interface
Internet Remote Access
Local Substation Console
Telephone Remote Access
Substation Controller
Remote IED Control
Wireless Remote Access
IED1
Transformer
IED2
Circuit Breaker
IED3
Relay
Figure 4. Control System Attack Graph. 2.4
Device Visibility Preconditions
If a (sub)system component s can communicate with device o then we say that o is visible to s. There are several preconditions that have to be in place in order for a device o to be visible to a device s. First, device s and o have to exist.
Second, s and o have to be directly or indirectly physically connected, i.e. in graph there must exist a path between s and o. Third, s and o have to be able to communicate through that physical network. This set of conditions that have to be in place in order for a device o to be visible from a device s will be called a device visibility precondition. Device visibility precondition is a quartet: q = < s , m , l , o > representing an edge in the control system graph such that: s ∈ S , the set of all possible attack subjects, m ∈ M , the physical access media, l ∈ L , the logical access media, and o ∈ O , the set of all attack objects, where O is a subset of D, the set of all devices. We let Q be the superset of all device visibility preconditions and expand on the four definitions above, namely < s , m , l , o >. An attack subject, s, is an electronic or computerized system source of an electronic attack, which could be electronic, driven by a harmful or out of control process, or manual, and driven by a human attacker. Attack subject systems could be third party systems or our own internal substation or control systems. We assume that an initial attack subject always exists and that by definition and attack subject s is always nontrusted. We let S be the set of all possible attack subjects which, due to the automated nature of some attacks, is an infinite set. An attack object, o, is an electronic or computerized system or device target of an attack. In our example, attack objects are our substation devices. The set O of attack objects is a subset of the set of devices D modeled by vertices in our graph. Some devices such as a circuit breaker or a transformer could be an attack object but not an attack subject. Smarter devices such RTUs, PLCs, IEDs, and computer-based controllers could be both attack objects and subjects. Given the subject and object pair of a hypothetic attack, we now need to know what media and protocols the attacker could use in order to access its target. We could map our classification to match layers defined in the ISO layered model; however, for example purposes we simply divide our attack media into two sets: physical access media, M, and logical access media, L.
5
The physical access media precondition, m, to a device o could be wiretapping or listening to a communication channel c, access by connection to a public network, or direct access to the system or its components. Thus, for our simplified model we define the set M = {Direct Access to Local Console, Direct Access to Remote Console, Leased Modem Line Wiretap, LAN Wiretap, WAN Wiretap, Microwave or Wireless Eavesdropping and Intrusion, Public Telephone Network , Internet}. In this way, we model possible types of physical access media that an attacker could use to access the target system. The last precondition that has to be met is the logic media, l. The logic media represents subject and object communication languages and protocols that have to be in place for a subject to be able to talk to an object. Thus, the logic access media l is the language or communication protocol that an object is able to speak. In our simplified model we let L = { Internet Protocol, Proprietary Protocol, Local Application Interface}. Note that several device visibility preconditions could be derived from a given communication channel. A communication channel establishes the physical media for communication, and its connection points determine the communication protocols that can be used. Thus, depending on the characteristics of the communication channel plus the characteristics of the two endpoint devices, the set of all possible device visibility preconditions can be generated. Also note that the device visibility precondition q= is valid and means that a system can attack itself. We will not go further into details here because of the exponential explosion of the problem. The Malicious- and Accidental-Fault Tolerance for Internet Applications (MAFTIA) project is doing extensive research on this topic; see [Alessandri et al., 2001].
3. Enhancing Our Target Model Each communication channel allows an object and a subject to communicate in different ways using different communication protocols, ports, etc., and each of those logical communication channels affects the visibility of a device to an attacker. To accommodate the device visibility
parameters we created a new model, an extension of our previous model, constructed not with edges but with device visibility preconditions between s and o. Thus, a Device Visibility Model for our target system is defined as ( ) = ( D , Q ), where D and Q are defined as: ∀ d ∈ D. ∃ v ∈ V, and ∀ q ∈ Q. q = < s , m , l , o > as defined above for every e = ( di , dj ) within . 3.1
Device Visibility Paths
A device visibility path is a sequence of device visibility preconditions. Using this path an attacker could access object o from a subject s in order to conduct an attack by talking to a sequence of different systems that are visible from its current point of view. Formally, a device visibility path a is a finite ordered sequence of device visibility preconditions a = ( q1 , q2 ,…qi , qi+1,…qn ), such that for every device visibility precondition qi with 1 ≤ i ≤ n , the subject s of qi+1 is equal to the object o of qi . Thus, device o is visible to a device s if and only if there exists a device visibility path from s to o. We say device o is visible with respect to device s if there is at least one device visibility path a with origin in s and termination in o. 3.2
Defining Device Vulnerability
Thus far we have constructed a model capable of representing and identifying device visibility, but we cannot say anything about the vulnerability of visible devices. Note that the vulnerability level of an attack object o with respect with an attack subject s is not a static property, it is dynamic. It depends on device properties, network topology, network usage, enabled protocols, and other attributes and devices on the network. Other researchers have defined vulnerability based on continuous or probability distribution functions, and while we recognize the value of those approaches, we wanted to maintain simplicity in order to test the feasibility of our Prolog-based expert system. Hence, we define the vulnerability level of a device visibility precondition as a discrete value based on the properties of the devices and their physical and logical connections. Further, we define the vulnerability level of a visibility path as the sum of all vulnerability levels of visibility preconditions
6
forming the path. That is, the vulnerability level of a particular device is simply the result of adding the vulnerability levels of each visibility precondition encountered in the visibility path. In the example implementation described in the next section, we created a device vulnerability level matrix based on informal knowledge on the ease or difficulty of attacking a specific device given certain properties and conditions. That matrix assigns a discrete vulnerability level to each combination of device visibility preconditions and characteristics of connected devices. Given these assignments the model is processed using the shortest path algorithm to rank order vulnerabilities based on device visibility path. The longest (or most costly) path is the most vulnerable.
4. Example Prolog Implementation We used Visual Prolog [PDC, 2000] to develop a program that implements our model and uses the shortest path algorithm (actually the longest path returned by Dijkstra’s algorithm) to find the most vulnerable device within our control network. The most vulnerable device is defined to be the highest (most costly) visibility path with respect to a hypothetical attack from subject s to object o. The following Prolog code models the hypothetical control network depicted in Figures 1 and 2. The Prolog predicate definition and clauses shown in Figure 5 implement the connections and characteristics of our target model. Figure 6 shows the vulnerability level matrix implemented in Prolog, which arbitrarily assigns vulnerability levels based on our current beliefs about device vulnerability given their connection types and their authentication and encryption properties. We recognize the weakness of this assignment, but point out that other methods (e.g., continuous functions or probability distributions) can be adapted from other researchers and implemented within this same Prolog structure.
predicates nondeterm connection(device,device,physical,logical, authentication,encryption) clauses connection("SubstationController","SCADAMaster", "DedicatedFiber","SONET","None","None"). connection("SubstationController","LocalConsole", "LocalWiring","Proprietary","None","None"). connection("SubstationController","IED1", "SubstationLAN","TCPIP","None","None"). connection("SubstationController","IED2", "SubstationLAN","TCPIP","None","None"). connection("SubstationController","IED3", "SubstationLAN","TCPIP","None","None"). connection("SubstationController","Internet","WAN", "TCPIP","Password","None"). connection("IED1","Transformer","LocalWiring", "Proprietary","None","None"). connection("IED2","CircuitBreaker","LocalWiring", "Proprietary","None","None"). connection("IED3",”Relay","LocalWiring", "Proprietary","None","None"). connection("IED1","RemoteControl”,"DedicatedTelephoneLine","QAM","Password","None"). connection("IED2","Internet","WAN","TCPIP", "Password","None"). connection("IED3","PublicTelephoneNetowrk", "TelephoneLine","QAM","Password","None"). connection("IED3","OpenSpace","Wireless","WAP", "Password","None" ). connection("SCADAMaster","SCADAUserInterface", "LAN","TCPIP","Password","None"). connection("SCADAMaster","CorporateNetwork", "LAN","TCPIP","Password","None").
Figure 5. Prolog Definition of Model We then adapted two algorithms and their auxiliary predicates from an example called “route” from the Visual Prolog examples set [PDC, 2000], which calculate all routes from vertex a to b. Our modified algorithms calculate all weighted visibility paths between two devices, and identify the most vulnerable (most costly) visibility path from the Prolog implementation of our model and vulnerability matrix shown in Figures 5 and 6, respectively. The output of the Prolog program when consulted using devices named Internet as subject and CircuitBreaker as object is shown below in Figure 7.
7
predicates nondeterm vulnerabilityLevelMatrix(physical,logicl, authentication,encryption, vulnerabilityLevelValue) clauses vulnerabilityLevelMatrix("LocalWiring", "Proprietary","None","None",1). vulnerabilityLevelMatrix("DedicatedFiber", "SONET","None","None",2). vulnerabilityLevelMatrix("SubstationLAN","TCPIP", "None","None",3). vulnerabilityLevelMatrix("DedicatedTelephoneLine", "QAM","Password","None",4). vulnerabilityLevelMatrix("LAN","TCPIP","None", "None",5). vulnerabilityLevelMatrix("WAN","TCPIP", "Password","None",6). vulnerabilityLevelMatrix("LAN","TCPIP", "Password","None",7). vulnerabilityLevelMatrix("TelephoneLine","QAM", "Password","None",8). vulnerabilityLevelMatrix("Wireless”,"WAP", "Password","None",9).
Figure 6. Prolog Predicate Defining The Vulnerability Level Matrix.
Visibility paths from Internet to CircuitBreaker are: ["Internet","SubstationController","IED2", "CircuitBreaker"] with vulnerability level = 10 ["Internet","IED2","CircuitBreaker"] with vulnerability level = 7 ["Internet","CorporateNetwork","SCADAMaster", "SubstationController","IED2", "CircuitBreaker"] with vulnerability level = 23 Most vulnerable visibility path from Internet to CircuitBreaker is: ["Internet","CorporateNetwork","SCADAMaster", "SubstationController","IED2", "CircuitBreaker"] with vulnerability level = 23 yes.
Figure 7. Output of Prolog Program using Internet and CircuitBreaker as Input. Figure 7 shows the output of the Prolog application divided in two sections. The first section labeled Visibility paths form Internet to CircuitBreaker shows three different visibility paths that the search algorithm found between the device Internet and the device CircuitBreaker, and their associated vulnerability level. The advantage
of this output is that it directly names possible attack paths and the devices associated with them, helping identify those vulnerable devices or places where we need to focus our mitigation efforts. The second section labeled Most vulnerable visibility path form Internet to CircuitBreaker shows the most vulnerable visibility path for the same source and target devices.
5. Conclusions While our work is focused on power station device vulnerabilities exposed through remote access, electric power substations are just one example of complex control systems where disparate devices are connected to each other and to other information systems such as SCADA systems and corporate networks. This interconnectivity is becoming more and more popular because it offers system operators and administrators a more convenient way of managing their apparatus and infrastructure. We developed a model that represents the physical and logical properties of a substation control network and its connected devices. We defined device visibility and device vulnerability level, and calculated the most vulnerable substation device with respect to an attacker connected to our control network at a certain point. Currently the vulnerability level of a visibility path is calculated by adding the corresponding vulnerability levels assigned to each visibility precondition. This function needs to be tested and verified with real data. We need to do further research in order to find out how to assign values to our vulnerability level matrix and test our algorithm using models of real substations. We are currently working towards refining our model and conducting some experiments with real data in order to determine the usability of our model. Our goal is to create a prototype of an expert system that would help power substation operators and administrators identify the most vulnerable devices and incrementally work towards more secure substation control systems. Our graph model is a first step into developing methods and tools to improve the process of discovering vulnerabilities in a remotely accessible electric power substation system or its control system. It is an initial application of the work
8
described by [Krings, 2002]; work that describes a graph model approach to conduct survivability analysis of complex systems. The modeling and evaluation of real-time control systems, especially those involved within critical infrastructures, is of crucial importance to the survival of modern digital societies.
6. Acknowledgment We acknowledge and appreciate the financial support of the Critical Infrastructure Protection Grants Program of the National Institute of Standards and Technology, U. S. Department of Commerce for this research.
7. References [Alessandri, et al., 2001] D. Alessandri, Editor, “Towards a Taxonomy of Intrusion Detection Systems and Attacks,” Malicious- and Accidental-Fault Tolerance for Internet Applications, IBM Zurich research Laboratory, Switzerland, IBM 2001. [Burmester, et al., 1998] M. Burmester, Y. Desmedt, Y. Wang, “Using Approximation Hardness to Achieve Dependable Computation,” Lecture Notes in Computer Science 1518: Randomization and Approximation Techniques in Computer Science, M. Luby, J. Rolim, and M. Serna: Editors. Springer-Verlag, 1998. [Dolezilek, 2000] D. Dolezilek, “Understanding, Predicting, and Enhancing The Power System Through Equipment Monitoring and Analysis,” Technical Report, Schweitzer Engineering Laboratories, Pullman, WA, U.S.A., 2000. [Hale and Bose, 1998] J. Hale and A. Bose, “Information Survivability in the electric Power Industry,” CERT Coordination Center, Software Engineering Institute, Carnegie Mellon University, ISW’98 Number 19, CERT-CC 1998. [Krings, 2002] A. Krings, “A Graph Based Model for Survivability Analysis,” Technical Report, Computer Science Department, University of Idaho, 2002. [Leal, et al., 1998] D. Leal, I. Laresgoiti, D. Lambretch, and R. Bacher, “An Open System
Approach to Power Systems Information Exchange”, in Proceedings of the International Conference on Electrical Power Systems Operation and Management (EPSOM’98), Zurich, Switzerland, 23-25 September 1998. ETH Zurich, 1998. [Lee et al., 1998] W. Lee, S. Stolfo, J. Mok, and W. Kui, “A Data Mining Framework for Building Intrusion Detection Models,” in Proceedings of the 7th USENIX Security Symposium,” San Anotnio, Texas, U.S.A., 1998. [Linger and Moore, 2001] R. Linger, and A. Moore, “Foundations for Survivable System Development: Service Traces, Intrusion Traces, and Evaluation Models,” Technical Report, CMU/SEI-2001-TR-029, Survivable Systems Group, Software Engineering Institute, Carnegie Mellon University, March, 2001. [Massuco, et al., 1996] S. Massuco, R. Bacher, and A. Azarian, “ELECTRO-NET: High Voltage Electrical Network Information Exchange for Planning and Analysis”, Technical Report, European Strategic Programme of Research and Development in Information Technology (ESPIRIT), project # EP22297, Bertin $ Cie., 1996. [Moore et al., 2001] A. Moore, R. Ellison, and R. Linger, “Attack Modeling for Information Security and Survivability,” Technical Note, CMU/SEI-2001-TN-001, Survivable Systems Group, Software Engineering Institute, Carnegie Mellon University, March, 2001. [NSTAC, 1997] National Security Telecommunications Advisory Committee (NSTAC), Information Assurance Task Force, “Electric Power Risk Assessment,” March, 1997. Available at: http://www.ncs.gov/n5_hp/Reports/EPRA/elec tric.html. [Oman, et al., 2000] P. Oman, E. Schweitzer, and D. Frincke, “Concerns About Intrusions Into Remotely Accessible Substation Controllers And SCADA Systems,” Paper #1, Western Power Delivery Automation Conference, (Apr. 10-12, Spokane, WA), 2001, available through www.selinc.com.
9
[Oman, et al., 2001] P. Oman, E. Schweitzer, and J. Roberts, “Protecting the Grid from Cyber Attack, Part 1: Recognizing Our Vulnerabilities,” Utility Automation, Vol. 6(7), Nov./Dec. 2001, pp. 16-22. See also, “Protecting the Grid from Cyber Attack, Part 2: Safeguarding IEDs, Substations, and SCADA Systems,” Utility Automation, Vol. 7(1), Jan./Feb. 2002, pp. 25-32. [Oman, et al., 2002] P. Oman, A. Risley, J. Roberts, and E. Schweitzer, “Attack and Defend Tools for Remotely Accesible Control and Protection Equipment in Electric Power Systems,” Paper #15, Texas A&M Annual Conference for Protective Relay Engineers, (Apr. 9-11, College Station, TX), 2002, available through www.selinc.com. [Painton et al., 1998] L. Painton Swiler, C. Philips, and T. Gaylor, “A Graph-Based NetworkVulnerability Analysis System,” Sandia Report, SAND97-3010/1, January 1998, Sandia National Laboratories, Albuquerque, New Mexico, U.S.A., 1998. [PDC, 2000] Prolog Development Center A/S, “Visual Prolog Version 5.2 Personal Edition,” Personal Edition, Copyright 1984-2000 Prolog Development Center, Copenhagen, Denmark, www.visual-prolog.com. [Smith and Pedersen, 1996] S. Smith and P. Pedersen, “Organizing Electronic Services into Security Taxonomies,” IBM T.J. Watson Research Center and Los Alamos National Laboratory, U.S.A., 1996.
10