World Environmental and Water Resources Congress 2011: Bearing Knowledge for Sustainability © ASCE 2011
Modeling Discrete Interconnection Events of Two Water-Distribution Systems to Reconstruct Historical Human Exposure* By Jason B. Sautner,1 Walter Grayman,2 and Morris L. Maslia3 1
Environmental Health Scientist, Agency for Toxic Substances and Disease Registry, Atlanta, GA, USA, 30341; PH: (770) 488-0667; email:
[email protected] 2 Consulting Engineer, W.M. Grayman Consulting Engineer, Cincinnati, OH, USA, 45215; PH: (513) 761-1722; email:
[email protected] 3 Research Environmental Engineer, Agency for Toxic Substances and Disease Registry, Atlanta, GA, USA, 30341; PH: (770) 488-3842; email:
[email protected] ABSTRACT To determine if there are associations between drinking water contaminated with volatile organic compounds (VOCs) and selected birth defects and childhood cancers, epidemiologists need to assess drinking water contaminant levels by trimester (at a minimum) and preferably monthly in the water-distribution systems (WDSs) serving base personnel, base housing, and civilian employees at U.S. Marine Corps Base Camp Lejeune, North Carolina. An issue that complicates the estimation of historical concentrations is that one WDS with documented VOC contamination was intermittently interconnected with another WDS that was not directly contaminated at its water treatment plant (the “uncontaminated” WDS). The operational periods of interconnection are scantily documented, but estimated to have occurred between 1972 and 1983. Extended period simulations using EPANET 2 were used to reconstruct WDS characteristics during early-summer month interconnection events. Preliminary results are presented for the spatial distribution of contaminated drinking water within the “uncontaminated” WTP service area in terms of percentages of the source concentration of 100 concentration units. INTRODUCTION The Agency for Toxic Substances and Disease Registry (ATSDR) is conducting a health study of birth defects and specific childhood cancers at U.S. Marine Corps Base (USMCB) Camp Lejeune, North Carolina (Figure 1). The health study requires estimates or direct knowledge of contaminant concentrations in finished water† by trimester (at a minimum) and preferably monthly delivered to family housing within the study area. When direct knowledge of contaminant concentrations in finished
*
The findings and conclusions in this paper are those of the authors and do not necessarily represent the views of the Agency for Toxic Substances and Disease Registry or the U.S. Department of Health and Human Services. † For this study, finished drinking water is defined as groundwater that has undergone treatment at a water treatment plan and subsequently delivered to a family housing unit or other facility.
283
World Environmental and Water Resources Congress 2011: Bearing Knowledge for Sustainability © ASCE 2011
water is unavailable, historical reconstruction is used to provide estimates of contaminant concentrations. Characteristically, historical reconstruction includes the application of simulation tools, such as models, to re-create or represent past conditions (Rodenbeck and Maslia 1998; McLaren/Hart-ChemRisk 2000; Costas et al. 2001; Maslia et al. 2001; Reif et al. 2003; Kopecky et al. 2004). At USMCB Camp Lejeune, historical reconstruction methods include linking materials mass balance (mixing) and water-distribution system (WDS) models to groundwater-flow and fate and transport models (Maslia et al. 2009). For the purposes of this paper, the authors focus on the application of water-distribution system (WDS) models to the Handot Point and Holcomb Boulevard water treatment plant (WTP) service areas.
Figure 1. Study area location, U.S. Marine Corps Base Camp Lejeune.
284
World Environmental and Water Resources Congress 2011: Bearing Knowledge for Sustainability © ASCE 2011
BACKGROUND To simulate and reconstruct historical concentrations of finished drinking water in a WDS, two approaches can be used. The specific approach depends on the configuration of the source water-supply with respect to the WTP and whether or not water is transferred from one WDS to another (i.e., the interconnection of two or more water-distribution systems). Groundwater is the sole supply for drinking water at USMCB Camp Lejeune. Thus, if (1) groundwater from all supply wells is mixed at the WTP prior to treatment and distribution and (2) no interconnections exist, then materials mass balance (mixing) models can be used to quantify the concentration of finished water delivered to base housing (Figure 2A). This was the approach used by Maslia et al. (2009) to reconstruct historical concentrations for the Tarawa Terrace family housing area at USMCB Camp Lejeune. Alternatively, if water-supply wells are not all mixed at the WTP but supply water at spatially different locations within the WDS (Figure 2B) or two or more WDSs are interconnected with water transfers occurring, then more rigorous WDS modeling approaches must be used to determine the spatial distribution of contaminant concentrations within each WDS. A schematic node-link representation of two WDSs wherein a mixing-model approach and a spatially-distributed approach are used for determining drinking-water concentrations is shown in Figure 2.
Figure 2. Schematic node-link representations for water-distribution systems; (A), mixing-model approach and (B) network-model approach. The Hadnot Point WTP was likely constructed during 1941 and 1942, along with much of the original water-distribution system network, and distributed finished drinking water to bachelor and family housing throughout the entire Hadnot Point and Holcomb Boulevard areas. During the summer of 1972, the Holcomb Boulevard WTP was placed into continuous operation. From that time forward, finished drinking water from the Holcomb Boulevard WTP was delivered to the Berkeley Manor,
285
World Environmental and Water Resources Congress 2011: Bearing Knowledge for Sustainability © ASCE 2011
Midway Park, Paradise Point, and Watkins Village family housing areas (Faye et al. 2010). Although water-supply wells continued to supply raw water to each respective WTP prior to treatment and distribution, the Hadnot Point and Holcomb Boulevard WDSs could be interconnected by utilizing booster pump 742 and the Marston Pavilion valve located at Marston Pavilion and Wallace Creek (Figure 1). An issue that complicates the estimation of historical concentrations is that the Hadnot Point WDS, with documented volatile organic compound (VOC) contamination (Faye et al. 2010), was intermittently interconnected with the Holcomb Boulevard WDS that was not directly contaminated at its WTP (the “uncontaminated” WDS). The operational periods of interconnection are scantily documented, but estimated to have occurred between 1972 and 1983. During the years 1972–1983 the two WDSs are estimated to have been interconnected for a few days each month during the early-summer months of June and July. RECONSTRUCTING HISTORICAL CONCENTRATIONS The EPANET 2 WDS model (Rossman 2000) was calibrated for each WDS independently using field data and 2004 conditions (Sautner 2005, 2007). Extended period simulations were used to reconstruct WDS characteristics during the discrete interconnection events when booster pump 742 (Figure 1 and 3) was intermittently operated resulting in contaminated drinking water from the Hadnot Point WDS being transferred to the “uncontaminated” Holcomb Boulevard WDS. The configuration of the network model used to simulate the flow of Hadnot Point contaminated finished drinking water through the booster pump is described below. The network was simplified by removing the Hadnot Point section of the model and representing this part of the network as an infinite reservoir on the upstream side of booster pump 742 (compare Figure 3 with Figure 1). This allowed for shorter model runtimes and also reduced the number of “unbalanced-flow” errors occurring when running the model. To simulate the estimated percentage of Hadnot Point contaminated water at locations throughout Holcomb Boulevard, 100 units of a conservative contaminant were placed at the reservoir. MODEL INPUTS AND ASSUMPTIONS Two golf courses, Scarlet and Gold, are located in the northwest part of Holcomb Boulevard near tank S-2323. During the period 1972-1983 the golf courses were irrigated using finished drinking water directly from the Holcomb Boulevard WDS. Using finished drinking water to irrigate the courses resulted in a higher demand for drinking water during early-summer months, hence the need to operate booster pump 742 and transfer water from Hadnot Point to Holcomb Boulevard. Most golf course information (i.e. demand locations, sprinkler flows, etc.) was gathered from historical sprinkler location maps. All other information, such as how often the sprinklers were operated, was obtained from golf course and water utility workers through written and oral information (written communication, USMCB Camp
286
World Environmental and Water Resources Congress 2011: Bearing Knowledge for Sustainability © ASCE 2011
Lejeune water-utility department, July 2010). The Gold course was estimated to have been irrigated between 10 p.m. and 4 a.m. at 100 gallons per minute (gpm) and the Scarlet course was estimated to have been irrigated between 4 a.m. and 8 a. m. at 50 gpm. The combined sprinkler operation estimates result in a total 48,000 gallons of finished drinking water being used each day to irrigate the golf courses during a typical early-summer month.
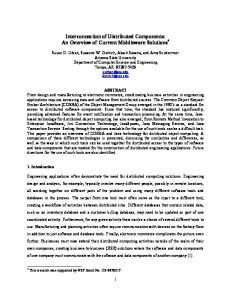
Figure 3. EPANET 2 representation of the Holcomb Boulevard waterdistribution system model. Pump curves were obtained from water utility for the four high-lift pumps located at the Holcomb Boulevard WTP (HB-670, Figure 3). Pumps 1 and 2 are identical as are Pumps 3 and 4. The pressure at Paradise Point elevated tank S-2323 controlled the high-lift pumps at the Holcomb Boulevard WTP. After discussions with USMCB Camp Lejeune water utility staff it was concluded that Pumps 3 and 4 were not used during periods when water was being transferred from Hadnot Point to Holcomb Boulevard. High-lift pumps 1 and 2 operated as follows:
287
World Environmental and Water Resources Congress 2011: Bearing Knowledge for Sustainability © ASCE 2011
• • • •
Pump 1 turned on when the pressure at S-2323 dropped to 55 pounds per square inch (psi), Pump 1 turned off when the pressure at S-2323 reached 57 psi, Pump 2 turned on when the pressure at S-2323 dropped to 54 psi, and Pump 2 turned off when the pressure at S-2323 reached 55 psi.
Little is known about booster pump 742. Water utility staff were unable to find any pump curves but did provide information on how often the pump delivered 700 gpm of water from the Hadnot Point WDS to the Holcomb Boulevard WDS. A pump curve for booster pump 742 was constructed and adjusted to deliver approximately 700 gpm when the pump was turned on. Thus, three hypothetical booster pump 742 operating scenarios for a typical early-summer month are examined in this paper: 1) Minimum water transfer: 5 hours (hrs) 45 minutes (min) for 1 day 2) Moderate water transfer: 5 hrs 45 min for 3 days 3) Maximum water transfer: 5 hrs 45 min for 7 days RESULTS Preliminary results indicate that during a month when minimum water transfer occurred (scenario 1), on a monthly average about 1.2% of the drinking water in the Berkeley Manor housing area (serviced by the “uncontaminated” Holcomb Boulevard WDS) was contaminated with water from the interconnected Hadnot Point WDS, 0.4% of the water in Midway Park was contaminated, and 0% was contaminated in the southern Paradise Point area. During a month when moderate water transfer occurred (scenario 2), on a monthly average about 4.2% of the drinking water in the Berkeley Manor housing area was contaminated with water from the interconnected Hadnot Point WDS, 1.9% of the water in Midway Park was contaminated, and 0.6% was contaminated in the southern Paradise Point area. During a month when maximum water transfers occurred (scenario 3), on a monthly average about 10.3% of the drinking water in the Berkeley Manor housing area was contaminated with water from the interconnected Hadnot Point WDS, 4.5% of the water in Midway Park was contaminated, and 0.8% was contaminated in the southern Paradise Point area. SUMMARY The results presented herein represent preliminary simulations and will be subjected to further analyses and refinement. There is uncertainty as to the exact timing and quantity of contaminated water that was transferred from the Hadnot Point WDS to the “uncontaminated” Holcomb Boulevard WDS during the period from 1972 to 1983. Three alternative scenarios for describing the transfers were defined: minimum quantity and duration of transfer (scenario 1), moderate quantity and
288
World Environmental and Water Resources Congress 2011: Bearing Knowledge for Sustainability © ASCE 2011
duration of transfer (scenario 2), and maximum quantity and duration of transfer (scenario 3). The modeling provides an indication that at most about 10% of the finished drinking water could have been contaminated in the Berkeley Manor housing area (Figures 1 and 3) under scenario 3 conditions of maximum drinking water transfers. Under scenario 1 conditions of minimum water transfers, about 4% of finished drinking water could have been contaminated in the Berkeley Manor housing area (Figure 1 and 3). Once results are finalized and uncertainty analyses conducted to establish ranges of concentrations of contaminated drinking water within the Holcomb Boulevard WDS during interconnection periods, they will be provided to epidemiologists. These results will assist the epidemiologists with conducting an exposure assessment for cases and controls, needed to complete the health study of birth defects and specific childhood cancers at U.S. Marine Corps Base Camp Lejeune, North Carolina. The ATSDR staff conducting groundwater and WDS modeling is blinded to the location and status of health study cases and controls. REFERENCES Costas, K., Knorr, R. S., and Condon, S. K. (2002). “A case-control study of childhood leukemia in Woburn, Massachusetts: The relationship between leukemia incidence and exposure to public drinking water.” The Science of the Total Environment, 300,23–35. Faye, R.E., Anderson, B. A., Suárez-Soto, R. J., and Sautner, J.B. (2010). “Analyses and historical reconstruction of groundwater flow, contaminant fate and transport, and distribution of drinking water within the service areas of the Hadnot Point and Holcomb Boulevard water treatment plants and vicinities, U.S. Marine Corps Base Camp Lejeune, North Carolina—Chapter C: occurrence of selected contaminants in groundwater at installation restoration program sites.” Atlanta, GA: Agency for Toxic Substances and Disease Registry. Kopecky, K. J., Davis, S., Hamilton, T. E., Saporito, M. S., and Onstad, L. E. (2004). “Estimation of thyroid radiation doses for the Hanford thyroid disease study: Results and implications for statistical power of the epidemiological analyses.” Health Physics, 87(1),15–32. Maslia, M. L., Sautner, J. B., Aral, M. M., Gillig, R. E., Reyes, J. J., and Williams, R. C. (2001). “Historical reconstruction of the water-distribution system serving the Dover Township area, New Jersey: January 1962–December 1996.” Atlanta, GA: Agency for Toxic Substances and Disease Registry. Maslia,l M. L., Aral, M. M., Faye, R.E., Suárez-Soto, R. J., Sautner, J. B., Wang, J., Jang, W., Bove, F. J., and Ruckart, P. Z. (2009). “Reconstructing historical exposures to volatile organic compound–contaminated drinking water at a U.S. military base.” Water Quality, Exposure and Health,1(1),49–68. McLaren/Hart-ChemRisk. (2000). “Oak Ridge dose reconstruction project summary report.” Alameda, CA: McLaren/Hart-ChemRisk. Reif, J. S., Burch, J. B, Nuckols J. R., Metzger, L., Ellington, D., and Anger, K. W. (2003). “Neurobehavioral effects of exposure to trichloroethylene through a municipal water supply. Environmental Research, 93,248–258.
289
World Environmental and Water Resources Congress 2011: Bearing Knowledge for Sustainability © ASCE 2011
Rodenbeck, S. E., and Maslia, M. L. (1998). “Groundwater modeling and GIS to determine exposure to TCE at Tucson.” Practice Periodical of Hazardous, Toxic, and Radioactive Waste Management, 2(2):53–61. Rossman, L. A. (2000). “EPANET 2 users manual.” Report, National Risk Management Research Laboratory, U.S. Environmental Protection Agency, Cincinnati, OH. Sautner, J. B., Maslia, M. L., Valenzuela, C., Grayman, W. M., Aral, M. M., and Green Jr., J. W. (2005). “Field testing of water-distribution systems at U. S. Marine Corps Base, Camp Lejeune, North Carolina, in support of an epidemiologic study.” Proceedings, EWRI World Environmental and Water Resources Congress, ASCE, May 15-19, Anchorage, AK. Sautner, J. B., Maslia, M. L., and Grayman, W. M. (2007).”Storage tank mixing models: Comparison of tracer data with model simulation.” Proceedings, EWRI World Environmental and Water Resources Congress, ASCE, May 1519, Tampa, FL.
290