Modeling factors explaining the acceptance, actual use and ...
Recommend Documents
Jun 9, 2014 - first stage: ML acceptance through the structural equation modeling statistical .... multimedia entertainment and business processing devices ...
Nov 27, 2009 - Information and Software Technology 52 (2010) 463â479. Contents lists ..... ing the TAM variables to actual usage and to BI. 2.2. Search ...
Dec 19, 2003 - The authors would like to thank Carsten Lange (California State University at Pomona) and ... List and Gallet (2001) conducted a meta-analysis.
recordâ). The EHR system allows universal access to medical data for all public healthcare providers across the country. Austria's broader HIT initiatives started ...
Abstract. Physicians' acceptance of Electronic Health. Record (EHR) systems is a critical factor for a successful implementation. In an attempt to understand.
Aug 14, 2015 - An empirical inquiry on knowledge sharing ... systems and cloud file hosting services: A study on students' acceptance. Computers in.
question is why employees do not take this opportunity to work the hours ..... 0.6. Time dependent performance. 1. 83. 1067. 0. 1. 0.7. 0.5. Work in project teams.
Email: Angel Dillip - [email protected]; Manuel W Hetzel - [email protected]; ... This is an Open Access article distributed under the terms of the Creative Commons Attribution ...... ticide-treated nets social marketing campaign [17].
The insertion of information systems in their structures figure as an element of .... management support is a key factor for the acceptance of this system in an organization. .... periodic meetings about the IS, the performance is relatively low.
Jun 25, 2015 - Bachelor of Medicine in Medical Information Science, Hunan Medical ...... acceptance of technology systems for health self-monitoring by LTR ...
Sep 19, 2009 - 2.0 technologies and services (like wikis, blogs, RSS, 3D virtual learning spaces, etc) e-learning systems will provide services that enable ...
2.0 Technologies for Learning in Higher Education: a. Case Study of ... of Web 2.0 technology tools in learning in Scotland as found ... E. Technology Acceptance Models ..... Nigerian higher institution, An MSc Thesis submitted to the School of.
Information Technology and Quantitative Management (ITQM 2014) ... an Analysis on Small and Medium Brazilian Clothing Industries ... The increasing business competitiveness leads industries to differentiate themselves ..... Ghobakhloo M, Hong TS, Sab
Jul 28, 2006 - Printed in the United States of America ... *The research reported on in this paper was supported by the Swiss National Science Foundation ...
R ('000). Total revenue and grants. 35.9%. 35.4%. 38.5%. 42.9%. 33.4%. 35.3%. 35.1%. 35.6%. 39.2%. 40.0%. 38.8%. 38.0%.
greater interest in small business ownership than did women with such a background. .... perception of lack of ï¬nancial support, perception of administrative ...
endorsement of MDS value-delivering capabilities beyond potential barriers .... of mobile data services: communication, entertainment, information, and transactions ..... a Business Object Broker Approach to EAI," eAI Journal) 2000, pp 58-62.
3. Graphs showing relation between county-based seasonal mean potential ... evapotranspiration (SSEBop ET) depths for Alabama, Arizona, and Texas, 2005 .
Sep 20, 2018 - Abstract. This study examines factors influencing the user acceptance of intranets in the restaurant industry. The study uses the application of ...
Archived at http://orgprints.org/view/projects/conference.html. 1 ... Key words: Organic farming, ethnocentrism, local origin, conversion. Abstract. We investigate ...
Background: The career satisfaction of specialists is affected by many ... associated with career satisfaction among surgeons and psychiatrists in Canada.
Hence, the land use is associated with various earth and atmosphere ..... [4] Tarbuck, EJ, Lutgens, FK, Tasa D. Earth Science, 12th ed. New Jersey, USA: ...
influences acceptance and resistance to a corporate elearning initiative provided by ... Mary Anne Bell, my 'Master's Scout' who was always willing to share her.
Modeling factors explaining the acceptance, actual use and ...
Sep 4, 2014 - a University of Montreal Hospital Center, Quebec, Canada b Faculty of ... Increasingly, information technologies (IT) are being proposed as solutions to the ..... of the participants had a college degree (n =412), 6% (n = 37) ...
i n t e r n a t i o n a l j o u r n a l o f m e d i c a l i n f o r m a t i c s 8 4 ( 2 0 1 5 ) 36–47
journal homepage: www.ijmijournal.com
Modeling factors explaining the acceptance, actual use and satisfaction of nurses using an Electronic Patient Record in acute care settings: An extension of the UTAUT Éric Maillet a,∗ , Luc Mathieu b , Claude Sicotte c a b c
University of Montreal Hospital Center, Quebec, Canada Faculty of Medicine and Health Sciences, University of Sherbrooke, Sherbrooke, Quebec, Canada Health Administration Department, School of Public Health, University of Montreal, Quebec, Canada
a r t i c l e
i n f o
a b s t r a c t
Article history:
Background and purpose: End-user acceptance and satisfaction are considered critical factors
Received in revised form
for successful implementation of an Electronic Patient Record (EPR). The aim of this study
4 September 2014
was to explain the acceptance and actual use of an EPR and nurses’ satisfaction by testing
Accepted 15 September 2014
a theoretical model adapted from the Unified Theory of Acceptance and Use of Technology (UTAUT).
Keywords:
Methods: A multicenter cross-sectional study was conducted in the medical–surgical wards
Acceptance
of four hospitals ranked at different EPR adoption stages. A randomized stratified sampling
Nurses
approach was used to recruit 616 nurses. Structural equation modeling techniques were
Information technology
applied.
Structural equation modeling
Results: Support was found for 13 of the model’s 20 research hypotheses. The strongest effects
Satisfaction
are those between performance expectancy and actual use of the EPR (r = 0.55, p = 0.006),
Compatibility
facilitating conditions and effort expectancy (r = 0.45, p = 0.009), compatibility and perfor-
i n t e r n a t i o n a l j o u r n a l o f m e d i c a l i n f o r m a t i c s 8 4 ( 2 0 1 5 ) 36–47
1.
Introduction
1.1. Implementing information technology in healthcare Increasingly, information technologies (IT) are being proposed as solutions to the challenges faced in health care systems, for addressing population health issues and encouraging the emergence of new modes of healthcare delivery [1]. Even though the benefits of implementing IT in healthcare have been well documented, too much variance remains in the rates of satisfaction expressed by health professionals [2]. The professional culture of nurses is generally favorable to adoption of innovations such as an Electronic Patient Record (EPR) [3], but affective response remains a critical factor that influences the decisions and behaviors of IT users [4]. The fundamental differences between the paper-based patient record and the EPR as well as significant transformations of clinical practices raise significant questions about IT’s impact on the nursing workflow, care delivery and nurses’ satisfaction [5]. In principle, an EPR should facilitate access to relevant information, patient evaluation, health promotion, clinical interventions and the organization of services [6]. These functionalities play a key role for nurses, since they make a unique contribution to the health system [7] by integrating information [8] and serving as pivots in the health team [9]. Furthermore, the adoption of an EPR is a complex change that occurs slowly, in a series of stages. Widespread adoption appears to be a prerequisite to achieving the overall benefits for a health system [10]. However, the EPR adoption stage varies from one facility to another, which limits interoperability. It is therefore important to identify and make use of explanatory factors to facilitate this important transition.
1.2.
Aims of the study
The aim of this study was to investigate explanatory factors for nurses’ acceptance and actual use of an EPR in acute care settings as well as for their satisfaction. More specifically, the research objectives examined: (1) nurses’ perceptions of the compatibility of the EPR and their self-efficacy regarding acceptance of the EPR, (2) the actual use of the EPR, and (3) their satisfaction.
2.
Theoretical foundations
2.1.
Acceptance models and theories
Over the last few decades, many models and theories have been developed and tested in order to identify variables affecting the acceptance and use of IT provided to end-users. Among them, the Technology Acceptance Model (TAM) [11] stimulated one of the most active streams of research to predict intention to use an IT and explain actual use of IT [12]. Based on the Theory of Reasoned Action (TRA) [13], TAM examined the impact of external factors on the cognitive response of individuals (reactions based on values, beliefs, knowledge, etc.), on their affective response (the emotions and feelings generated), on their intention to change a behavior and, lastly,
37
on their behavioral response, i.e. their actual use of the system. In 2003, the Unified Theory of Acceptance and Use of Technology (UTAUT) [14] synthesized 32 constructs from eight well-known models and theories to study the acceptance of IT. UTAUT advanced several constructs as influencing intention to use and actual use of IT: performance expectancy (PE), effort expectancy (EE), social influence (SI) and facilitating conditions (FC). These constructs focus on users’ perceptions of the usefulness of the system in increasing their productivity, of the ease with which they can learn to use the system, of the role played by significant persons in the work environment to influence the end-user’s behaviors and, lastly, on the measures taken to support change. These constructs are considered equivalent to the perceived usefulness, perceived ease of use, subjective norm and perceived behavioral control constructs, respectively [15]. However, some links frequently tested in TAM [11] and TAM2 [16] to measure acceptance and use of a system have not been modeled in UTAUT. This is true of the fundamental links between effort expectancy and performance expectancy and between social influence and performance expectancy. Often these links have proved to be significant when measured among the various types of health professionals affected when an IT is adopted [15].
2.2.
Selection of the dependent variables
In this stream of research, most studies have measured the behavioral intention to use the system before the system is deployed, considering this variable as a proxy for actual use. An EPR is used by all health professionals for collective health care delivery. Its use is therefore not voluntary. In this sense, there may be limits to measuring the intention to use a system implemented for mandatory use. Only four studies have measured actual use of a system in healthcare settings [17–20], and often this has been measured in terms of frequency, intensity of use and the scope of the functionalities used in the system [14]. Yet for clinicians using an EPR, such a measure more accurately reflects patients’ need for care and professionals’ workflows, rather than acceptance of the system. This study seeks to fill this gap by analyzing the nature of such use to support users’ activities and sense making of the information. To this end, we employed a multidimensional construct of actual use of a system [21] that focuses on three IT functions: (1) decision support (problem solving and decision rationalization), (2) work integration (horizontal and vertical) and (3) customer service. Until this time, this construct and the self-reported instrument that was developed to measure the nature of the actual use have received very limited attention in the literature. A suggestion has also been made to replace actual system use by a measure of user satisfaction [22]. To this end, nurses’ satisfaction has been measured with respect to the PE and EE constructs [23], but instrumentally rather than affectively. In the TAM, the attitude toward the system construct has often been left out and is not found in UTAUT. Yet many studies have examined the attitudes of health professionals during adoption of an IT [15]. All the studies that measured the relationship between performance expectancy and attitude toward the system found a positive link [18,24–31] and only one, which examined a sample of physicians, found a non-significant link
38
i n t e r n a t i o n a l j o u r n a l o f m e d i c a l i n f o r m a t i c s 8 4 ( 2 0 1 5 ) 36–47
with the effort expectancy variable [29]. However, when predicting a behavior, attitude precedes behavioral intention and actual use of the system [13]. When the EPR has already been implemented, it would appear more appropriate to measure user satisfaction after their experience with actual use of the EPR. In this respect, the Expectation-Confirmation Model [32] offers an affective conceptualization of user satisfaction that is similar to how attitude toward the system has been measured, but which has not yet been applied with TAM or UTAUT.
2.3.
Antecedent factors
Many studies conducted in healthcare have examined the compatibility of the EPR with the professionals’ clinical practices. All the tests performed with regard to the performance expectancy construct produced significant results [28,31,33–35]. This construct was positively associated with effort expectancy three times out of four [28,34,35] and with behavioral intention to use the EPR four times out of five [28,33,34,36]. These results demonstrate the value in investigating the compatibility of the EPR with care practices, which is considered one of the most important factors in clinicians’ acceptance and use of an EPR [33,34]. In UTAUT, only one item in the facilitating conditions construct addressed the compatibility of the system. Considering the challenges related to integrating an IT, investigators have instead proposed a multidimensional construct of the compatibility of the system with preferred work style, existing work practices, prior experiences and users’ values [37]. Another important dimension is the computer self-efficacy construct, which was removed from the final version of UTAUT because of a full mediation effect exercised by the effort expectancy construct. To date, all the studies conducted in healthcare settings have found that self-efficacy has a significant influence on effort expectancy [24,26,28,34,35]. However, we did not find a single study that measured a link between the self-efficacy construct and the satisfaction of clinicians using IT. By widening our literature review, we found a study on the implementation of an e-learning application that revealed a non-significant relationship [38]. By considering the attitude toward the system construct as an affective response comparable to satisfaction, a non-significant link was also found by applying UTAUT [24]. However, another study suggests that the self-efficacy construct is one of the strongest predictors of job satisfaction [39]. The results on this subject therefore appear to be mixed.
2.4.
Additional theoretical considerations
According to theory of reasoned action (TRA) assumptions, measurement of a given behavior must be situated with respect to an action, a target and a context and within a specific time-frame [13]. In order to better specify the implementation of an EPR over time – a complex change that evolves through a series of adoption stages – we used the Electronic Medical Record Adoption Model (EMRAM) [40] in order to specify the adoption stages in the EPR deployment within our study settings.
2.5.
Research model
All the UTAUT constructs were used to develop the theoretical model except for behavioral intention to use the system, since the nurses in our study were already using the EPR. To measure the behavioral response, we have proposed a multidimensional self-reported measure of actual use of the EPR [21]. To ensure that the model is supported in all the components of TRA [13], nurses’ satisfaction was modeled as a second dependent variable, effectively re-introducing an affective measure. This model also reflects recommendations to measure user satisfaction in environments where actual use of the EPR is mandatory [41]. Also, two antecedent factors were added to the model: (1) computer self-efficacy [42] and (2) a multidimensional construct of the compatibility of the EPR [37] with preferred work style, existing clinical practices, prior experiences and nurses’ values. Fig. 1 illustrates the theoretical model used in this study, and Table 1 presents the 20 research hypotheses along with their empirical support. The effects of the independent variables were modeled on two dependent variables: AU (actual use of the EPR) and Sat (satisfaction).
3.
Methods
3.1.
Design and settings
The research design was based on a multicenter crosssectional study. Four acute-care academic settings were selected for the study: two university-affiliated hospitals and two teaching hospitals, all located in Montreal, Canada. All the study sites were implementing an EPR developed by the same vendor (OacisTM , Telus). The sites were at various EPR adoption stages ranging from 1 to 4. These adoption stages were assessed using the Electronic Medical Record Adoption Model – EMRAM [40]. One university-affiliated hospital was ranked at the first adoption stage (setting 1) and the other one was ranked at the second adoption stage (setting 2). One teaching hospital was ranked at a stage 3 (setting 3) and the other had reached the fourth adoption stage (setting 4). According to EMRAM, a stage 1 hospital is one that has all major ancillary systems (laboratory, radiology and pharmacy) installed and operational. At the second adoption stage, the ancillary systems feed data to a clinical data repository that can be accessed in the EPR. The third adoption stage is characterized by electronic nursing and clinical documentation (flow sheets, vital signs, nursing notes, etc.) that is integrated into the clinical data repository. The main characteristic of the forth adoption stage concerns computerized practitioner order entry (CPOE). The study targeted a population of nurses working in 55 medical and surgical wards.
3.2.
Instrument development
Data was collected using a closed questionnaire printed on paper. It contained 53 questions on: compatibility of the EPR (8 items), self-efficacy (4 items), PE (4 items), EE (4 items), SI (4 items), FC (3 items), AU (14 items), and nurses’ satisfaction (4 items) as well as eight questions on the nurses’
i n t e r n a t i o n a l j o u r n a l o f m e d i c a l i n f o r m a t i c s 8 4 ( 2 0 1 5 ) 36–47
39
Fig. 1 – Hypothesized research model adapted from the UTAUT [14].
socio-demographic characteristics (age, gender, job level, etc.). The questionnaire took 5–10 min to complete. The items measuring compatibility of the EPR and UTAUT constructs used seven-point Likert scales (strongly disagree to strongly agree), a ten-point scale for self-efficacy (not at all confident to totally confident) and a five-point scale on actual use of the EPR (not at all to a great deal). The wording of the items used in prior studies was adapted to nursing practice. Some items were replaced or removed for reasons related to face validity, content validity and construct validity. For instance, for a nurse working in a public hospital, using an EPR does not increase the chances of obtaining a raise [14]. Also, an item of the Facilitating Conditions construct was removed because it was intended to measure the compatibility of the system, which this study measured with a separate instrument. There were two versions of the questionnaire (one in English and one in French) to account for language spoken at work. The French version was translated using the back-translation method [58]. This involves having the questionnaire translated first into French by one translator and then translated back into English by another translator. The items in the two final versions of the questionnaire were identical. The questionnaire was then pretested on 13 nurses speaking both languages who were not included in the study population. Based on the comments received, some items were removed because they were considered too redundant to measure compatibility of the EPR and actual use of the EPR. More specifically, seven of the 15 items in the original instrument measuring the compatibility of the EPR were removed. Similarly, 16 of the 30 items in the instrument measuring the actual use of the EPR were removed. This decision was made to avoid annoying respondents and to reduce overall questionnaire completion time.
3.3. Sampling method, data collection and data analysis A random stratified sampling method was applied, based on the nurses’ work shifts, as strata criteria to ensure that the
sample would be representative of nurses in terms of age and experience. The list of nurses provided by the human resources or nursing departments were cleaned before sampling by removing nurses on long-term leave (sick leave, maternity leave, study leave, etc.). For instance, in a teaching hospital, we used a random numbers table to sample 140 nurses (42%) on the day shift, 100 nurses (30%) on the evening shift and 60 nurses (18%) on the night shift. A total of 875 survey questionnaires were personally handed out to the selected nurses from October 2012 to March 2013. A reminder was sent one month following the first contact. Approvals for the study were obtained from the research ethics committee of each setting. The data was analyzed using the IBM Statistical Package for the Social Sciences (SPSS, Chicago, IL), Version 20, and Structural Equation Modeling (SEM) analysis was performed using AMOS, Version 19.
4.
Results
4.1.
Demographic characteristics of the sample
A total of 656 questionnaires (75.0%) were returned. The data were inspected to correct outliers caused by data entry errors. Mean substitution of missing data was performed by creating composite scores [59] based on the average of 75% of the remaining items for each construct. It nevertheless proved impossible to replace some of the values missing from forty questionnaires, so they were removed from the sample. SEM analyses are sensitive to missing data when estimating parameters using the maximum likelihood estimation method [60]. Ultimately, 616 questionnaires were eligible for analysis: 60/115 respondents in Setting 1, 94/160 in Setting 2, 250/300 in Setting 3 and 212/300 in Setting 4. The sample comprised 524 women (85.1%) and 92 men (14.1%). The average age of the nurses was 38.4 years (standard deviation (SD) = 11.53) and they had 11.8 years of experience on average (SD = 11.15). With respect to level of nursing education, 67% of the participants had a college degree (n = 412), 6% (n = 37)
40
i n t e r n a t i o n a l j o u r n a l o f m e d i c a l i n f o r m a t i c s 8 4 ( 2 0 1 5 ) 36–47
Table 1 – Research hypotheses, relationships and supporting literature. Research hypotheses
Relationship
H1: Actual use of the EPR will have a significant positive effect on the satisfaction of nurses. H2: Performance expectancy will have a significant positive effect on actual use of the EPR. H3: Performance expectancy will have a significant positive effect on nurses’ satisfaction. H4: Effort expectancy will have a significant positive effect on actual use of the EPR. H5: Effort expectancy will have a significant positive effect on nurses’ satisfaction. H6: Social influence will have a significant positive effect on actual use of the EPR. H7: Social influence will have a significant positive effect on nurses’ satisfaction. H8: Facilitating conditions will have a significant positive effect on actual use of the EPR. H9: Facilitating conditions will have a significant positive effect on nurses’ satisfaction. H10: Effort expectancy will have a significant positive effect on the performance expectancies of nurses. H11: Social influence will have a significant positive effect on the effort expectancies of nurses. H12: Social influence will have a significant positive effect on the performance expectancies of nurses. H13: Facilitating conditions will have a significant positive effect on the effort expectancies of nurses. H14: Facilitating conditions will have a significant positive effect on the performance expectancies of nurses. H15: The compatibility of the EPR will have a significant positive effect on the performance expectancies of nurses. H16: The compatibility of the EPR will have a significant positive effect on the effort expectancies of nurses. H17: Computer self-efficacy will have a significant positive effect on the effort expectancies of nurses. H18: The compatibility of the EPR will have a significant positive effect on actual use of the system. H19: The compatibility of the EPR will have a significant positive effect on nurses’ satisfaction. H20: Computer self-efficacy will have a significant positive effect on nurses’ satisfaction. a b
c
AU → Sat
Supporting literature
PE → AUa
[43,44] Information Systems Success Model [45,46] [15,17,18,20,24–26,35,47–54]
PE → Satb
[18,24–31,54]
EE → AUa
[15,17,20,24,26,35,48–54]
EE → Satb
[18,24–27,54]
SI → AUa
[19,20,24,50,51,54–56]
SI → Satb
[18,54]
FC → AUa
[19,20,24,29,31,50,55–57]
FC → Sat
c
EE → PE
[15,20,24–27,48,49,51–53]
SI → EE
[52]
SI → PE
[24,25,52,53]
FC → EE
[24,25,27,28,35,51]
FC → PE
[24,28,35,51,56]
Comp → PE
[28,30,33–35]
Comp → EE
[28,34,35]
SE → EE
[24,26,28,35,51]
Comp → AUa
[28,33,34,36]
Comp → Sat
c
SE → Sat
[39]
Since very few studies have measured actual use of an EPR, we have accounted for links measured on behavioral intention to use the system. Since the attitude toward the system construct is an affective response comparable to the user satisfaction construct (predictive vs. explanatory perspective), we considered these relationships as equivalent. Links were modeled taking into account theoretical considerations that suggest replacing the measure of actual use with user satisfaction in settings where system use is mandatory.
had an undergraduate degree, and 25.9% (n = 159) had a bachelor’s degree in nursing science. Only seven nurses (1.1%) had a degree at the post-graduate level. The respondents worked in four practice settings at a different EPR adoption stage. For example, the ancillary systems were operational in Setting 1, in Setting 2 clinical data can be accessed and viewed from a data repository, nurses in Setting 3 could document patient data directly on flow sheets in the EPR (allergies, vital signs, skin integrity scale, etc.), and Setting 4 was the only practice setting with a computerized provider order entry (CPOE) for radiology tests. Statistical analyses were performed to determine whether or not the four groups were comparable. No differences were found in terms of male–female ratios and experience levels. However, the results revealed a statistically significant difference in age and level
of nursing education (Setting 3 vs. Setting 4). Non-parametric analyses were performed based on Kruskal–Wallis tests with independent samples and Chi-squared tests, since discrepancies were found when verifying normality assumptions for the analyses of variance. Furthermore, t-tests revealed the presence of differences between the average ages of nurses in the sample and their respective populations (Settings 1 and 4). However, based on the sampling method used and the similarity of the nurses’ work environments, we consider that these differences did not affect the SEM analyses.
4.2.
Psychometric properties of the measures
To measure construct validity, principal component analysis (PCA) was performed on the items of each construct in the
41
i n t e r n a t i o n a l j o u r n a l o f m e d i c a l i n f o r m a t i c s 8 4 ( 2 0 1 5 ) 36–47
Table 2 – Reliability, operational definitions and descriptive statistics for each construct. Variable
Cronbach’s ˛
Performance expectation
0.90
Effort expectancy
0.92
Social influence
0.77
Facilitating conditions
0.76
Compatibility of the EPR
0.82
Self-efficacy
0.73
Actual use of the EPR
0.93
Nurses’ satisfaction
0.91
Operational definition
Mean
SD
Min.
Max
Nurses’ perception that using the EPR will enhance their productivity, enable them to accomplish tasks more quickly, and improve quality of care. Nurses’ perception that it is easy to learn, become skillful, and use the EPR. Nurses’ perception of the degree to which important other persons in the work environment approve (or do not approve) of acceptance and use of the EPR. Nurses’ perception of the factors in the hospital that impede or facilitate the acceptance and use of the EPR. Nurses’ assessment of the congruence between the EPR and their preferred work style, existing practices, and values. Nurses’ perception of their degree of comfort using the EPR on their own or with help provided in their workplace. Nurses’ evaluation of the use of the EPR to support decision making (problem solving and decision rationalization) and work integration (communication and coordination) and to give information on nursing care to patients. Nurses’ affective response (feelings and emotions) as a result of acceptance and use of the EPR.
20.87
4.77
4
28
22.00
4.11
5
28
20.99
2.01
9
28
11.13
2.01
3
14
32.03
6.42
10
42
30.02
6.35
10
40
37.22
12.70
14
70
20.04
4.10
4
28
theoretical model, since the sample size was highly satisfactory [61]. All the coefficients were found to be above a threshold of 0.3 following inspection of the correlation matrices [62]. To verify whether the data could be used in a factorial analysis, Kaiser–Meyer–Olkin (KMO) tests and Bartlett’s sphericity test were performed. The results confirm that the PE, EE, SI, FC, SE and Sat variables are unidimensional. Since compatibility of the EPR and actual use of the EPR are multidimensional constructs, we performed a Varimax rotation. Two components were detected for the actual use of the EPR construct. For the compatibility of the EPR construct, reducing dimensions led to the extraction of one of the three components affecting reliability (compatibility with prior experiences). This reduced the number of items for this construct to six. The internal consistency of the scales used to measure the constructs of the theoretical model was verified using the Cronbach’s alpha (˛) method. Following these analyses, removing one item from the facilitating conditions construct led to a slight increase in the scale reliability score (˛ = 0.74 increased to ˛ = 0.76). Concerning the sub-dimension of compatibility of the EPR with prior experience, removing the two items increased the Cronbach’s alpha from 0.72 to 0.82. All the reliability scores exceeded the 0.70 acceptability threshold [63,64] and several were over 0.90. The scales’ reliability results are reported in Table 2, which also provides operational definitions and results of descriptive statistics for each of the model’s constructs. The average values for each construct suggest that nurses had a rather positive perception for most of the model’s constructs. However, for the actual use of the EPR construct, the score of 37.2 (out of a maximum of 70) suggests that the EPR is only moderately used to support nursing practice.
4.3.
Data-model fit assessment
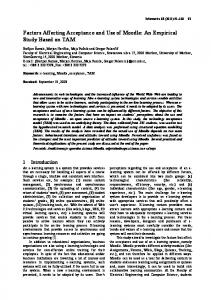
Two iterations were required following the results of the chi-squared test and the fit and modification indices. Fig. 2 illustrates the most plausible theoretical model. Several types of fit measures (absolute, parsimonious and incremental indices) were considered to assess data-model fit [60,65]. The results suggest an excellent fit between the model and the data from the sample, as shown in Table 3. The final model rejected 5 of the 20 research hypotheses (H4, H7, H8, H11 and H14). Setting aside the Comp → UR (H18) and SE → Sat (H20) links, which lost their significance during the standardization process, the non-standardized regression weights for all the other links had a significance level below p < 0.001 (not shown). This model has four dependent variables (AU, Sat, PE and EE), two of which (PE and EE) are mediating variables. The compatibility of the EPR (H15), effort expectancy (H10) and social influence (H12) variables explain 50.2% of the variance in the performance expectancy variable. Also, three constructs explain 52.9% of the variance in effort expectancy: compatibility of the EPR (H16), facilitating conditions (H13) and self-efficacy (H17). Only two constructs explain 33.6% of the variance in the actual use of the EPR variable: performance expectancy (H2) and social influence (H6). Concerning nurses’ satisfaction, with the exception of social influence (H7) and self-efficacy (H20), all the model’s direct links are statistically significant and explain 54.9% of the nurses’ affective responses associated with their acceptance and use of the EPR. Subsequently, Table 4 presents the direct, indirect and total effects (standardized regression weights) between the model’s various constructs. The strongest links are PE → AU (H2: r = 0.550, p = 0.006), FC → EE (H13: r = 0.453, p = 0.009) and
42
i n t e r n a t i o n a l j o u r n a l o f m e d i c a l i n f o r m a t i c s 8 4 ( 2 0 1 5 ) 36–47
H18 ns R2 0.50
H15 0.39 **
H2 0.55**
Performance Expectancy (PE)
Compatibility of the EPR (Comp) H16 0.28**
H10 0.26 * R2 0.53
Effort Expectancy (EE)
H17 0.19 **
Self-efficacy (SE)
H12 0.25 *
H11 ns
H3 0.27* H4 ns
Actual use of the EPR (AU)
H5 0.16 **
H6 0.14 *
H1 0.16 **
H7 ns
R2 0.54
Social Influence (SI)
H14 ns
R2 0.34
H13 0.45 **
Satisfaction of nurses (Sat)
H8 ns
Facilitating Conditions (FC)
H9 0.15 *
H20 ns H19 0.18 * --- Rejected hypothesis
* p < 0.05
** p < 0.001
ns: not-significant
Fig. 2 – Model explaining the actual use of an EPR and nurses’ satisfaction (direct effects).
Table 3 – Model fit indices and target values in structural equation modeling.