Modeling flexible two-dimensional warranty contracts for used products considering reliability improvement actions
Chun Su 1, 2 and Xiaolin Wang1 1
School of Mechanical Engineering, Southeast University, Nanjing, China 2
Jiangsu Wind Power Engineering Technology Center, Nanjing, China
Abstract. In this article, a new pre-sale reliability improvement model is proposed for repairable used products sold with a two-dimensional free repair warranty policy. By using bivariate failure modeling framework, this model can describe the effect of reliability improvement action on the past age and past usage of a used product separately. Under the twodimensional free repair warranty policy, product failures within the warranty coverage are rectified minimally by the dealer at no cost to new buyers. The optimal reliability improvement policy is determined to minimize the total expected servicing cost per unit sale from the dealer’s perspective. Moreover, a four-step approach is developed to design flexible warranty contracts with optimized reliability improvement policies for used products. Numerical example and sensitivity analysis are provided to demonstrate the effectiveness of the proposed model and approach.
Keywords. Used products, two-dimensional warranty, bivariate failure modeling, reliability improvement, flexible warranty
Corresponding author: Chun Su, Department of Industrial Engineering, School of Mechanical Engineering, Southeast University, Jiangning District, Nanjing 211189, China. Email:
[email protected]
1
Introduction Due to the rapid technology evolution and fierce competition, product reliability and warranty contract are becoming increasingly important for product marketing. The primary propose of a warranty is to offer post-sale remedy for the customer when a product fails to fulfill its intended function within the warranty period. 1 In fact, warranty has been used by many manufacturers/dealers as a means of advertising the quality and reliability of a product, and thereby boosting the sales and revenue. Nowadays, warranty has become an integral part of manufacturers’ and/or dealers’ marketing strategies, and many types of warranty policies are offered to promote their products. In today's market, new products are appearing with a faster pace, meanwhile product’s expected life is extended due to technological advance. 2 For particular customers, they may like to purchase used/second-hand products because of low purchasing power, consciousness of sustainability, personal preference or some other reasons. Therefore, the markets for used products have grown rapidly in recent years, especially for home appliances, automobiles, industrial equipment and so on. For instance, the volume of used car sales in China increased by 8.6% to 5.2 million units in 2013, while the turnover grew 10.6% to RMB 291 billion. 3 As another example, in UK, after continued steady growth, total car sales in 2013 returned to the pre-recession level of 9.7 million, among which approximately 7.4 million were used cars, comparably only 2.3 million were new cars.4 For the customers of used products, apart from the price and performance, quality and reliability are also important factors they will concern. Although the market for used products has developed steadily, quality and reliability remain two negative factors especially when lack of sufficient information on the past history of usage and maintenance. 5 Faced with this situation, warranty can signify the quality and reliability of used products, and offer assurance and protection to customers against product failures within the warranty period. If dealers can provide customers with better warranty services, concerns about the quality and reliability of used products can be significantly, if not entirely, addressed. In this sense, dealers of used products need to develop appealing warranty contracts and strategically use them as promotional tools. However, providing warranty for used items incurs additional cost to dealers 2
resulting from the service of warranty claims. Therefore, from the perspective of dealers, it is of vital importance to analyze the expected warranty cost and compare different warranty options. Research on warranty policies for new items has received much attention, however, study on warranty policies for used/second-hand items is still in the early stage. Chattopadhyay and Murthy2 discussed some aspects about free repair/replacement and pro-rata warranty (PRW) policies for second-hand products. In Chattopadhyay and Murthy6 , three kinds of cost sharing warranty policies are proposed and analyzed for second-hand products. Chukova et al. 7 summarized stochastic models for estimating expected warranty cost from the dealer’s viewpoint, in which used items were sold with various warranty policies. Chari et al. 8 developed a mathematical model for the optimal unlimited free replacement warranty policy with replacements carried out with reconditioned products. Aksezer 9 carried out failure analysis of used vehicles, and the expected warranty cost was derived by considering the age, usage and maintenance history. Used products often incur higher warranty servicing cost for the dealer, since they usually have more breakdowns compared with new ones. One way to reduce warranty cost is through reliability improvement actions, such as overhaul, upgrade and remanufacturing, which can slow down product degradation and reduce risk of product failures. Chattopadhyay and Murthy10 developed two models to assess reliability improvement strategies for used items sold with FRW policy. Lo and Yu11 proposed a mathematical model to optimize the upgrade policy and warranty length for used products so as to maximize the dealer’s expected profits. In addition, Yazdian et al. 12 jointly optimized the pricing of returned used products, degree of their remanufacturing, selling price and warranty period for remanufactured products. In order to maximize the dealer’s profit, Su and Wang13 investigated the optimal upgrade level and preventive maintenance policy for used products under free repair warranty (FRW) policy. Recently, Kim et al.14 formulated a periodic inspection/upgrade model for second-hand products under warranty, and derived the optimal strategy to minimize the dealer’s total expected cost. For more research on this topic, interested readers can refer to Shafiee and Chukova15 and the references therein. The above-mentioned articles10-15 focus on the optimization of reliability improvement 3
actions for used products sold with one-dimensional (1D) warranty policies. However, many products, such as automobiles and printers, deteriorate with both age and cumulative usage, hence two-dimensional (2D) warranty policies are more suitable for such products.16,
17
Generally, a 2D warranty policy is characterized by a region in the 2D plane with one dimension denoting age and the other one representing usage. In recent years, 2D warranty policies for new products have gained an increasing amount of attention from various perspectives. 16-19 However, to the best of our knowledge, there are only three published articles on 2D warranty policies for used products. Chattopadhyay and Yun20 developed a mathematical model to estimate warranty cost and determine the best decision on price and warranty terms for second-hand products. Shafiee et al. 5 developed statistical models to estimate the dealer’s expected warranty cost for second-hand products sold with 2D FRW policy, and a case study of used refrigerators was also illustrated. Besides, in Sarada and Mubashirunnissa 21 , two stochastic models were proposed to calculate the expected warranty cost for second-hand products under 2D free repair/replacement warranty and PRW policies. Up to now, little research can be found on modeling and analyzing reliability improvement strategies for used products sold with 2D warranty policies, and this study intends to fulfill this gap. From the dealer’s point of view, it is worthwhile to perform a reliability improvement action only when the reduction of warranty servicing cost exceeds the additional cost incurred by the improvement action. Moreover, in practice, designing flexible 2D warranty contracts for used products is also of great interest for both dealers and customers. In this article, a 2D FRW policy is proposed for used products with consideration of a pre-sale reliability improvement program. Under the 2D FRW, failures within the warranty coverage will be minimally rectified by the dealer. The presented model is also applied to determine flexible warranty contracts for used products, which can offer various warranty options to customers with different usage rate without incurring any additional cost. The contributions of this work lie in: (1) to our knowledge, it is an early article on modeling and optimizing reliability improvement actions for used products sold with 2D warranty policies; (2) the effect of a reliability improvement action on the past age and usage of the used product, namely, age reduction and usage reduction, are modeled separately; (3) 4
flexible 2D warranty contracts with optimized reliability improvement policies are determined for used products. The reminder of this article proceeds as follows. Section ‘‘Model formulation’’ presents the elements of the mathematical model, including models for product failures, reliability improvement actions and expected warranty cost, respectively. The subsequent section focuses on determining flexible 2D warranty contracts for used products. Section ‘‘Numerical example’’ presents numerical example and sensitivity analysis to illustrate the proposed models. Conclusions and future research directions are stated in the last section.
Model formulation General assumptions The following assumptions are required in model formulation. (1) The product is repairable and deteriorates due to both age and usage, which means that if there is no maintenance intervention on the product, the failure rate would increase as age and usage increase. (2) Product failures are statistically independent. Once a failure occurs, it can be detected immediately, which results in an immediate valid claim. (3) The past age A and past usage B of a used product are known. (4) All the repairs throughout product past life up to age A and usage B are assumed to be minimal. Minimal repair can restore the failed product to operational state, but its failure rate remains unchanged. (5) Prior to its re-sale, the used product is subjected to a reliability improvement action performed by the dealer. The effect of reliability improvement is to upgrade the used item to a state with younger age and usage. (6) The 2D FRW policy starts at the time when a new buyer purchases the used product. Under this policy, the dealer will minimally rectify all failures within the warranty period at no cost to the buyer. (7) The reliability improvement action and all minimal repairs are instantaneous.
5
Modeling product failures Approaches to modeling failures under 2D warranty In the literature, three main approaches have been developed to model failures for products sold with 2D warranty policies, i.e., bivariate, composite scale and marginal approaches.22, 23 We introduce them briefly as follows. (i) Bivariate approach. In this approach, the time to first failure is modeled by a bivariate distribution function F(t, x). If the warranty servicing strategy is replacement with a new one, then we get a 2D renewal process;24 while modeling minimal repair instead of replacement by using the bivariate approach is not fully developed. 25-27 (ii) Composite scale approach. Gertsbakh and Kordonsky28 proposes an approach that integrates the two scales (age T and usage X) to create a single composite scale and product failures are then modeled as a counting process using this composite scale. For example, in Gertsbakh and Kordonsky28 , a new variable Z = εT + (1−ε)X is introduced, where ε∈(0, 1). (iii) Marginal (univariate) approach. This method assumes that the usage rate R varies from customer to customer, but it is constant for a specific customer. R=X/T is assumed to be a random variable that can be modeled using a distribution function G(r), 0 ≤ r < ∞. Given R = r, the failure process can be described by a counting process with a conditional intensity function that is dependent on age and usage. For the marginal method, some articles assume that the intensity function is a polynomial function of age and total usage, see Yun and Kang18 , Chukova et al.19 and Huang et al.29 , for example; while several others utilize the accelerated failure time model to describe the effect of usage rate on the time to first failure, see Jack et al.22 , Ye et al.30 and Shahanaghi et al.31 , for example. In addition to the above three methods, there are several more articles that have also made contributions to this area. Samatlı-Paç and Taner32 introduced the multiple quasi-renewal process and applied it to model n-dimensional warranties, with 2D warranty as a special case. Wu23 applied the asymmetric copulas to effectively capture the tail dependence that exists between the pair of age and usage.
Bivariate failure modeling with minimal repair Among the above three approaches, marginal approach is widely adopted in the research 6
on 2D warranties. However, its main drawback is treating usage as a function of age, and considering that age and usage are stochastically proportional.17, 25 In practice, the assumption of functional relationship between age and usage may be violated, and the effects of age and usage on product deterioration may be different. Hence, utilizing the bivariate approach, which considers age and usage simultaneously, seems more reasonable to investigate 2D warranties. This study adopts such an approach. In this article, we look at a repairable product as a black-box system, which deteriorates due to both age and cumulative usage. Suppose that all failures under warranty are rectified minimally, and the repair time is negligible, thus the failed product is restored to its condition immediately before failure, so its age and usage are unaltered. Here, (T, X) is assumed to be a non-negative bivariate random variable with distribution function F t , x PT t , X x , f t , x 2 F t , x tx , survival function F t , x PT t , X x , and
density function
hazard function r t , x f t , x F t , x . The framework of 2D failure modeling with minimal repair, which is proposed by Baik et al.25, 26 , is adopted in this study. Let N(s, t; w, x) denote the number of product failures within [s, t)×[w, x), 0 ≤ s < t, 0 ≤ w < x, and N(0, t; 0, x) is abbreviated to N(t, x). The probability of n failures in the rectangle [0, t)×[0, x) is pn t , x P N t , x n . Baik et al.26 derive a recursive definition for p n (t, x), as follows. F t , x F t ' , x F t , x ' F t ,'x ' ' p t , x 1 0 0 n 1 F t ' , x'
pn t , x
x
t
r '
t , x dt dx '
'
'
'
(1)
with p 0 (t, x) = 1−F(t, x). Then, the expected number of failures over [0, t)×[0, x) can be obtained by
E N t , x npn t , x
(2)
n 0
In this study, we consider that product age (T) and usage (X) follow a bivariate Weibull distribution with scale parameters α1 and α2 , shape parameters β1 and β2 , respectively, and the two variables are correlated with dependency parameter δ, then the joint survivor function and hazard function of (T, X) can be given by25, 33
7
1 2 t x F t , x exp 2 1
(3)
and 1
t r t, x 1 2 1 2 1
1
2
x 2
1
1 2 t x 1 2
1 2 x t 1 1 2 1
2
(4)
where α1 , α2 , β1 , β2 > 0, and 0 < δ ≤ 1. Note that, in equations (3) and (4), δ is the parameter used to describe the dependency relationship between age and usage. Smaller value of δ represents stronger dependency. On the basis of real automobile warranty data, Gupta et al. 34 empirically observes that the correlation coefficient between age and mileage is normally over 0.7, which corresponds to a small value of δ. To reduce the complexity of further investigation with the 2D warranty problem, we consider a special case with δ = 1 in this study, in which the age and usage are assumed to be independent. It is quite easy to approach cases with δ < 1, however, the model complexity will increase accordingly.
Modeling reliability improvement action Suppose that a used item with past age A and past usage B is subjected to an instantaneous reliability improvement action prior to its re-sale. We model the reliability improvement action by using the black-box approach and ignoring its detailed procedures. The effect of reliability improvement is that it results in a rejuvenation of the used item so that it can effectively reduce the used item’s past age and past usage. By using the bivariate failure modeling framework, the age reduction and usage reduction can be modeled separately. Motivated by Kim et al. 35 and Huang et al. 17 , we assume that the degree of reliability improvement depends on its effort m, 0 ≤ m ≤ M, and its relationship with the age [usage] is characterized by the age- [usage-] reduction factor ω(m) [τ(m)]. Note that, m = 0 corresponds to no improvement effort and M is the upper limit of the effort. Larger value of m represents greater improvement effort. 8
With reliability improvement at age A, the item’s virtual age just after improvement is expressed as ω(m)A, 0 ≤ ω(m) ≤ 1. In other words, the reliability improvement level is A−ω(m)A = (1−ω(m))A. The well-known concept of virtual age was firstly proposed by Kijima 36 . Note that, ω(m) is a decreasing function of m with ω(0) = 1 and ω(M) = 0. This implies that as the improvement effort increases, the used item’s virtual age just after improvement decreases accordingly. Besides, m = 0 means no improvement for the used item; m = M implies that the used item’s age is reset back to zero. Hence, after reliability improvement with effort m, the virtual age at time t is given by
v1 t m A t , t 0
(5)
Similarly, the past usage will also be reduced due to the improvement action, and after reliability improvement with effort m, the virtual usage at x is represented by
v2 x m B x, x 0
(6)
where τ(m)B is the virtual usage just after improvement. As can be seen, the restoration condition after reliability improvement is revealed with a specific m and its corresponding reduction factors—ω(m) and τ(m). Both ω(m) and τ(m) are decreasing functions
of
m.
Here,
it is
m 1 m e m
assumed that
and
m 1 1.2m e1.2m . In this study, suppose that the cost of a reliability improvement action depends on the item’s past age, past usage and the improvement effort. Thus this cost can be modeled as C p m Cs Im0 Cv A1 B2 1 m 1 m ,0 m M k1
k2
(7)
where Cs is the fixed cost borne by the dealer when m > 0, and Cv, φ1 , φ2 , k 1 and k 2 are positive real parameters. These parameters can be estimated from historical data. Note that, model (7) is a 2D extension of the cost model introduced by Chattopadhyay and Murthy10 . It implies that the reliability improvement cost increases with the increase of A, B, and/or m.
2D warranty policy for used products There are different regions that can be used to define 2D warranty policies, including rectangular, L-shaped, triangular regions and so on.24 In this article, the rectangular region is 9
considered due to its popularity in automobile markets, as well as its simplicity in comprehension by the customers. In order to specify the warranty region, W and U are used to denote the age limit and usage limit
respectively.
This
policy
is
characterized
by
the
rectangular
region:
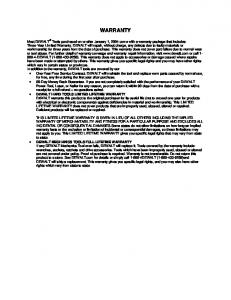
W ,U t , x : t 0,W and x 0,U , as shown in Figure 1. In which, A and B represent
the past age and past usage, respectively, of the used item.
Figure 1. Rectangular 2D warranty region for used items.
Under this policy, the dealer agrees to repair all failures free of charge up to age limit W or up to usage limit U from the time of the new sale, whichever occurs first. In other words, the customer is guaranteed a maximum coverage for W units of time and for U units of usage after sale. For a customer with high usage rate (r > η = U/W), the warranty will expire before the age limit W due to the cumulative usage exceeding its limit U. While for a customer with low usage rate (r < η), the warranty would terminate at W with the total usage at expiry below U. Therefore, for customers with either high or low usage rates, the policy tends to favor the dealer, as opposed to the customers.24
Modeling expected warranty cost In this section, we derive the dealer’s expected warranty cost for used items under 2D 10
FRW policies. Suppose that a used item with past age A and usage B is bought by the dealer from its first user. Then it is upgraded to a younger state by the dealer through an instantaneous reliability improvement action, such as overhaul or upgrade action, with an improvement effort m. Subsequently, the dealer sells the used item to a new buyer with a 2D FRW policy. Under the FRW policy, when a failure occurs within the warranty period, a minimal repair is offered by the dealer with no fee to the new buyer. Besides, the repair time is assumed to be negligible. Usually, for a specific customer, the age and usage limits of the 2D warranty cannot be reached at the same time, since a high-usage-rate customer will reach the usage limit first, while a low-usage-rate customer will reach the age limit first. However, the formulation of expected number of failures in equation (2) fails to preserve the distribution of product usage rates that changes from customer to customer, which is a serious drawback. 27 To deal with this problem, this study incorporates the concept of usage rate as described above. With the help of usage rate, we can easily describe the warranty expiry time and usage for all types of customers. Under the 2D warranty policy, as discussed previously, we need to consider two possible cases: r < η and r ≥ η, where η = U/W. In the case of r < η, we know that the warranty will expire at time W, and the corresponding usage is r∙W. Thus, conditioning on R = r, the conditional expected number of failures under warranty is given by
E N w m,W ,U
r
E N m A W , m B rW E N m A, m B rW
(8)
E N m A W , m B +E N m A, m B where E[N(t, x)] is given by equation (2).
Likewise, in the case of r ≥ η, the warranty ceases at time U/r when the total usage exceeds its limit U. Hence, conditioning on R = r, the conditional expected number of failures under warranty is given by E N w m,W ,U
r
E N m A U r , m B U E N m A, m B U E N m A U r , m B E N m A, m B 11
(9)
Removing the conditioning on R, the total expected number of failures over the warranty period can be calculated by
E N w m,W ,U E N w W ,U , m 0
E N w W ,U , m
r
g r dr
r g r dr
(10)
where g(r) is the density function of customer usage rates, and g(r) can be estimated using the data obtained from customers’ warranty records or the dealer’s market surveys. Suppose that each failure during the warranty period incurs an average minimal repair cost Cr , then the expected warranty servicing cost per unit sale under the warranty region are given by E Cw m,W ,U =Cr E N w m,W ,U
(11)
where E[Nw(m,W,U)] is given by equation (10).
Total expected servicing cost The dealer’s total expected servicing cost for a used product includes investment in the reliability improvement program and expected warranty cost. Therefore, it can be calculated by C m,W ,U =C p m E Cw m,W ,U
(12)
where Cp (m) is given by equation (7) and E[Cw(m, W, U)] by (11). A higher reliability improvement effort leads to a higher improvement cost, but it can lower the warranty servicing cost. This is worthwhile only when the reduction of warranty servicing cost exceeds the additional cost incurred by the improvement action. Therefore, the optimal reliability improvement policy can be obtained by achieving a balance between the reliability improvement cost and the warranty servicing cost.
Determining flexible warranty contracts In practice, customers are usually offered only one warranty contract with fixed region regardless of their usage rates. This is typical in automobile market today. However, it is known that there is a trend of customization in recent years: customized products and services are growing in popularity among customers, and product warranties are no exception. Offering 12
flexible warranty contracts allows manufacturers/dealers to capture this trend. Flexible warranty policies are ‘flexible’ in the sense that every customer can select one policy among available options that best satisfies his or her needs and/or pattern of product use. 31 In line with this, Manna et al.37 proposes a methodology to determine flexible warranty regions for rectangular and L-shaped warranty policies. In this study, we focus on deriving flexible warranty contracts for used products when the total expected servicing cost is specified. Note that there are infinitely many iso-cost regions for the rectangular warranty policy. 37 Let us denote by C0 the specified total expected servicing cost per unit sold, then for 2D rectangular warranty region, we have C p m E Cw m,W ,U C0 , 0 m M
(13)
For specified A and B, the following four-step approach can be used to obtain the iso-cost curves: Step 1. Set certain discrete values of η within (0, ∞), namely, η1 , η2 ,…, ηn , in an ascending order. For the sake of simplicity, the increment ∆η is fixed in this study, i.e., η2 −η1 = η3 −η2 = … = ∆η. Step 2. For any given ηi , i = 1, 2, …, n, obtain Wim (the corresponding values of W) for m = 0, 1, 2, …, M, by solving Cp (m) + E[Cw(m, Wim , ηi Wim )] = C0 . Step 3. Set Wi = max Wim , i = 1, 2, …, n, and this gives a single point (Wi , Ui = ηi Wi ) on the 0 m M
iso-cost curve. Step 4. By connecting all the points (Wi , Ui = ηi Wi ) for i = 1, 2, …, n, we can get the curve.
For a specified total expected servicing cost C0 , all possible combinations of warranty age limit and usage limit with optimized reliability improvement policies can be obtained by the proposed four-step approach. As expected, plotting these iso-cost curves helps the dealer to offer a variety of contracts with the same servicing cost. Note that, it’s difficult to obtain analytical solution to equation (13). Fortunately, some simple numerical search methods, such as binary search and golden section search, are quite efficient to find the solution. In the next section, the proposed approach will be applied to a numerical example. 13
Numerical example 2D warranty policies are intensively applied in automobile industries. In this section, we apply the proposed model to used automobiles. An automobile can be considered as a complex repairable system, which consists of many repairable and non-repairable components. In the literature, uniform distribution is frequently considered as the candidate of usage rate distribution G(r), see Yun and Kang18 , Chukova et al.19 , Huang et al.29 , Ye et al.30 , for example. This study also utilizes uniform distribution to describe the variability of customers’ usage rates, i.e., g(r) = 1/[ru −rl ], rl ≤ r ≤ ru . Moreover, in this study, the time is measured in units of years and the usage in 104 km, and the unit for cost is US dollar ($). The nominal parameter settings used in this study are summarized in Table 1.
Table 1. Parameter settings in the numerical example. Parameter Value
α1 α2 β1 β2 δ A B W U 3
4
2
2
1 2 4
2
Cs
C1
φ1
φ2
k1 k2
rl
ru
4 100 500 0.55 0.4 1.5 1.2 0.5 3.0
In consideration of the difficulty to derive analytical form for the expected number of failures, i.e., equation (2), computational methods need to be used. In this study, a Matlab code is written to perform numerical calculation.
Optimal reliability improvement policies With the parameter values given in Table 1, Table 2 shows the total expected servicing costs to the dealer as Cr varies from 20 to 500 in increments of 20 with five discrete levels of reliability improvement effort (m). Table 2. Dealer’s total expected servicing cost under various cr . cr
m=0
m=1
m=2
m=3
m=4
m=5
20 40 60
51.41 102.82 154.23
179.06 211.12 243.19
490.40 505.97 521.54
886.32 895.15 903.99
1146.96 1153.27 1159.58
1278.49 1283.84 1289.18
80 100
205.64 257.05
275.25 307.31
537.11 552.69
912.83 921.67
1165.89 1172.21
1294.52 1299.86
14
120 140 160
308.47 359.88 411.29
339.37 371.44 403.50
568.26 583.83 599.40
930.50 939.34 948.18
1178.52 1184.83 1191.14
1305.20 1310.54 1315.88
180 200
462.70 514.11
435.56 467.62
614.98 630.55
957.02 965.85
1197.46 1203.77
1321.22 1326.56
220 240
565.52 616.93
499.68 531.75
646.12 661.69
974.69 983.53
1210.08 1216.39
1331.90 1337.24
260
668.34
563.81
677.26
992.37
1222.71
1342.59
280 300
719.75 771.16
595.87 627.93
692.84 708.41
1001.20 1010.04
1229.02 1235.33
1347.93 1353.27
320 340
822.58 873.99
660.00 692.06
723.98 739.55
1018.88 1027.72
1241.64 1247.96
1358.61 1363.95
360 380
925.40 976.81
724.12 756.18
755.12 770.70
1036.56 1045.39
1254.27 1260.58
1369.29 1374.63
400
1028.22
788.24
786.27
1054.23
1266.89
1379.97
420 440
1079.63 1131.04
820.31 852.37
801.84 817.41
1063.07 1071.91
1273.20 1279.52
1385.31 1390.65
460 480
1182.45 1233.86
884.43 916.49
832.99 848.56
1080.74 1089.58
1285.83 1292.14
1395.99 1401.33
500
1285.27
948.56
864.13
1098.42
1298.45
1406.68
In Table 2, the minimal total expected cost corresponding to the optimal reliability improvement effort is marked in bold. The result indicates that both the optimal reliability improvement effort and total expected cost increase as the repair cost Cr increases. The optimal improvement effort starts at level 0 (20 ≤ Cr ≤ 140) and reaches level 2 (400 ≤ Cr ≤ 500) eventually. The reason is that when the repair cost increases, the dealer should enhance the reliability improvement effort in order to reduce the likelihood of failure occurrence within the warranty period, and the warranty cost is thus reduced. Considering that the past age and past usage of used items may have influence on reliability improvement policies and total servicing costs, Table 3 shows the optimal improvement levels (m* ) and corresponding total costs (TC* ) under various combinations of past age A and past usage B, with the values of other parameters remaining unchanged.
Table 3. Effect of past age and past usage on the optimal policies. cr 20
A = 1, B = 2 A = 2, B = 2 A = 2, B = 4 *
*
*
*
*
*
A = 3, B = 4 *
A = 3, B = 6 *
*
A = 4, B = 6
m
TC
m
TC
m
TC
m
TC
m
TC
m*
TC*
0
21.84
0
33.27
0
51.41
0
69.06
0
93.41
0
117.28
15
*
40 60 80
0 0 0
43.68 65.52 87.36
0 0 0
66.55 99.82 133.10
0 0 0
102.82 154.23 205.64
0 0 0
138.12 207.18 276.24
0 0 0
186.83 280.24 373.66
0 0 1
234.56 351.84 451.99
100 120
0 0
109.20 131.04
0 0
166.37 199.64
0 0
257.05 308.47
0 1
345.30 410.51
1 1
443.25 498.09
1 1
519.75 587.52
140 160
0 0
152.88 174.73
0 0
232.92 266.19
0 1
359.88 403.50
1 1
452.48 494.44
1 1
552.92 607.76
1 1
655.28 723.04
180
0
196.57
0
299.47
1
435.56
1
536.40
1
662.59
1
790.81
200 220
0 0
218.41 240.25
0 0
332.74 366.01
1 1
467.62 499.68
1 1
578.36 620.32
1 1
717.42 772.26
1 1
858.57 926.34
240 260
0 0
262.09 283.93
0 1
399.29 424.49
1 1
531.75 563.81
1 1
662.29 704.25
1 1
827.09 881.93
1 1
994.10 1061.87
280 300
0 0
305.77 327.61
1 1
446.72 468.94
1 1
595.87 627.93
1 1
746.21 788.17
1 1
936.76 991.59
1 2
1129.63 1162.34
320
0
349.45
1
491.16
1
660.00
1
830.13
2
1024.43
2
1190.13
340 360
0 0
371.29 393.13
1 1
513.38 535.60
1 1
692.06 724.12
1 1
872.10 914.06
2 2
1047.77 1071.11
2 2
1217.93 1245.72
380 400
0 1
414.97 431.37
1 1
557.82 580.04
1 2
756.18 786.27
2 2
934.16 953.41
2 2
1094.45 1117.79
2 2
1273.52 1301.31
420 440 460 480
1 1 1 1
446.72 462.08 477.43 492.78
1 1 1 1
602.26 624.48 646.71 668.93
2 2 2 2
801.84 817.41 832.99 848.56
2 2 2 2
972.66 991.91 1011.15 1030.40
2 2 2 2
1141.14 1164.48 1187.82 1211.16
2 2 2 2
1329.11 1356.90 1384.70 1412.50
500
1
508.13
2
690.46
2
864.13
2
1049.65
2
1234.50
2
1440.29
As can be seen, under a fixed repair cost, the optimal reliability improvement effort and the corresponding total servicing cost tend to increase as the past age and/or past usage increases. This is due to the fact that larger past age and/or past usage results in higher warranty servicing cost, thus the dealer should increase reliability improvement effort in order to reduce the warranty cost. In addition, for a specific combination of A and B, the optimal reliability improvement level tends to increase as the minimal repair cost increases. Age limit and usage limit are two key factors for 2D warranty policies, which may significantly affect the total servicing costs and reliability improvement policies. The optimal improvement levels (m* ) and the total costs (TC* ) under various combinations of age limit and usage limit are summarized in Table 4, with the values of other parameters keeping unchanged.
Table 4. Effect of warranty limits on the optimal policies. cr
W = 1, U = 2 W = 2, U = 2 W = 2, U = 4 16
W = 3, U = 4
W = 3, U = 6
W = 4, U = 6
m*
TC*
m*
TC*
m*
TC*
m*
TC*
m*
TC*
m*
TC*
20 40
0 0
9.24 18.48
0 0
17.51 35.01
0 0
51.41 102.82
0 0
81.63 163.25
0 0
153.47 306.95
0 0
221.34 442.67
60 80 100 120
0 0 0 0
27.72 36.96 46.20 55.44
0 0 0 0
52.52 70.02 87.53 105.04
0 0 0 0
154.23 205.64 257.05 308.47
0 0 1 1
244.88 326.50 408.08 460.29
1 1 1 1
454.53 557.03 659.54 762.05
1 1 1 2
599.31 750.08 900.85 996.42
140
0
64.68
0
122.54
0
359.88
1
512.51
1
864.56
2
1083.35
160 180 200
0 0 0
73.93 83.17 92.41
0 0 0
140.05 157.56 175.06
1 1 1
403.50 435.56 467.62
1 1 1
564.72 616.94 669.16
2 2 2
930.75 987.74 1044.73
2 2 2
1170.28 1257.21 1344.15
220
0
101.65
0
192.57
1
499.68
1
721.37
2
1101.72
2
1431.08
240 260
0 0
110.89 120.13
0 0
210.07 227.58
1 1
531.75 563.81
1 2
773.59 821.95
2 2
1158.71 1215.70
2 2
1518.01 1604.94
280 300
0 0
129.37 138.61
0 0
245.09 262.59
1 1
595.87 627.93
2 2
848.65 875.35
2 2
1272.69 1329.68
2 3
1691.87 1755.30
320
0
147.85
0
280.10
1
660.00
2
902.06
2
1386.67
3
1813.82
340
0
157.09
0
297.61
1
692.06
2
928.76
2
1443.66
3
1872.34
360
0
166.33
0
315.11
1
724.12
2
955.46
2
1500.65
3
1930.86
380 400
0 0
175.57 184.81
0 0
332.62 350.12
1 2
756.18 786.27
2 2
982.16 1008.86
2 2
1557.64 1614.63
3 3
1989.38 2047.90
420 440
0 0
194.05 203.30
1 1
361.90 372.13
2 2
801.84 817.41
2 2
1035.57 1062.27
3 3
1655.83 1692.90
3 3
2106.42 2164.94
460
0
212.54
1
382.37
2
832.99
2
1088.97
3
1729.96
4
2223.23
480 500
0 0
221.78 231.02
1 1
392.60 402.83
2 2
848.56 864.13
2 2
1115.67 1142.37
3 3
1767.02 1804.09
4 4
2270.29 2317.36
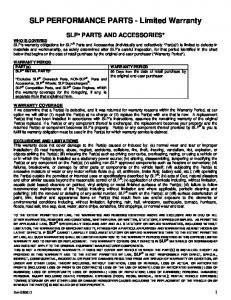
As shown in Table 4, under a given repair cost, the optimal reliability improvement effort and the corresponding total servicing cost tend to increase as the age limit and/or usage limit increases. This result can be explained by the fact that longer warranty period will lead to higher warranty servicing cost, thus the dealer should enhance reliability improvement effort to reduce the warranty cost. Furthermore, the reliability improvement strategy depends largely on the cost structure of the improvement program. As mentioned earlier, the reliability improvement action is worthwhile only when the reduction of warranty cost exceeds the additional cost incurred by the improvement action. Next, we investigate the effect of Cv on the optimal improvement strategy and the corresponding total cost. We consider two other values of Cv (250 & 750), and keep the other parameters unchanged. The results are shown in Table 5 and Figure 2. Note that, 17
symbol ‘●’ represents m* = 0, ‘+’ represents m* = 1 and ‘▲’ represents m* = 2.
Table 5. Effect of Cv on the optimal policy. Cv ($)
Cr ($) Cr ≤ 120
Optimal policy m* = 0
250
140 ≤ Cr ≤ 180
m* = 1
500
Cr ≥ 200 Cr ≤ 140 160 ≤ Cr ≤ 380
m* = 2 m* = 0 m* = 1
Cr ≥ 400
m* = 2
Cr ≤ 160 Cr ≥ 180
m* = 0 m* = 1
750
Figure 2. Effect of Cv on the optimal strategy and the corresponding total cost.
As can be observed, the results under different Cv have similar tendency. The values of Cr where the optimal strategy switches from level 0 to level 1, and from level 1 to level 2 increase as Cv increases. In other words, under a fixed repair cost, the optimal improvement level tends to decrease as Cv increases. The result is reasonable in practice, since when Cv increases, the dealer would lower the improvement level so as to avoid high reliability improvement cost. From the sensitivity analysis above, it can be found that the decision on optimal reliability improvement policy depends on various factors related, including used products’ past age and past usage, warranty limits, cost structures of minimal repair and reliability improvement action, 18
etc.
Flexible 2D warranty policies In the marketing of used products, customers may request for warranty contracts with various age and usage limits, which are best suitable for their individual needs. By using the aforementioned four-step approach, here we will illustrate how the dealer design flexible and optimized 2D warranty contracts for used products. We fix the average minimal repair cost as Cr = 250, and values of other parameters follows directly from Table 1, except that W and U are to be determined here. Figure 3 illustrates isocost curves for C0 = 1200 under different reliability improvement effort m.
Figure 3. Iso-cost curves for C0 = 1200 under different m.
From Figure 3, the iso-cost curve corresponding to m = 2 is the optimal one, since its corresponding age limit and usage limit are always the largest for any given η. In other words, for the specified total cost C0 = 1200, performing the reliability improvement action with effort m = 2 would allow the dealer to offer the best warranty contracts to customers with any usage rates. Using the presented approach, the iso-cost curves (contours) for the presented numerical example are depicted in Figure 4. 19
Figure 4. Iso-cost curves of the warranty contracts for used products.
It can be observed that, in the upper left corner and lower right corner of Figure 4, the isocurves become vertical and horizontal lines, respectively. This is due to the assumption of uniform distribution of usage rates. The detailed explanations are as follows. (1) The upper left corner corresponds to large η (=U/W). When η is larger than ru , customers’ warranty would terminate at age limit W. In this case, further increase of η will not affect the outcome of W, that is to say, W keeps constant and U increases as η increases. This leads to a vertical line. (2) The lower right corner corresponds to small η. When η is smaller than rl , customers’ warranty would cease due to U being reached. In this case, U keeps constant and W increases as η decreases. This leads to a horizontal line. As shown in Figure 4, for any given total servicing cost C0 , all combinations of W and U that lie on the corresponding contour can be presented as possible warranty contracts. Following this approach, the dealer is able to offer wide range of 2D warranty contracts and derive their corresponding optimal reliability improvement strategies.
Conclusions For customers, flexible warranty contracts for used products can satisfy their individual 20
needs and preferences. From the view of dealers, they concern more about reliability improvement strategy as well as their warranty servicing cost. In this article, for used products sold with 2D warranty, a mathematical model is developed to derive the optimal reliability improvement strategy so as to minimize the dealer’s total servicing cost. The effect of reliability improvement on product age and usage is considered separately through the bivariate failure modeling framework. In addition, a four-step approach is proposed to derive the iso-cost curves for any specified total servicing cost. Numerical example and sensitivity analysis are provided to demonstrate the proposed model and approach. The developed models can be useful for dealers of used products such as automobiles, home appliances and industrial equipment, etc. We believe that the proposed models are helpful for the dealers to provide flexible and customer-oriented warranty contracts. This in turn, may help customers to receive higher quality of warranty service with lower price. There are several possible directions for further research. Our study focuses on the rectangular warranty region, while other types of warranty regions, e.g., L-shaped and triangular, are yet to be studied. Moreover, jointly considering pre-sale reliability improvement action and post-sale preventive maintenance actions for used products under 2D warranties is also an open problem. Furthermore, in this study the past age and usage of used products are assumed to be known, however, considering random past age and usage is more practical. Last but not the least, conducting a case study taken from reality to facilitate the assessment on the use of the proposed approach is another valuable direction for future research.
Acknowledgement The authors would like to thank the two anonymous referees for their valuable comments and suggestions, which significantly improved the quality and presentation of this article.
Declaration of conflicting interests The authors declare that there is no conflict of interest.
Funding 21
This work is supported by the Fundamental Research Funds for the Central Universities and the Graduate Training Innovative Projects Foundation of Jiangsu Province (No. SJLX_0049), the Open Fund of Jiangsu Wind Power Engineering Technology Center (No. ZK15-03-01) and the Jiangsu Provincial Six Talent Peaks Project (No. 2013ZBZZ-046).
References 1. Murthy DNP, Djamaludin I. New product warranty: A literature review. Int J Prod Econ 2002; 79: 231-260. 2. Chattopadhyay G, Murthy DNP. Warranty cost analysis for second-hand products. Math Comput Model 2000; 31: 81-88. 3. China Automotive Distribution Industry and Automotive Aftermarket Report 2014-2017. http://www.reportsnreports.com/reports/278756-china-automotive-distribution-industry-andautomotive-aftermarket-report-2014-2017.html (2014, accessed 5 Feb 2015). 4. BCA. The used car market report 2014. http://www.buckingham.ac.uk/wpcontent/uploads/2014/11/pnc-2014-usedcar.pdf (2014, accessed 5 Feb 2015). 5. Shafiee M, Chukova S, Saidi-Mehrabad M, Niaki STA. Two-dimensional warranty cost analysis for second-hand products. Comm Stat Theor Meth 2011; 40: 684-701. 6. Chattopadhyay G, Murthy DNP. Cost sharing warranty policies for second-hand products. Int T Oper Res 2001; 8: 47-60. 7. Chukova S, Shafiee M. One-dimensional warranty cost analysis for second-hand items: An overview. Int J Qual Reliab Manag 2013; 30: 239-255. 8. Chari N, Diallo C, Venkatadri U. Optimal unlimited free-replacement warranty strategy using reconditioned products. Int J Perform Eng 2013; 9: 191-200. 9.
Aksezer CS. Failure analysis and warranty modeling of used cars. Eng Fail Anal 2011; 18:
1520-1526. 10. Chattopadhyay G, Murthy DNP. Optimal reliability improvement for used items sold with warranty. Int J Reliab Appl 2004; 5: 47-58. 11. Lo H-C, Yu R-Y. A study of quality management strategy for reused products. Reliab Eng Syst Safe 2013; 119: 172-177. 12. Yazdian SA, Shahanaghi K, Makui A. Joint optimisation of price, warranty and recovery planning in remanufacturing of used products under linear and non-linear demand, return and cost functions. Int J Syst Sci 2014: 47: 1155-1175. 13. Su C, Wang X. Optimizing upgrade level and preventive maintenance policy for second-hand products sold with warranty. Proc IMechE Part O: Journal of Risk and Reliability 2014; 228: 518528. 14. Kim D-K, Lim J-H, Park DH. Optimal maintenance level for second-hand product with periodic inspection schedule. Appl Stoch Model Bus 2015; 31: 349-359. 15. Shafiee M, Chukova S. Optimal upgrade strategy, warranty polic y and sale price for secondhand products. Appl Stoch Model Bus 2013; 29: 157-169. 16. Su C, Shen J. Analysis of extended warranty policies with different repair options. Eng Fail Anal 2012; 25: 49-62. 22
17. Huang Y-S, Gau W-Y, Ho J-W. Cost analysis of two-dimensional warranty for products with periodic preventive maintenance. Reliab Eng Syst Safe 2015; 134: 51-58. 18. Yun WY, Kang KM. Imperfect repair policies under two-dimensional warranty. Proc IMechE Part O: Journal of Risk and Reliability 2007; 221: 239-247. 19. Chukova S, Hayakawa Y, Johnston MR. Optimal two-dimensional warranty repair strategy. Proc IMechE Part O: Journal of Risk and Reliability 2007; 221: 265-273. 20. Chattopadhyay G, Yun WY. Modeling and analysis of warranty cost for 2D-policies associated with sale of second-hand products. Int J Reliab Appl 2006; 7: 71-77. 21. Sarada Y, Mubashirunnissa M. Warranty cost analysis for second-hand products using bivariate approach. Int J Oper Res 2011; 12: 34-55. 22. Jack N, Iskandar BP, Murthy DNP. A repair–replace strategy based on usage rate for items sold with a two-dimensional warranty. Reliab Eng Syst Safe 2009; 94: 611-617. 23. Wu S. Construction of asymmetric copulas and its application in two-dimensional reliability modelling. Eur J Oper Res 2014; 238: 476-485. 24. Murthy DNP, Iskandar BP, Wilson RJ. Two-dimensional failure-free warranty policies: Twodimensional point process models. Oper Res 1995; 43: 356-366. 25. Baik J, Murthy DNP, Jack N. Two-dimensional failure modeling with minimal repair. Nav Res Logist 2004; 51: 345-362. 26. Baik J, Murthy DNP, Jack N. Erratum: Two-dimensional failure modeling with minimal repair. Nav Res Logist 2006; 53: 115-116. 27. Manna DK, Pal S, Sinha S. A note on calculating cost of two-dimensional warranty policy. Comput Ind Eng 2008; 54: 1071-1077. 28. Gertsbakh IB, Kordonsky KB. Parallel time scales and two-dimensional manufacturer and individual customer warranties. IIE Trans 1998; 30: 1181-1189. 29. Huang YS, Chen E, Ho JW. Two-dimensional warranty with reliability-based preventive maintenance. IEEE T Reliab 2013; 62: 898-907. 30. Ye Z-S, Murthy DNP, Xie M, Tang L-C. Optimal burn-in for repairable products sold with a two-dimensional warranty. IIE Trans 2013; 45: 164-176. 31. Shahanaghi K, Noorossana R, Jalali-Naini SG, Heydari M. Failure modeling and optimizing preventive maintenance strategy during two-dimensional extended warranty contracts. Eng Fail Anal 2013; 28: 90-102. 32. Samatlı-Paç G, Taner MR. The role of repair strategy in warranty cost minimization: An investigation via quasi-renewal processes. Eur J Oper Res 2009; 197: 632-641. 33. Lu J-C, Bhattacharyya G. Some new constructions of bivariate Weibull models. Ann Inst Stat Math 1990; 42: 543-559. 34. Gupta SK, De S, Chatterjee A. Warranty forecasting from incomplete two-dimensional warranty data. Reliab Eng Syst Safe 2014; 126: 1-13. 35. Kim CS, Djamaludin I, Murthy DNP. Warranty and discrete preventive maintenance. Reliab Eng Syst Safe 2004; 84: 301-309. 36. Kijima M. Some results for repairable systems with general repair. J Appl Probab 1989; 26: 89-102. 37. Manna DK, Pal S, Sinha S. Optimal determination of warranty region for 2D policy: A customers' perspective. Comput Ind Eng 2006; 50: 161-174.
23