Marc S. Weinberg, Brian T. Cunningham, and Christopher W. Clapp ... supported by The Charles Stark Draper Laboratory Inc. Subject Editor, R. T.. Howe. The authors ...... [9] C. Smith, A. J. Gilchrist, and D. N. Wormley, âMultiple and continuous.
370
JOURNAL OF MICROELECTROMECHANICAL SYSTEMS, VOL. 9, NO. 3, SEPTEMBER 2000
Modeling Flexural Plate Wave Devices Marc S. Weinberg, Brian T. Cunningham, and Christopher W. Clapp
Abstract—A lumped-parameter model is derived for flexural plate wave (FPW) devices which are rectangular plates or diaphragms with structural layers, a piezoelectric layer, and with interdigitated conducting combs for driving and sensing. This configuration is often used in micromechanical chemical sensors. The model is based on a closed-form solution of a resonating beam; however, the results are applicable to plates supported on four edges. The model gives a voltage or charge output from the sense combs as a function of voltage applied to the drive combs. The analysis predicts the response of the multiple plate modes to axial tensions and to comb finger dimensions and position relative to the diaphragm eigenfunctions. These models are much more detailed than those described in the literature on acoustic chemical sensors [1]–[8] and are difficult to obtain by finite-element solutions. Frequency responses of FPW devices constructed from silicon with deposited aluminum nitride as the piezoelectric compared well with analytic results. The effects of boundary conditions on the plate’s lateral edges are discussed in both the analysis and testing. [530]
(a)
Index Terms—Acoustic waves, biological sensors, chemical sensors, flexural plate wave, modal analysis, modal response, modeling, piezoelectric, separation of variables.
I. INTRODUCTION
F
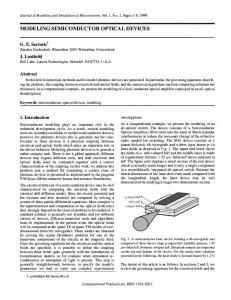
LEXURAL plate wave sensors (FPWs) have been proposed for, and are being applied to, chemical and biological sensing, fluid pumping, and filtering [1]–[8]. The basic FPW device is shown in Fig. 1. A rectangular diaphragm, usually doped silicon on the order of 1–3- m thick, is coated with a piezoelectric layer, usually aluminum nitride, zinc oxide, or lead zirconium titanate (PZT). The piezoelectric material’s thickness is generally 0.2–1 m. Conducting interleaved fingers are placed on the piezoelectric. One pair of fingers is used to drive the diaphragm, while the second is dedicated to sensing. The finger spacing and width are selected to excite desired vibration modes and, hence, operating frequency. In the FPW, as opposed to the surface acoustic wave (SAW), the diaphragm is assumed thin compared to the vibrating modes’ wavelengths so that the two surfaces are strongly coupled and a single wave propagates along the diaphragm. Previous models used to predict behavior were based on simple beam equations [1]–[7]. Paralleling SAW devices, these FPW’s were operated as delay lines so that propagation velocity was the major consideration. An FPW sensor may be operated as a delay line by using tone bursts to measure the phase velocity, group velocity, and insertion loss. RF tone bursts are applied to one transducer, and the RF frequency Manuscript received February 2, 2000; revised April 5, 2000. This work was supported by The Charles Stark Draper Laboratory Inc. Subject Editor, R. T. Howe. The authors are with The Charles Stark Draper Laboratory Inc., Cambridge, MA 02139 USA. Publisher Item Identifier S 1057-7157(00)08028-8.
(b) Fig. 1.
Schematic of FPW. (a) Mechanical. (b) Electrical.
is tuned to obtain maximum output of the received signal, which corresponds to the resonant frequency , from which the phase velocity may be calculated. The pulse travels at the group velocity, which can be calculated using the delay time between input and output. The tone-burst method eliminates interference due to electromagnetic feed through that travels at the speed of light, rather than at the speed of Lamb wave propagation. Since the electromagnetic pulse input is gone before the acoustic pulse arrives at the output interdigitated transducer (IDT), this method is advantageous for measuring changes of insertion loss or attenuation over a large dynamic range [1]. In [1]–[7], almost no comparison of model versus experimental data was offered. Martin et al. [8] analyzed a simply supported rectangular diaphragm driven at resonance by electromagnetic Lorentz forces, but did not consider the many resonances generally observed. For measurements that require determination of small frequency changes, such as chemical vapor sensing, the use of a feedback oscillator to monitor the resonant frequency in real time is most advantageous. A frequency counter circuit may sample the resonant harmonic and report information digitally. A resonant oscillator requires a closed-loop feedback path, including an amplifier with gain greater than the insertion loss of the device. An oscillation condition can be satisfied if the total phase shift around the loop (amplifier, transducer, and acoustic path) is an rad [1]. integer multiple of
1057–7157/00$10.00 © 2000 IEEE
Authorized licensed use limited to: University of Illinois. Downloaded on January 8, 2010 at 13:10 from IEEE Xplore. Restrictions apply.
WEINBERG et al.: MODELING FPW DEVICES
371
Supported by test data, the enclosed analysis indicates that the FPW can be successfully modeled by modal analysis techniques. This paper focused on steady-state open-loop frequency response; however, the models can be applied to transient inputs and responses, which are used in delay-line FPW’s. The analysis is based on a more detailed solution of a simple beam [9], [10] with piezoelectric forcing [11] (see Section II and Appendix B). Combining beam bending with piezoelectric forcing, the resulting model, this paper’s unique contribution, offers the following benefits. 1) The lumped-parameter model can be combined with electronic models of excitations and sensing elements. 2) The many resonant frequencies and phase variations that appear in frequency responses are predicted. 3) Including the diaphragm’s mechanical quality factor, the model predicts the amplitude of the frequency response from excitation to output voltage. 4) The impact of interdigitated comb parameters, width, spacing, number of teeth, and distance between transmitter and receiver on all the eigenmodes is included. Construction of The Charles Stark Draper Laboratory Inc., Cambridge, MA, FPW sensors is described in Section III. Theoretical and measured response are compared in Section IV. Effects of plate width, which can add additional resonant frequencies, are discussed in Section IV-C and Appendix C. Section V presents conclusions. II. DERIVATION OF LUMPED-PARAMETER MODEL
Fig. 2.
Nomenclature for beam analysis.
and spacing are 9.4 m so that the comb pitch is 37.5 m. The resulting phase velocity (pitch times resonant frequency) is 1000 m/s so that energy is not radiated into water, whose sound velocity is 1500 m/s. Two sets of end conditions will be considered. For easier reading, the situation with the beam ends pinned will be handled in this section. The solutions for built-in ends will be presented in Appendix A, which will show that, for beams much longer than the wavelengths, the solutions for pinned and built-in ends yield almost identical conclusions. When the beam ends are pinned, the displacements and the bending moments are zero so that
A. Modal Solution of Beam Equations 1) Beam Equations: Following [9] and [10], which ignore small rotation [1] effects, and the nomenclature of Fig. 2, the equation describing the motion of a plate or beam is (1)
(2a) (2b) where the prime ( ) indicates differentiation with respect to . Parts of the needed solution appear in [9], which deals with suspension bridges, and in [10]. The homogeneous solution to (1) is obtained by assuming that
where position along beam; displacement normal to beam; time; mass per unit length (2.5 10 kg/m); damping per unit length (1.0 N-s/m , which corresponds to the quality factor of 400 for mode whose resonant frequency is 26.6 MHz); force per unit length; a gravitational load would be an example (in Section II-B, piezoelectric forces are included); rigidity for single-layer plates sup10 N/m ) (relations for ported at ends (8.8 multiple layer plates are derived in [11] and summarized in Appendix B); tension or axial force; the tension is included because it dominates thermal sensitivity. The values in parenthesis are for constructed diaphragms (Section III), which consist of three layers: 2- m silicon, 0.5- m aluminum nitride, and 0.1- m gold. The plate width and length are 300 and 1500 m, respectively. The comb teeth
(3) Substitute (3) into (1) and separate variables (4) equals constant, for which we shall solve. equals where the resonant frequency of mode . This will be shown in Section II-B. and one for Equation (4) is two equations: one for . The equation is (5) where
, which implies (6)
is an eigenvalue.
Authorized licensed use limited to: University of Illinois. Downloaded on January 8, 2010 at 13:10 from IEEE Xplore. Restrictions apply.
372
JOURNAL OF MICROELECTROMECHANICAL SYSTEMS, VOL. 9, NO. 3, SEPTEMBER 2000
Per [10, p. 210], the solution of (5) with the boundary conditions (2) or (A.1) are orthonormal, which is an attribute that will be used in Section II-B. The solution for in (5) is
where the mode shapes are those determined in Section II-A. Insert (11) into (1) and use (4) (12) is the resonant frequency of each mode, as stated Note that and inafter (4). Multiply both sides of (12) by voke the orthonormal properties of the eigensolution [10] to obtain the equation of motion for each mode as follows:
(7) . , , , equal constants of intewhere gration. In (7), is not the damping of (1). is the coefficient of for When the axial force is zero, all terms in (7). These eigenvalues and functions are derived or listed in [9]–[12]. Unique contributions of this paper are the response to piezoelectric forcing from comb excitation and the effects of axial force . 2) Pinned Ends Without Tension: With the boundary condi, nonzero values for the contions described by (2) and , the eigenvalues, stants in (7) are obtained only for where equals any integer. The mode shape (eigenfunction) is (8a)
(13) equals the modal forcing function, the force driving where mode . In order to study effects of build tolerances, assume that the mode shape (8a) or (A.2a) and (A.2b) is given by (14) where equals the alignment between eigenmodes and reference. Due to the large number of modes, pinned and built-in . beams differ little, except for the phase shift of Assume that a force density whose first harmonic is described by [11] drives the beam
With (6), the natural frequency of the th mode is
(15) (8b)
3) Pinned Ends with Tension: With the boundary conditions described by (2) and axial force, new results are obtained. At the beam’s ends, the sine term must be zero in (7), i.e.,
(9) With (6) and (9), the eigenfunction and associated resonant frequency are (10a) (10b)
where , the factor determines the first harmonic of the step sequence positive, zero, negative, and zero torques; magnitude of piezoelectric torque (B.1) per volt 10 N m/V), the applied to electrodes (2.6 converts from torque to force per factor unit length; voltage applied to electrodes (include plus and minus sides); sinusoidal inputs will be emphasized; alignment between comb fingers and reference; length of transducer equals mP/2 (712 m); comb pitch (37.5 m); number of combs in transducer, the number of half sines in (38 for both sense and drive combs). With (13)–(15), the modal forcing function is determined as
With no axial tension, the resonant frequency of (8b) is regained. The mode shape is identical with and without tension. ), the resonant frequency is proportional With no rigidity ( . to B. Modal Excitations Follow [9] and consider the forced response, which was not done in the previous FPW literature [1]–[8]. Assume that the forced response is given by (11)
(16) and ends at . (For the drive where the comb starts at and for the sense combs m) combs constant, which relates the modal force to the input voltage; modal stiffness equals . In (16), the integral is taken over the transducer length since is the combs exert the force. The units of are m/V and
Authorized licensed use limited to: University of Illinois. Downloaded on January 8, 2010 at 13:10 from IEEE Xplore. Restrictions apply.
WEINBERG et al.: MODELING FPW DEVICES
proportional to modes are aligned, tion where is
373
times the integral. When the combs and and . Consider the situaand , the modal forcing function
zero steps. It is convenient to consider these steps as a sinusoid, which is the first harmonics of the stepped area function so that
(20) With (18) and (19) inserted into (20), the total charge on the sense or drive electrode (21)
(17)
Closed-form integration has been done with nonzero phase and is used in the results of Secand comb displacement tions II-F and IV. was represented by its In (16), the force per length in (17) is domfirst harmonic. The modal forcing function inated by terms with denominators, which include ; thus, higher harmonics of have larger values of and contribute little to (17). This conclusion is valid when and . C. Sensed Charge The model for converting strain into charge on the plates is repeated and extended to the dynamic model. From [11], and assuming the plates are grounded, the surface charge per unit length is described by (18)
where the coupling between modal amplitude and charge is given by
(22) The integral in brackets is identical to that used to calculate the are C/m and is proportional modal force (16). The units of times the integral. to D. Lumped-Parameter Model of Piezoelectric Effects Consider the model of the piezoelectric comb, which consists of two electrodes and a ground. The static equations relating modal displacement and charge to drive voltage and modal force is
where piezoelectric constant relating electric field to strain ( 2.6 10 C/N for AlN); piezoelectric material’s Poisson’s ratio (0.28); the term in accounts for plates versus thin beams [11]; Young’s modulus of piezoelectric material; width of diaphragm. , the peak strain at area center Using (14) and (18), for piezoelectric material, is related to the modal amplitudes through
(19) equals the distance between the piezoelectric matewhere rial’s center of area and the diaphragm’s neutral axis for torque inputs (Appendix B). Since the cross section is rectangular, the center of area is essentially the mid-plane of the piezoelectric material; equals the radius of curvature at position . Mindful of the differential amplifier in Fig. 1 and Section II-D, the total sensed charge is calculated by integrating the surface charge per unit length (18) over the length of the transducer. The integration includes the surface charge multiplied by an electrode area function times the incremental length . Assuming ideal electrodes with no fringing, the area function is a repeating sequence of positive, zero, negative, and
(23) where capacitance from one plate to ground; capacitance between positive and negative electrodes; piezoelectric coupling coefficients defined in (16) and (22); modal stiffness; refers to drive electrode; refers to drive electrode. and indicate that the elecThe negative signs on trodes are displaced 180 mechanical degrees from the electrodes. The voltage applied to the negative comb is the negative of that applied to the plus electrodes, i.e., (24) Although there are many modes, only one is considered in (23). With the small coupling assumption implicit in (23), the voltages and currents applied to the plates are still described by , (18)–(22). Formulations (23) and (24) result in
Authorized licensed use limited to: University of Illinois. Downloaded on January 8, 2010 at 13:10 from IEEE Xplore. Restrictions apply.
374
JOURNAL OF MICROELECTROMECHANICAL SYSTEMS, VOL. 9, NO. 3, SEPTEMBER 2000
which is consistent with the circuit diagram of Fig. 1. Symmetry and differential read out suggest the definition (25) Equation (23) is simplified to (26) When adding the circuit resistors, one must consider that consists of two currents, as outlined in (25). Equations (25) and (26) describe both the drive and sense electrode pairs. E. Equations of Motion with Drive and Sense Circuit The results of the previous appendixes are combined into a comprehensive dynamic model that relates excitation voltage to the preamplifier output. The model will include only three modes (11); however, extension to more modes is straightforward and has been shown in Figs. 3 and 4. As outlined in Section II-D, the charge includes both the plus and minus plates. Consider voltage and force applied directly to the piezoelectric material
Fig. 3. Calculated frequency response. Phase between modes and combs ' =
0.
The force applied to the piezoelectric material is described by (28) Assuming the transformer turns ratio is 1 : 1 and that the transformer is center tapped, the voltage applied to the drive comb is (29) equals the voltage applied by source in Fig. 1, where equals the input resistor (50- nominal in Fig. 1). Assuming that the output preamplifiers are at virtual ground, the sense voltage is given by (30) equals the sense resistor (100- nominal in Fig. 1). where The factor of two accounts for the definition of charge (25) that includes both the positive and negative electrodes. F. Observations The linear-differential-equation constant coefficient model summarized in Section II-E applies to both transient and fre-
quency response and, hence, to both delay lines and resonating FPW. For mode numbers greater than five, the pinned and built-in end conditions yield similar modal solutions and sensitivities to tension. For the examples of this section and Section IV, the pinned solutions will be used. The plate eigenfrequency discussion (Appendix C) will consider built-in edges. The frequency response of sensed output voltage with respect to drive voltage is calculated in Fig. 3 for the drive fin, ). gers aligned with the principal eigenmode ( The highest amplitude occurs for the mode whose wavelength corresponds to the finger pitch. A quality factor of 400 was assumed for each peak. Due to the multiple modes, several peaks and 180 phase shifts are seen. The calculated amplitude agrees within a factor of three with measured data (Section IV-B). This is noteworthy since the gain depends on the square of the piezoelectric constant and many dimensions. Without the resonance and high quality factor, the calculated amplitudes would not be achieved. For many modes, the fractional separation between [see (8a), (8b)] and is often seen in peaks is approximately the measured data. As dictated by the modal forcing function (17), peaks whose wavelength is removed from the comb pitch are smaller. As the become larger, the number of peaks generally comb length decreases. If the combs and diaphragm are identical in length and aligned, only one peak is excited.
Authorized licensed use limited to: University of Illinois. Downloaded on January 8, 2010 at 13:10 from IEEE Xplore. Restrictions apply.
WEINBERG et al.: MODELING FPW DEVICES
375
Fig. 5. FPW photograph.
change with temperature in tension proximately described by
in the diaphragm is ap(33)
where
Fig. 4. �=2.
Calculated frequency response. Phase between modes and combs ' =
Fig. 4 displays the calculated frequency response when the . While the frequency separation and alignment angle peak amplitudes are similar, the details from the baseline vary noticeably. The phase shifts and relative amplitudes vary considerably. Since the relationship between the comb fingers and eigenmodes can result in zero modal forcing function, the amplitudes at certain eigenfrequencies are small. The charge is the total charge summed over the electrode, while the force is the modal force, which is a force per unit length along the beam. When the mode period matches the combs’ period (31) in (16)], and the combs are aligned with the eigenmode [ the piezoelectric equation (16) and (22) obey a form of reciprocity, i.e.,
thermal expansion difference between substrate or frame and diaphragm (1 ppm/ C; parameters assumed, for example, are in parentheses); Young’s modulus (1.65 10 N/m for silicon along 110 ); diaphragm width (300 m); diaphragm thickness (2.5 m). As an approximation, the diaphragm is thin so that its length is determined by the relatively massive frame’s stretching, which is set by its thermal expansion coefficient. The diaphragm strain is than determined by the frame stretching and thermal expansion of the diaphragm so that (33) ensues. Assume a 0.0015-m-long diaphragm operating at the mode . The wavelength is 150 m, four times longer number than those constructed (Section III) and the eigenvalue (8a) and (8b) is 4.2 10 m . The tension is 1.2 10 N/ C. Calculated per Appendix B, the structural rigidity (1) is 8.8 10 N/m . With (8a) and (8b) and (10b) or (A.4), the frequency variation from axial tension is 390 ppm/ C, which is high compared to the 26 ppm/ C calculated form Young’s modulus’ thermal variation. Reducing the pitch raises the wavenumber and reduces this thermal sensitivity. Along with energy radiation discussed after (1), thermal sensitivity is a second reason for reducing the comb pitch to the constructed 37.5 m. III. SENSOR CONSTRUCTION
(32) The units of are m/V, k, N/m , and , C/m. The reciprocity demonstrates symmetry between voltage, modal force, charge per length, and modal amplitude. When the eigenmodes are not aligned with the combs, (32) does not govern. The frequency variation from tension (10b) or (A.4) can become quite large for small mode numbers. For example, the
A scanning electron microscope photograph of a completed FPW device is shown in Fig. 5. The fabrication sequence for building The Charles Stark Draper Laboratory Inc.’s FPW resonator (cross-sectional diagram of a completed device is shown in Fig. 6) begins with a purchased silicon-on-insulator (SOI) wafer (BCO Technologies, Belfast, U.K.). The SOI wafer upper surface is a 2- m-thick layer of epitaxial silicon bonded to a 1m-thick layer of SiO . The SOI substrate is 380- m thick. An
Authorized licensed use limited to: University of Illinois. Downloaded on January 8, 2010 at 13:10 from IEEE Xplore. Restrictions apply.
376
JOURNAL OF MICROELECTROMECHANICAL SYSTEMS, VOL. 9, NO. 3, SEPTEMBER 2000
Fig. 6. Fabrication sequence.
approximately 0.5- m layer of piezoelectric AlN is deposited over the upper epitaxial silicon [13]. Vias for grounding contacts to the epitaxial silicon are provided by etching an opening into the AlN. Next, titanium-platinum-gold (TiPtAu) metal of 0.1- m total thickness is patterned to define interdigital metal electrodes, wire bond pad areas, and ground contacts. Finally, the membrane is defined by etching a vertical sidewall cavity from the backside of the wafer with an inductively coupled plasma (ICP) etch machine using the Bosch process. The 1- m SiO layer of the SOI substrate acts as an automatic etch stop for the ICP process. After the ICP etch is completed, the SiO layer is removed by dipping the wafer into buffered hydrofluoric acid. IV. MEASURED FREQUENCY RESPONSE A. Test Description After fabrication, FPW devices were characterized to determine how well they matched modeled performance and design parameters. Each device was tested in an open-loop configuration through signal conditioning electronics designed to interface to a Hewlett-Packard Network Spectrum Analyzer. The electronics transformed single-ended source excitation to a differential drive voltage, and returned both a reference signal (identical to the source excitation input) and the amplified output (Fig. 1). Amplification of the low signal output was achieved through an instrumentation amplifier (IA), which resulted in extremely high common-mode rejection ratio, symmetrical loading on sensor outputs, and high gains. Each of the three active components that constituted the IA had high gain-bandwidth products to improve phase errors over gain and frequency. Further reduction of errors was achieved by calibrating the analyzer and electronics to remove cabling and stray capacitance effects. Once calibration was completed, wide-band (10–30 MHz) spectral measurements determined the resonant frequency of the primary mode, while narrow-band (1-MHz) measurements were used to investigate mode structure, quality factor ( ) of resonance, and phase transition across primary mode frequency width. B. Results Supported by Beam Theory For the complete open-loop system from voltage input to sensed output, the frequency response for a typical FPW is shown in Fig. 7. The quality factor of the individual peaks, calculated from 3-dB points, is roughly 400. The response
Fig. 7. Measured FPW frequency response, which compares well with the ' = �=2 calculation of Fig. 4.
of Fig. 7 closely resembles that calculated in Fig. 4. The calculated resonances are centered about 26 MHz compared to the measured 25 MHz. The calculated amplitude agrees within a factor of three with that measured; a good result since the gain depends on the square of the piezoelectric constant, a parameter which is difficult to control during fabrication, and many dimensions. Without the resonance and high quality factor, the calculated amplitudes would not be achieved. The center frequency of the peak cluster is close to that predicted in (8a) and (8b) and shown in Figs. 3 and 4. The fractional , as predicted separation between peaks is approximately by (8a) and (8b). While the center frequency, the frequency separation between adjacent peaks, and the amplitude match calculations, the measured relative peaks vary between units, an observation that agrees with the calculations of Figs. 3 and 4. The misalignment between the combs and modal pattern (Fig. 4) corresponds to 9 m, a figure comparable to tolerances for through-the-wafer ICP etching, which determines the modal positions. C. Results that Differ from Beam Theory The previous section describes most of the measured results. Occasionally, FPW are measured where the center frequency and amplitude approximate the calculations, but the separation predicted by (8a) and between peaks is smaller than the have been measured. As (8b). Peak separations as close as described in Appendix C, it is thought that these extra peaks
Authorized licensed use limited to: University of Illinois. Downloaded on January 8, 2010 at 13:10 from IEEE Xplore. Restrictions apply.
WEINBERG et al.: MODELING FPW DEVICES
377
are contributed by transverse modes, which result from the finite plate width. Measurements are presently being conducted to measure the plate modes interferometrically.
change. No tension is the nominal design condition. With tension and built-in ends, the eigenvalues are solutions of the following:
V. CONCLUSIONS A lumped-parameter model is derived for FPW devices, which are rectangular plates or diaphragms with structural and piezoelectric layer and with interdigitated conducting comb for driving and sensing. This configuration is often used in micromechanical chemical sensors. The model is based on a closed-form solution of a resonating beam; however, the results are applicable to plates supported on four edges. The model gives a voltage or charge output from the sense combs as a function of voltage applied to the drive combs. The analysis predicts the response of the multiple plate modes to axial tensions and to comb finger dimensions and position relative to the diaphragm eigenfunctions. These models are much more detailed than those described in the literature on acoustic chemical sensors ([1], [2] and others from which these derive) and are difficult to obtain by finite-element solutions. In most cases, frequency responses of FPW devices constructed from crystalline silicon with deposited aluminum nitride as the piezoelectric compared well with analytic results. In a few cases, resonant peaks were spaced more closely that predicted by the beam theory modal analysis. In these cases, coincidence of eigenfrequencies from transverse modes is a likely cause of the extra peaks. APPENDIX A MODAL SOLUTIONS FOR BUILT-IN ENDS
(A.3) . where Expand (A.3) into a linear Taylor series about the nominal , which is valid for when sinh solution is approximately cosh and very large. The linear expression for the change in is (A.4) where the nominal is given by (A.2a). For chemical sensors , so that can be omitted in calculating resonant frequency’s thermal sensitivity and the first-order expansion matches that for pinned ends (10b). The eigenfunction will change shape with increasing tension. Assuming sinh and cosh are large, the eigenfunction is approximately
The eigensolutions of Section II-A are derived for beams with built-in ends. When the beam ends are built-in, the displacements and slopes at the ends are zero as follows: (A.1a) (A.1b)
(A.5) Expanding about the nominal solution
where equals the length of beam or diaphragm (Fig. 1). 1) Built-in Ends Without Tension: The micromachined diaphragm should approach the built-in case. No tension is the nominal design condition. With the boundary conditions de, nonzero values for the constants in scribed by (A.1) and . This classic (7) are obtained only for result duplicates [12, p. 109]. The cosh term becomes large quickly so that for greater than five (A.2a) The exponential terms in (7) are only important near the ends , the modes are approximately so that, for (A.2b) The natural frequency is still described by (6). Depending on the boundary conditions, the mode shape has changed position and frequency from those of the pinned case. 2) Built-in Ends with Tension: The micromachined diaphragm should approach the built-in case. Tension is the dominant factor in the resonant frequency sensitivity to thermal
(A.6)
APPENDIX B RADIUS OF CURVATURE AND PIEZOELECTRIC TORQUES FOR MULTILAYER BEAMS Derived in [11], the structural rigidity and piezoelectric torques for multilayer plates are summarized. The bending torque (15) generated by an electric field across the piezoelectric layer is (B.1) where
Authorized licensed use limited to: University of Illinois. Downloaded on January 8, 2010 at 13:10 from IEEE Xplore. Restrictions apply.
378
JOURNAL OF MICROELECTROMECHANICAL SYSTEMS, VOL. 9, NO. 3, SEPTEMBER 2000
torque per unit voltage across the piezoelectric layer; Poisson’s ratio: the term in accounts for plates versus thin beams (results for a slender beam can be obtained ); by setting piezoelectric coupling coefficient; index for a material layer; the subscript represents the piezoelectric layer; distance between piezoelectric material’s center of area and the diaphragm’s neutral axis for torque inputs; Young’s modulus; layer thickness; layer cross-sectional area (thickness times width). A concept well known in conventional stress analysis [15], the neutral axis for torque inputs is the weighted center of for the entire composite plate and does not depend on the magnitude of the torque. The neutral axis for torque inputs is
Fig. 8.
Resonant frequencies from plate model.
for simple supports and built-in; for simple support;
for all edges
for built-in; (B.2)
where equals the vertical distance from center of area to an arbitrary reference. The structural rigidity in (1) is the radius of curvature times unit bending torque and is calculated by (B.3) where equals the area moment of inertia for each layer calcuequals each layer’s lated about its center of area; vertical position measured with respect to the torque neutral axis. APPENDIX C EIGENVALUES WITH LATERAL EDGES As a first approximation for a rectangular plate, the eigenmodes in the - and -directions are close to those derived from beam theory [12], i.e., the displacement is a sinusoid in multiplied by a sinusoid in . From [12, eq. (11-21)], for an isotropic or orthotropic rectangular plate built-in or simply supported on four edges, the eigenfrequencies (in hertz) are given approximately by
(C.1) where mode number along length (typically 80 for The Charles Stark Draper Laboratory Inc.’s FPW designs); mode number across width; length of plates (0.0015 m); width of plates (0.0003 m);
Young’s modulus; plate thickness; mass per unit area. For a simply supported plate, (C.1) becomes (C.2) For the nominal built-in case, the eigenfrequencies are plotted versus and , the mode numbers along the length and width, respectively, in Fig. 8. Equations (C.1) and (C.2) duplicate beam . With and , the built-in’s restheory when beam case; thus, onant frequency is 0.5% larger than the beam theory is adequate for predicting the basic resonances. Static finite-element results show that the peak displacements for one- and two-dimensional plate and beam theory are similar, a consequence of the plate width being greater than the eigenmode spatial period. The plate theory predicts an abundance of additional modes corresponding to half-wavelengths along the width (Fig. 8). For example, the 80,1 mode can be close to the 79,2 or 79,3 or 78,3 modes. Assuming that (17) or (18) describes the modal forcing functions along the width, the excitation should not excite the higher order modes in . With fingers across the diaphragm, the modal forcing functions are approximately the Fourier transforce exists and the form of a square wave so that no force is 1/3 the fundamental. Due to sense and drive, the voltage amplitude is the modal forcing function squared. Due to machining imperfections, it is possible that modes can be coupled to one another so that the 79,2 and 78,3 could form a substantial peak if both are at the same eigenfrequency. Examples are discussed in Section IV-C. ACKNOWLEDGMENT The authors gratefully acknowledge B. Hugh, The Charles Stark Draper Laboratory Inc., Cambridge, MA, for FPW fabrication, R. Bousquet, The Charles Stark Draper Laboratory Inc.,
Authorized licensed use limited to: University of Illinois. Downloaded on January 8, 2010 at 13:10 from IEEE Xplore. Restrictions apply.
WEINBERG et al.: MODELING FPW DEVICES
Cambridge, MA, for electronics development, and E. Weinberg, The Charles Stark Draper Laboratory Inc., Cambridge, MA, for coding parts of the FPW frequency response.
REFERENCES [1] S. Wenzel, “Applications of ultrasonic lamb waves,” Ph.D. dissertation, Elect. Eng. Comput. Sci. Dept., Univ. of California at Berkeley, Berkeley, CA, 1992. [2] D. Ballantine and R. M. White et al., Acoustic Wave Sensors. New York: Academic, 1997. [3] J. M. Black and R. M. White, “Microfluidic applications of flexural plate wave sensors,” in Transducers’99 Conf., Sendai, Japan. [4] A. H. Meng, A. W. Wang, and R. M. White, “Ultrasonic sample concentration for microfluidic systems,” in Transducers’99 Conf., Sendai, Japan. [5] C. S. Lee, K. No, and D. M. Wee, “A novel angular rate sensor employing flexural plate wave,” in IEEE Int. Ultrason. Symp. Dig., vol. 1, October 17–20, 1999, pp. 493–496. [6] I. Viktorov, Rayleigh and Lamb Waves, Physical Theory and Applications. New York: Plenum, 1967. [7] M. Vellekoop, G. Lubking, P. Sarro, and A. Venema, “A multi-purpose smart acoustic Lamb wave sensor system,” in Transducers’93, Yokohama, Japan, pp. 175–180. [8] S. Martin, M. Butler, J. Spates, W. Schubert, and M. Mitchell, “Magnetically excited flexural plate wave resonator,” in IEEE Int. Freq. Contr. Symp. Dig., 1997, pp. 25–31. [9] C. Smith, A. J. Gilchrist, and D. N. Wormley, “Multiple and continuous span elevated guideway-vehicle dynamic performance,” J. Dynam. Syst., Meas., Contr., pp. 30–40, Mar. 1975. [10] F. Hildebrand, Advanced Calculus for Applications. Englewood Cliffs, NJ: Prentice-Hall, 1962. [11] M. Weinberg, “Working equations for piezoelectric actuators and sensors,” J. Microelectromech. Syst., vol. 8, pp. 529–533, Dec. 1999. [12] J. Blevins, Formulas for Natural Frequency and Mode Shape. Melbourne, FL: Krieger, 1979. [13] P. Hsieh, R. Reif, and B. Cunningham, “DC magnetron reactive sputtering of low stress aluminum nitride piezoelectric thin films for MEMS applications,” in Proc. Mater. Res. Soc. Fall Meeting, Boston, MA, Nov. 1998. [14] R. J. Roark and W. Young, Formulas for Stress and Strain, 5th ed. New York: McGraw-Hill, 1975. [15] S. Crandall and N. Dahl, An Introduction to the Mechanics of Solids. New York: McGraw-Hill Book Co., 1959.
379
Marc S. Weinberg received the B.S., M.S., and Ph.D. degrees in mechanical engineering from the Massachusetts Institute of Technology, Cambridge. He is currently a Laboratory Technical Staff and Group Leader in the Systems Engineering and Evaluation Directorate, The Charles Stark Draper Laboratory Inc., Cambridge, MA. He is responsible for the design and testing of a wide range of micromechanical gyroscopes, accelerometers, hydrophones, microphones, angular displacement sensors, chemical sensors, and biomedical devices. He holds 18 patents with 14 patents pending. Dr. Weinberg is a member of the American Society of Mechanical Engineers. He has received The Charles Stark Draper Laboratory Inc.’s Best Patent (twice), Best Publication (twice), and the Distinguished Performance Award for his work on the Tuning Fork Gyro, the first silicon micromechanical gyroscope and other MEMS work.
Brian T. Cunningham received the Ph.D. degree in electrical engineering from the University of Illinois at Urbana-Champaign. He is currently the Manager of Biomedical Technology at The Charles Stark Draper Laboratory Inc., Cambridge, MA. He has worked in the area of microelectromechanical system (MEMS) sensors and actuators for the last nine years. His main research interest is the development of microfabricated structures for chemical and biological measurement and manipulation. His current projects in this area include MEMS biosensor arrays, microfabricated scaffolds for tissue engineering, and microfluid handling systems. He holds three U.S. patents with nine patents pending for MEMS devices including infrared sensors, optical imaging systems, gyroscopes, accelerometers, biosensors, and tissue engineering.
Christopher W. Clapp received the B.S. degree in electrical engineering from the University of Massachusetts at Dartmouth, in 1996, and is currently working toward the M.S. degree in electrical engineering at Northeastern University, Boston, MA. In 1992, he joined The Charles Stark Draper Laboratory Inc., as a Cooperative Education Student, became a Staff Engineer in June of 1996, and is currently a Member Technical Staff II, Microelectromechanical (MEMS) Analysis and Test Group. He is currently involved with the development of MEMS-based chemical/biological Sensors. His responsibilities include sensor and electronics design, characterization, and integration, system-level testing and verification, and validation of sensor performance against the theoretical models used for design refinement. He was previously in collaboration with the Naval Research Laboratory in examining the radiation hardness of fiber-optic gyroscope components. His background includes hardware and software design, data acquisition and analysis, applied physics, instrument test and evaluation, and signal processing.
Authorized licensed use limited to: University of Illinois. Downloaded on January 8, 2010 at 13:10 from IEEE Xplore. Restrictions apply.