Modeling Friction Performance of Drill String Torsional Oscillation
Recommend Documents
the transmission, the motor drives the rotary table: a large ... and the rock or the drill-string and the borehole wall; bend- ..... in steady-state is of great interest.
Aug 12, 2005 - Drill-string vibrations are an important cause for pre- .... 0.25. Tf l(Ï l). [N m. ] Ïl [rad/s]. (b) Friction model at the lower disc. Figure 5. Estimated ...
Then the software substitutes the desired depths and gives to the user graphical and digital form of outputs. Data statistical analysis method has been used for ...
as an elongated rod, the lateral inertia has an important ..... Rayleigh-Love rod as follows: ... this ratio describes the radial contraction of a rod subjected.
Then, an alternative drilling condition using axial excitations at the top-drive, ... a torque drive system at the surface (top position), through a drill-string that ...
no harmonic relationship between them. ... surface of the string and not at its centre, exerts a torque ... small coils attached to the string both for excitation and.
pervision of Hans Ingo Weber. ... Active Control / Leonardo Dias Pereira ; advisor: Hans Ingo. Weber. ...... For example, Astrom (1994) [43] determined that more.
Feb 28, 2007 - 23rd IASTED International Conference, Grindelwald, Switzerland. Rasband, S.N., 1990, Dynamics, Wiley, New York, chapter âThe circle map ...
Dynamic Compensation of Torsional Oscillation in Paper Machine Sections. M. AnÃbal Valenzuela, Senior Member, IEEE, John Martin Bentley, Life Fellow, IEEE,.
Key words: torsional oscillation; transversely isotropic material; dual integral equation; ... The rigid disk is forced to perform simple harmonic motion with period.
Abstract: A fuzzy-logic-based adaptive power system stabilizer. (PSS) is proposed. ... Keywords: Distance protection, transmission and distribution sys-.
proved understanding of the causes for torsional vibrations, an experimental drill-
string setup is built. The setup consists of a. DC-motor that is connected to the ...
Apr 27, 2016 - stick-slip motion of the bit which has particularly negative effect on the ..... respectively, and 1 and 2 are the PDF at the specific slip area and ... WOB should be done cautiously because it may have negative influences ...
Sep 9, 2004 - drill string is rotated while pulling out of the hole, which is performed on top drive rigs. In API RP 7G it is recommended that tool joints have a ...
paper proposes to use the clamping capacitors of the capacitor-clamped inverter ... capacitors are capable of containing torsional oscillations within the inverter ...
Feb 27, 2015 - arXiv:1502.07841v1 [astro-ph.HE] 27 Feb 2015 .... and dimensionless spin a < 0.4 [27,28,18,47,82]. For a < 0.4 and q/a2 = 1, the external ...
Sep 12, 2017 - with a standard spade-type drill bit. Following drilling measurements, nine 5.1-cm-thick disks were cut from the decayed log, one at each drilling ...
speed two-way communication between a top-hole server computer (master) and a number of. 3 .... number of Links can be deployed, providing for unlimited length of the transmission line. Links are ...... a dedicated laptop computer.
Page 1 ... Dr. Michel Kocher, Charmilles Technologies S.A., Meyrin, rapporteur. Dr. Piotr Myszkorowski, EPFL, ... manufacturers are faced with the problems of friction in their axis drives. ..... 5.5 Block diagram of a Luenberger-like state observer
Abstract: In the at hand paper the influence of the friction modeling on the results of the Finite ... model is proposed, which incorporates Coulomb's friction law.
models are appropriate for quick simulation or for control purposes. ... His talk started a revival of Coulomb's idea of asperities in the 90's [8â10]. ... the local friction function Ff , of the relative velocity at each block, is that it must dec
Z N. Farhat, Wear 250 (2001) 401-408. 3.2. ... Lepper K, James M, Chashechkina J, Rigney DA, Wear, 203 (1997) 46. 6.7. ... Spearing SM, eds., Mater. Res. Soc.
Materials tested, from hard to soft, include coated steel, plastics, ATD rubber, and roof linear fabric. Static and dynamic friction coefficients are measured using a ...
The friction coefficient is taken as 0.4 constant throughout the analysis in all the ... cutting and thrust forces are not correctly predicted at the same time, the latter ...
Modeling Friction Performance of Drill String Torsional Oscillation
Jul 2, 2017 - drill string torsional oscillation on the axial friction force is discussed. The results indicated .... the wellbore surface can be ignored. It was determined by ..... There were no fluid effects on the moving body, and the coefficient of ...
Hindawi Shock and Vibration Volume 2017, Article ID 4051541, 14 pages https://doi.org/10.1155/2017/4051541
Research Article Modeling Friction Performance of Drill String Torsional Oscillation Using Dynamic Friction Model Xingming Wang,1 Ping Chen,1 Zhenhua Rui,2 and Fanyao Jin3 1
State Key Laboratory of Oil and Gas Reservoir Geology and Exploitation, Southwest Petroleum University, Chengdu, China Independent Project Analysis Inc., Washington, DC, USA 3 School of Mechatronic Engineering, Southwest Petroleum University, Chengdu, China 2
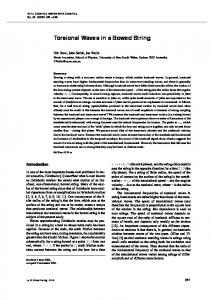
1. Introduction Directional drilling is a widely used method in the drilling engineering for oil and gas industry. The sliding drilling mode is a critical process that drilling string maintains only axial sliding movement to keep tool face of downhole assembly (BHA) from rotating (the orientation of tool face of BHA can control the direction of wellbore). Excessive axial drag has become a serious problem, especially in extendedreach horizontal wells with a motor/MWD system. Some techniques are available to reduce drill string drag. Rotary steering systems (RSSs) are configured so that the entire drill rotates continuously with steering capabilities. High costs hinder the promotion of RSS technology. Technology called “torque rocking” or pipe torsional oscillation systems [1–4] procedure consists of turning the pipes to the right and then to the left by an amount that avoids interference with the tool face; this is depicted in Figure 1. The phenomenon of friction reduction under the influence of drill string rotation has
been understood and utilized by drilling engineer for years. However, the drag reduction mechanism of drill strings’ torsional oscillation is not fully understood. Friction performance is very complex [5]. Pohlman and Lehfeldt [6] found that longitudinal tangential vibrations exert a significantly greater influence on the friction force than the normal ones. Papers argued that [7–10] changes of the friction force vector under the influence of vibrations cyclic are the cause of the reduction of friction resistance. A variable vector of the relative sliding velocity resulted in the force being two components, one of which is parallel and the other of which is perpendicular to the direction of motion. Therefore, only a portion of friction acted in the axial direction of the motion. Consequently, the occurrence friction of transverse tangential vibration was reduced when the driving force was perpendicular to the vibration direction. Experimental investigations [7–9] attempted to analytically describe this phenomenon. Consistency between analytical and experimental results led to a qualitative fit rather
2
Shock and Vibration Hook load ‘‘Torque rock’’
Ground surface
Drilling mud Friction force Gravity
Drilling pipes
4000∼7000 m
Keep BHA tool face not rotating
Figure 1: Schematic diagram of “torque rocking”.
than quantitative agreement [11]. Gutowski and Leus [12] indicated that one of the reasons for the lack of agreement was that these authors utilized only a simple static Coulomb model. The computational model established by other papers [12–14] based on the Dahl model was in good agreement with experimental results. However, the transverse tangential vibration and sliding motion were separated in the plane, and the material properties of the friction pair were the same. The model was not suitable for drill string dynamics analysis because the drill string rotary and sliding on the circular surface and material hardness of the drill pipes and rock wellbore were different. The model [12] also needed a coefficient of vibration transfer to match the experimental results, and the coefficient was difficult to determine for drill engineering. The model neglected the damp of contact zone and the viscosity of motion. It also did not describe the static friction of drill string kinetics; however, it is important for the analysis of drill kinematics [1, 2]. In this work, we presented a dynamic model on the dynamics of the motion of sliding and rotary drill strings for perfectly elastic contact in a viscous fluid environment. Unlike Tsai and Tseng [10], Storck et al. [8], or Gutowski and Leus [12], the discretized LuGre model was utilized for the friction model between the drill string and wellbore rock in a well-hole surface. The computational model establishing process took into account difference in the hardness of the friction pair material in the downhole. This method was more comprehensive for describing the friction between the drill string and wellbore surface.
2. Computational Model 2.1. Surface and Contacts Forms. The axial friction force (or called drag) in axial direction is a focus problem in drilling engineering. Low axial friction can be benefit for drilling. During rotary drilling or “torque rocking,” the motion of the drill string is a result of superposition of two motions. The first of these is drill string’s tangential rotary motion,
whereas the second one is sliding motion in the wellbore’s axial direction. On the macroscopic level, the apparent area of wellbore surfaces observed by the naked eye is “rough” [15]. The drill string surface, apparently a smooth surface, is still “rough” on a microscopic level. The microcontact models [16, 17] assumed that surfaces are composed of hemispherically tipped asperities. The elastic contact of spheres and half spaces are governed Hertz equations to compute the load, contact area, and contact pressure acting on a deformed asperity. Considering the real contact between the drill string and the borehole rock, we made the same assumption for the contact surface. This implies that the drill string surface is a slightly rough surface and the wellbore is a severe rough surface composed of a large number of elastic bristles, which is an abstraction of asperities. Due to the roughness and hardness difference between the drill string and wellbore rock by surface contact, the general elastic bristle in the dynamic friction model should be the bristles on the wellbore, which, unlike these models, was assumed on the motion body plane contact. The simplified model is shown in Figure 2. 2.2. Basic Assumptions. To analyze the real working conditions of a drill string in a downhole, the following assumptions are made: (1) the bristles on the drill string are rigid, (2) the bristles on the wellbore rock are elastic, and (3) drill string rolling friction will not occur. 2.3. Torque and Drag Computational Model. Based on the above assumptions, the drill string actual working conditions can be simplified into the interaction model as shown in Figure 3. The end point of the general bristle connects with the moving drill string; the connecting point will rupture and rebuild at a different point on the moving body surface with the motion of the drill string. In the LuGre friction
Shock and Vibration
3 as the distance of end points 𝑂 and 𝑁 of the element. The scale of artificial elements was the micron level; the curvature of the wellbore surface can be ignored. It was determined by the coordinates of points 𝑂 and M [10], where M is the projection of point 𝑁 on the wellbore surface and can be expressed as follows:
z Wellbore Rotation Drill pipe
→ |𝑧 (𝑡)| = 𝑂𝑀
x
Torsional oscillation
Drill pipe Contact zone
Wellbore rock
Fd
Contact zone
𝑀1 (𝑡) = [𝑥1 , 𝑦1 ] = [𝑥0 , 𝑦0 + Δ𝑥] .
Wellbore rock
Figure 2: Modeling of contact’s elastic deformation.
model [18], the force was determined from the following equation: → → → → 𝑧 (𝑡) + 𝜎2 𝑑 𝑧 (𝑡) + 𝐹𝑓 (𝑡) = 𝜎1→ 𝐹𝑓 (𝑉𝑟 ) . 𝑑𝑡
(1)
2.3.1. Friction Caused by Bristle Deformation. It assumed in the LuGre model that the rate 𝑧̇ of the elastic strain of a general bristle in the contact zone depended on both the tangential rigidity 𝜎1 of the contact zone as well as the relative velocity V𝑟 of the sliding and rotary drill string [18, 19]. A generalized form of this expression was represented by the following equation: V 𝑧 𝑧̇ = V𝑟 − 𝑟 (2a) 𝑔 (V𝑟 ) 2
𝑔 (V𝑟 ) =
(𝐹𝑐 + (𝐹𝑠 − 𝐹𝑐 ) exp (− (V𝑟 /V𝑠 ) )) 𝜎1
.
(3)
The position of M at any instant of wellbore is the result of the superposition of motion caused by the drill string sliding and tangential motion. At consecutive instants, the point M changes its relative position and the elastic deformation 𝑧 also underwent a magnitude and directional change. The deformation of the elastic bristle was separated into two phases at any interval Δ𝑡 [10, 12]. In the first phase, during the previous Δ𝑡 time step, the instantaneous rotating velocity of the drill string led to the motion of points M in the tangential direction. In the second phase, the motion of point M was the result of the sliding motion of the drill string in the axial direction within Δ𝑡 time step. At a consecutive time interval Δ𝑡, in the first phase of motion, point M moved to the position 𝑀1 (𝑡) determined by the following coordinate:
y
Drill pipe
𝑂 (𝑡) = [0, 0] , 𝑀 = [𝑥0 , 𝑦0 ] .
(2b)
In the model for further analysis, the deformation in the contact zone formed by the contact of general bristles sliding and the rotary drill string was modeled by a generalized elastic-damping artificial element 𝑂𝑁, which described the average behavior of the general bristles (Figure 4). An elastic-damping deformation 𝑧 of the contact artificial element at an optional instant 𝑡 can be presented in the model
(4)
At the same time, elastic deformation of the bristle → projection vector moved along the path of 𝑂𝑀(𝑡) to the → path 𝑂𝑀1 (𝑡). The general bristle elastic deformation, on the wellbore surface, relied on the contact tangential rigidity 𝜎1 and damping coefficient of the bristle 𝜎2 . The deformation changed in its magnitude by an increment of Δ𝑧, which can be evaluated using (4). In Figure 4, 𝑧 (𝑡 + Δ𝑡/2) was the actual magnitude of elastic deformation of a bristle in the first phase of motion and can be described by the following relationship: 𝑧 (𝑡 +
Δ𝑡 ) = 𝑧 (𝑡) + Δ𝑧 = 𝑧 (𝑡) + [V𝑟1 2 [
− V𝑟1
(5)
𝑧 2
(𝐹𝑐 + (𝐹𝑠 − 𝐹𝑐 ) exp (− (V𝑟1 /V𝑠 ) )) /𝜎1
] Δ𝑡. ]
The velocity V𝑟1 of the relative motion of the general bristle in the first phase can be determined from the following expression: → → 𝑂𝑀1 (𝑡) − 𝑂𝑀 (𝑡) . V𝑟1 = Δ𝑡
(6)
Knowing the magnitude of elastic deflection 𝑧 (𝑡 + Δ𝑡), we can be determine the end point 𝑀2 position because the
4
Shock and Vibration
z
y
Fd
Drill pipe
Fd Fg
Fx
1
x
2
FN
Wellbore rock
z
FF
Drill pipe
Fy
Drill pipe
Tangential velocity of contactsurface of rotary drilling pipes: y x Torsional oscillation: y = MCH(t)
N(t) General bristle O
zx Axial component
Stationary wellbore rock x
z
zy
M(t)
Transverse component
Projection point y
Figure 3: Distribution of forces acting on the sliding and torsional oscillation of the drill string.
t x
z(t + Δt) z(t + 2Δt)
y O
M(t + Δt) z (t + Δt/2)
z(t)
z (t + 3Δt/2)
M(t + 2Δt)
M3 (t + 2Δt)
M(t)
z (t + 5Δt/2) M3 (t + Δt)
M2 (t + Δt/2)
M3 (t)
M2 (t + 3Δt/2) M2 (t + 5Δt/2)
M1 (t) M1 (t + Δt) M1 (t + 2Δt)
y = y(t) Transverse movement
Figure 4: Changes in a general bristles deformation at consecutive phases of sliding and torsional oscillation of the drill string.
Shock and Vibration
5
→ direction of 𝑧 (𝑡 + Δ𝑡) was along vector 𝑂𝑀2 (𝑡 + Δ𝑡). The coordinates were described as follows: → 𝑧 (𝑡 + Δ𝑡) 𝑀2 (𝑡 + Δ𝑡) = [𝑥2 , 𝑦2 ] = 𝑂𝑀2 (𝑡 + Δ𝑡) → 𝑂𝑀1 (𝑡) 𝑧 (𝑡 + Δ𝑡) = [𝑥2 , 𝑦2 ] → . 𝑂𝑀1 (𝑡)
(7)
→ The angle between the elastic deformation 𝑧 (𝑡 + Δ𝑡) and wellbore axial direction can be determined according to the imposed equation: → 𝑒 𝑂𝑀2 (𝑡 + Δ𝑡) ⋅ → 𝛼 = acrcos ( → 1 ) . 𝑂𝑀2 (𝑡 + Δ𝑡)
(8)
In the second phase, during the following Δ𝑡 time step, drill string sliding led to the motion of points 𝑀2 (𝑡+Δ𝑡) in the longitudinal direction. After the expiry of Δ𝑡, the drill string sliding displacement is Δ𝑥. This displacement related to the → distance of 𝑀2 𝑀3 (𝑡). The value of 𝑧 (𝑡 + Δ𝑡) corresponded to the magnitude of elastic deflection of the bristle after the time interval Δ𝑡. This can be described as follows: 𝑧 (𝑡 + Δ𝑡) = 𝑧 (𝑡 + Δ𝑡) + Δ𝑧 = 𝑧 (𝑡 + Δ𝑡) + [V𝑟2 [ − V𝑟2
𝑧 2
(𝐹𝑐 + (𝐹𝑠 − 𝐹𝑐 ) exp (− (V𝑟2 /V𝑠 ) )) /𝜎1
(9)
]
Velocity V𝑟2 approximately was equal to the average velocity of point 𝑀2 (𝑡 + Δ𝑡) along the straight line 𝑂𝑀3 (𝑡). The value can be determined from the following equation:
(10)
→ → 𝑒1 . The magnitude of where 𝑂𝑀3 (𝑡) = 𝑂𝑀2 (𝑡 + Δ𝑡/2) + Δ𝑥→ → → 𝑧(𝑡 + Δ𝑡) was proportional to |𝑂𝑀3 (𝑡)|. 𝑀3 (𝑡), that was 𝑀(𝑡+ Δ𝑡), was determined from the following equation: → |𝑧 (𝑡 + Δ𝑡)| 𝑀3 (𝑡) = 𝑀 (𝑡 + Δ𝑡) = [𝑥3 , 𝑦3 ] = 𝑂𝑀3 → 𝑂𝑀3 (𝑡) |𝑧 (𝑡 + Δ𝑡)| = [𝑥3 , 𝑦3 ] → . 𝑂𝑀3 (𝑡)
Knowing the magnitude and direction of elastic deformation z at any time interval Δ𝑡, the instantaneous values of friction force 𝑓𝑑 and 𝑚𝑑 were determined at this instant by utilizing the LuGre model. 𝑓𝑑 = [𝜎1 𝑧 (𝑡 + Δ𝑡) + 𝜎2 𝑧̇ (𝑡 + Δ𝑡)] cos 𝛽.
(13)
The torque caused by bristle deformation was determined by the following expression: 𝑚𝑑 = 𝑅0 𝑓𝑦 = 𝑅0 [𝜎1 𝑧 (𝑡 + Δ𝑡) + 𝜎2 𝑧̇ (𝑡 + Δ𝑡)] sin 𝛽.
(14)
→→ 2.3.2. Friction Caused by Viscous Fluid. 𝐹𝑓 (𝑉𝑟 ) was the motion viscous force of the drill string in the drilling mud and → 𝑉𝑟 was the drill-string motion macroscope velocity vector, not the elastic deformation of the bristle on the wellbore [20]. Hence, the damping coefficient was described in Li (2008), as the following equation: 𝑓V = −2𝜋V (
→ Angle 𝛽 between 𝑂𝑀3 (𝑡) and the axial direction can be determined by the following expression:
𝑚V = −2𝜋𝑅03 𝜔 (
𝜏 2
√V2 + (𝑅0 𝜔)
+
2𝜇 ) 𝑑𝑥. 𝐷𝑤 − 2𝑅0
2.3.3. Average Magnitude of Torque and Drag. The average ̃𝑓 in the axial direction of the wellbore and magnitude force 𝐹 during a period of time relates to the magnitude of the friction force in this direction and was essential for initiating and sustaining the drill string motion. It was determined from the following relationship, respectively, ̃𝑓 = 1 ∑ 𝑓𝑑 (𝑡𝑛 ) + 𝑓V (𝑡𝑛 ) . 𝐹 𝑛
(16)
̃𝑓 during a period of The average magnitude torque 𝑀 motion of drill string can be described as follows: ̃𝑓 = 1 ∑ 𝑚𝑑 (𝑡𝑛 ) + 𝑚V (𝑡𝑛 ) . 𝑀 𝑛
(17)
Therefore, the average friction drag due to bristle deformation and viscose fluid can be noted, respectively: (11)
̃ = 1 ∑ 𝑓 (𝑡 ) . 𝑓 𝑑 𝑛 𝑑 𝑛
(18)
̃ = 1 ∑ 𝑓 (𝑡 ) 𝑓 V 𝑛 V 𝑛
(19)
6
Shock and Vibration
The average friction torque caused by bristle deformation and viscose fluid can be determined from the following relationship, respectively: ̃𝑑 = 𝑚
1 ∑ 𝑚 (𝑡 ) 𝑛 𝑑 𝑛
(20)
̃V = 𝑚
1 ∑ 𝑚 (𝑡 ) . 𝑛 V 𝑛
(21)
3. Model Solution and Model Verification 3.1. Model Calculation Program. Based on the aforementioned calculation model, the solving procedure step of novel dynamic friction model was presented in Figure 5. The procedure included two parts (I and II). Part I presented the bristle elasticity and damping force calculation process on the microlevel including two half-time steps. Part II presented a drilling fluid viscous force at the macrolevel. The macrovelocity vector was the combined longitudinal direction and tangential direction velocity. 3.2. Model Verification. To assess the validity of the established model, experimental data and parameter mentioned in paper [12] were adopted to verify established model. The parameters [12] included a frequency of 𝑓 = 3000 Hz, a normal pressure of 𝑝𝑛 = 0.022 N/mm2 , an area of 𝐴 = 1200 mm2 , a coefficient of contact rigidity in tangential direction of 𝜎1 = 67.29 N/𝜇m, a coefficient of contact damping in tangential direction of 𝜎2 = 1 × 10⁻³ N/(𝜇m/s), a coefficient of static friction of 𝜇𝐶 = 0.106, and a coefficient of static friction of 𝜇𝑆 = 0.193. There were no fluid effects on the moving body, and the coefficient of viscosity damping was 𝜎3 = 0 N/(𝜇m/s). The experiment presented in the paper was investigated in terms of the influence of tangential contact vibration on the friction force. The aforementioned model was adopted to calculate the change in the friction force with the dimensionless velocity and to compare it with the experimental results (Figure 6). The calculated results are in reasonable agreement with the experimental data. The largest error is 30.17% and the average error is 9.21%. The model described in the paper by Gutowski and Leus [12] is also in good agreement with the experimental results. However, the influence of a coefficient of vibration transfer in the model [12] is greater than body relative velocity in some conditions. It is also extremely difficult to determine in drill engineering adopting the model described by Gutowski and Leus [12].
4. Discussion and Analysis 4.1. Simulation Parameters. According to the experimental results, the established model can accurately predict the friction from tangential vibration coupled with the sliding motion. Therefore, this model can also describe drill string torsional vibration with sliding in a downhole from a theoretical perspective. Drill pipes in a horizontal wellbore were adopted to analyze axial friction reduction mechanism caused by drill pipe torsional oscillation using general field drilling parameters.
Static and kinetic friction coefficients are fundamental parameters for friction force simulation of drilling string. In the paper [21], static friction coefficient is equal to 0.25 and kinetic friction coefficient is equal to 0.21. Simulation results [21] are in good agreement with the field measured data. Wang et al. [22] obtained friction stiffness coefficient between steel and rock at different frequencies in the experimental environment. The friction stiffness coefficient is equal to 50 N/mm. This parameter has good consistence with experimental data [22]. However, there are rare reports about friction damping coefficient between steel and rock obtained through experiment research. The parameter can be 0.316 N⋅s/mm [18], 0.214 N⋅s/mm [14], and 0.5 N⋅s/mm [23]. Mehmood et al. (2012) and Yu et al. [24] obtained sensitivity analysis results of parameters in the LuGre friction model. The results showed that coefficient 𝜎2 is less sensitive as compared to 𝐹𝑐 and 𝐹𝑠 . In this paper, damping coefficient 𝜎2 was equal to 0.316 N⋅s/mm [18]. Stribeck velocity is also less sensitive than 𝐹𝑐 and 𝐹𝑠 according to Mehmood et al. (2012) and Yu et al. [24]. The rock is multiscale porous medium [25]. Giorgio and Scerrato [26] give values of the Stribeck velocity for a multiporous rock medium. Wang et al. [27] provided parameters used in calculating mud damping effects. Basic simulation parameters were assumed to analyze the drill string axial friction performance affected by rotation and torsional vibration, as shown in Table 1. 4.2. Parameter Sensitivity Study. Tsai and Tseng [10] and Gutowski and Leus [12] described a discrete bristle deformation process based on the Dahl model. This section numerically exploited the influence of two parameters in the LuGre model that the Dahl model does not adopt. Piatkowski [29] analyzed the properties between the Dahl and LuGre dynamic friction models in depth. This section mainly studies the following contents: (1) the importance of taking the Stribeck velocity of the LuGre model into account and (2) the relevance of damping coefficient 𝜎1 in the longitudinal friction force.
Calculation coordinate of visual point M2 Calculation following Δt/2 drill string microscope axial velocity
Calculation following Δt/2 drill string axial displacement
Calculation coordinates of visual point M3
Calculation following Δt/2 elastic bristle vector deformation rate Calculation drilling mud viscous force
Calculation coordinates of actual point M (t + Δt)
Calculation friction force relates to bristle deformation Part-I
Part-II Calculation drill string friction force
n=n+1
Yes
nΔt ⩽ NCG?? No Output the result
Figure 5: Present model solution flow chart.
Shock and Vibration 1
0.06
0.8
0.05
0.6
0.04 Ffx /Fc
Ffx /FC
8
0.4 0.2
0.03 0.02
0
0.01
−0.2 0
0.2
0.4
0.6
0.8
1
1.2
0
1.4
2
d /a
Vs Vs Vs Vs Vs Vs
Figure 6: Comparison between the numerical simulation and experimental results.
4.2.2. Damping Coefficient 𝜎2 Study. The damping coefficient 𝜎2 is a microdamping coefficient in the generalized bristle model. Hence, the LuGre model is applied prior to the Dahl model to describe and predict the general bristle deflection process. According to the description of the LuGre model (De Wit and Carlos Canudas, 1995), the damping coefficient of the average behavior of bristle deflection is relative to a parameterization of 𝑔(V𝑟 ), which has been proposed to describe the Stribeck effect in (2a) and (2b). This section discusses how varied 𝜎2 affects the longitudinal friction force. The numerical results are shown in Figure 8. The longitudinal direction velocity was equal to 1 m/h of ROP. As increasing of vibration amplitude, the axial friction ratio rapidly
Figure 7: Influence of the Stribeck velocity on the change in friction.
0.07 0.06 0.05 Ffx /Fc
4.2.1. Stribeck Velocity V𝑠 Study. Maidla et al. [1, 2] described a force that was applied to a stationary drill string in a downhole and slowly increased until the drill string slides. The sliding resistance experienced two stages, static friction and dynamic friction. The static friction was approximately 25% greater than the dynamic friction. Meanwhile, the LuGre model continues at any instant and can describe dynamic and static characteristics without a velocity piecewise function. This model can also analyze the transition process from static and dynamic friction, which the Dahl model cannot. The effect of the amplitude of the Stribeck velocity is depicted in Figure 7, which varied from 100 𝜇m/s to 300 𝜇m/s. The axial slide velocity was 277.78 𝜇m/s. The rate of penetration (ROP) was equivalent to 1 m/h. It was a common operation parameter in the horizontal well drilling field. The simulation result of friction ratio was extremely low using drilling field operation parameters. However, the axial friction ratio held steady with varied Stribeck velocity at the same vibration amplitude. It indicated that the axial friction ratio was low sensitive to the Stribeck velocity using the drilling operation parameter. The result of Yu et al. was also confirmed [24].
4
0.04 0.03 0.02 0.01 0 2
4
2 = 100 N·s/m 2 = 200 N·s/m 2 = 300 N·s/m
6 Ωa (rpm)
8
10
2 = 400 N·s/m 2 = 500 N·s/m
Figure 8: Influence of the damp coefficient of general bristles on the change in friction.
decreased. However, the greater friction damp coefficient was related to higher axial friction ratio at the same velocity amplitude of torsional vibration. The growth of friction ratio was relatedly low with increasing of damp coefficient. It suggested that damp coefficient of bristle deformation was more sensitive than Stribeck velocity. However, it was little effect of damp coefficient on axial friction as well.
9
18
10.5
16
10 Average axial viscous force (N)
Average axial viscous force (N)
Shock and Vibration
14 12 10 8 6
9.5 9 8.5 8 7.5 7 6.5
4
6 10
2 0
5
Ωa Ωa Ωa Ωa Ωa Ωa
= = = = = =
10
15 (Pa)
10 rpm 12 rpm 14 rpm 16 rpm 18 rpm 20 rpm
20
Ωa Ωa Ωa Ωa Ωa
25
= = = = =
15
20 Ωa (rpm)
30
22 rpm 24 rpm 26 rpm 28 rpm 30 rpm
Figure 10: Influence of frequency of torsional oscillation on the axial viscous force.
4.3.2. Effect of Frequency. This section discussed influence of torsional vibration amplitude of average axial viscous force. The ROP was equal to 7 m/h. The range of torsional oscillation amplitude was between 10 rpm and 30 rpm, while there were common parameters in the drilling fluid. Average axial viscous force decreased with torsional oscillation amplitude increasing (Figure 10). Curve of 1 Hz was slightly higher than curve of 1 Hz. However, curve of 10 Hz was remarkably greater than curve of 1 Hz. 4.3.3. Effect of Viscosity. Axial viscous force was also affected by viscosity of drilling mud. As shown in Figure 11, the viscous force was increasing with the value of viscosity of drilling fluid. However, the whole descending of axial force was remarkable at first and tiny at last with viscosity increasing. In the same as above, the lower torsional vibration amplitude led to greater axial viscous force. It was linear
14 13 Average axial viscous force (N)
4.3.1. Effect of Mud Dynamic Shear. Parametric studies were run to explore the relationship between dynamic shear and axial friction resistance for drill pipes, as shown in Figure 9. ROP was equal to 7 m/h. The axial force slowly rises with increasing of the value of dynamic shear. The relationship between the axial force and dynamic shear was approximately linear within the drill string torsional oscillation amplitudes of 10 rpm and 30 rpm. When the dynamic shear is small, it was little distinction of average axial viscous force that affected different torsional vibration amplitude. Value of average axial viscous force increased with dynamics shear. The greater average axial viscous force was with lower torsional vibration amplitude.
30
f = 0.1 Hz f = 1 Hz f = 10 Hz
Figure 9: Influence of dynamic shear of drilling mud on the change in axial viscous force.
4.3. Viscous Friction of Drilling Mud
25
12 11 10 9 8 7 6 5 4 0.01
0.02
Ωa Ωa Ωa Ωa Ωa Ωa
= = = = = =
10 LJG 12 LJG 14 LJG 16 LJG 18 LJG 20 LJG
0.03
0.04 (Pa·s) Ωa Ωa Ωa Ωa Ωa
0.05
= = = = =
0.06
22 LJG 24 LJG 26 LJG 28 LJG 30 LJG
Figure 11: Influence of viscosity of drilling mud on the change in axial viscous force.
relationship between average axial viscous force and viscosity of fluid. Therefore, it can be effectively reducing axial viscous friction force by enhancing velocity amplitude of torsional vibration. 4.3.4. Axial Viscous Friction Force Reduction. To analyze viscous friction force reduction, axial viscous friction force and viscous friction torque were compared in time domain. As shown in Figure 12, the viscous friction torque was
Shock and Vibration
Average axial viscous force (N)
4
60
3
50
2
40
1 0
30
−1
20
−2 −3
10
−4
0.14 0.12 0.1 Ffx /FC
5
70
Average axial viscous torque (N·m)
10
0.08 0.06
−5
0 4
4.2
4.4
4.6
4.8
5
0.04
Time (s) 0.02
Figure 12: Viscous force and torque of drilling pipes in time domain.
symmetric distribution about zeros. When absolute value of viscous friction torque was increasing, absolute value of axial viscous friction force would be decreasing. When the torque was approaching zero, the axial viscous friction became the greatest. Therefore, axial viscous friction force reduction was due to torsional motion of drill string decomposed of some axial viscous friction force. This axial force reduction mechanism was benefit for drilling engineering.
10
4.4.2. Effect of ROP and Torsional Vibration Amplitude. In addition to studying the interesting drag reduction of torsional oscillation drilling, an analysis was run to explore the relationship between ROP and the longitudinal friction force, as shown in Figure 14. The frequency of torsional vibration was 5 Hz. ROP was between 1 m/h and 9 m/h with 2 m/h step. The amplitude of torsional oscillation was between 10 rpm and 30 rpm with 2 rpm step. Other simulation parameters were listed in Table 1. The ratio of the axial and Coulomb friction decreased as the torsional oscillation amplitude increased. The reduction rate was remarkable in the region that the amplitude was below 20 rpm, and the downward rate of curves decreased out of that region. The increasing ROP led to a larger axial friction
14
16
18
20 22 Ωa (rpm)
24
26
28
30
f = 0.1 Hz f = 1 Hz f = 10 Hz
Figure 13: Influence of frequency of torsional oscillation on the axial friction due to bristle deformation. 0.45 0.4 0.35
4.4. Friction of Bristle Deformation
0.3 Ffx /Fc
4.4.1. Effect of Torsional Vibration Frequency. The effect of the frequency of torsional oscillation on the axial drag force was discussed in this section. According to the common frequency and amplitude range of torque rocking drilling, 0.1 Hz, 1 Hz, and 10 Hz were selected to analyze the friction reduction in the longitudinal direction. The drill string slide velocity was equal to 0.0025 m/s, corresponding to an ROP of 9 m/h. Other simulation parameters were listed in Table 1. As shown in Figure 12, the force ratio curves of 0.1 Hz, 1 Hz, and 10 Hz were decreased with torsional vibration amplitude increased. The axial sliding friction force overall decreased, as the frequency of torsional vibration increased from 0.1 Hz to 1 Hz. When the frequency of torsional vibration changed from 1 Hz to 10 Hz, the axial friction overall increased. Thus, these were an optimum frequency that the axial friction was the lowest.
12
0.25 0.2 0.15 0.1 0.05 0 10
12
14
d = 1 m/h d = 3 m/h d = 5 m/h
16
18
20 22 Ωa (rpm)
24
26
28
30
d = 7 m/h d = 9 m/h
Figure 14: Influence of amplitude of drill string torsional oscillation on the change in axial friction.
component ratio. The higher axial velocity component of the drill string contributed to a longer length of the bristle projected in the axial direction according the established model (Figure 13). The curve for the transverse friction force and transverse vibration velocity formed a loop that described hysteresis friction. The relationship between the axial friction force and relatively motion velocity had hysteretic properties, as depicted in Figure 15. There is less difference of loops with 1 m/h, 3 m/h, 5 m/h, 7 m/h, and 9 m/h. The major difference was between 0.1 m/s and 0.15 m/s. This was at the balance position. The deformation directions of bristle were reversed
11
200
4000
150
3000
100
2000
50
1000 x (m)
Fy (N)
Shock and Vibration
0
0
−50
−1000
−100
−2000
−150
−3000
−200 −0.15
−0.1
−0.05
0 Vy (m/s)
d = 1 m/h d = 3 m/h d = 5 m/h
0.05
0.1
0.15
−4000 −100
−50
0
d = 1 m/h d = 3 m/h d = 5 m/h
d = 7 m/h d = 9 m/h
Figure 15: Influence of different amplitudes of torsional oscillation on transverse friction.
50
100 150 y (m)
200
250
300
d = 7 m/h d = 9 m/h
Figure 17: Trajectory of general bristle end point projection.
Tiny distinction of tangential force led to larger difference of axial friction in the range of drilling engineering parameters.
70 60
Fd (N)
50 40 30 20 10 0 −0.15
−0.1
d = 1 m/h d = 3 m/h d = 5 m/h
−0.05
0 Vy (m/s)
0.05
0.1
0.15
d = 7 m/h d = 9 m/h
Figure 16: Loop of the axial force of the drill string and relative motion velocity.
in the 𝑦 direction. The greater drag velocity led to a larger hysteresis loop. The distinction of loops was tiny to the drilling engineering. The relationship of axial direction friction and velocity was shown in Figure 16. The curve of each drag velocity also formed a loop. The amplitude of the loop and maximum axial friction resistance increased as the amplitude of torsional oscillation velocity increased. At the maximum velocity, the tangential force rapidly increased and formed peak. Out of range of the maximum velocity, the axial force rapidly decreased and became steady. There were greater peak amplitude and greater steady value with greater drag velocity.
4.4.3. Trajectory of the Bristle Deformation Projection. The trajectory of the bristle projection point was depicted in Figure 17. The bristle deformation directly influences the force exerted on the moving drill string. As Figure 17 shows, ROP was between 1 m/h and 9 m/h with 2 m/h step, and the general bristle end point project motion trajectory was influenced by different velocity amplitudes of torsional oscillation. Shape of trajectory liked a symbol of infinite. However, the trajectory loops of different drag velocities were symmetric with respect to 𝑥 = 0. There were intersection of trajectory near the range of 𝑥 = 0. The number of intersections of trajectory was less with low drag velocity. When drag velocity was above 5 m/h, there were three times of intersection. The trajectory loop was flat and narrow when the drag velocity was low. However, the loop became wider and curved with increase of drag velocity. The up and down ends of loop were toward the back. It was because stiffness coefficient of bristle deformation was greater than value of Gutowski and Leus [12]. When drag velocity was low, bristle can easily deform in the small area. As drag velocity became great, the bristle cannot deform in the larger range. Therefore, loop with greater ROP was bended to back. Meanwhile the loops became wider. Projection position of bristle in 𝑦 direction with time was presented in Figure 18. The trajectories were symmetry with respect to x axial. The curves of different drag velocity were almost superposition. However, the time and position of reversing point with low drag velocity was earlier higher than ones of greater drag velocity. Therefore, the drag velocity mainly influenced peak position of the trajectory in 𝑦 direction. The amplitude of trajectory was lower than amplitude of torsional vibration. It was because the connection point
12
Shock and Vibration 5000
80
0.2
60
0.1
40
0
20
−0.1
Friction force (N)
3000
y (m)
2000 1000 0 −1000 −2000
Torsional velocity (m/s)
4000
−3000 −4000
0 1.6 9.7
d = 1 m/h d = 3 m/h d = 5 m/h
9.75
9.8 9.85 Time (s)
9.9
9.95
−0.2 1.65
1.7
10
d = 7 m/h d = 9 m/h Torsional vibration
Figure 18: Trajectory of bristle projection and drilling pipe torsional oscillation in time domain.
between bristle and drilling pipe was ruptured and rebuilt. Meanwhile, there was obvious hysteresis between trajectory of projection point and trajectory of torsional oscillation. In the area that trajectory of torsional vibration intersected with trajectory of projection point, there was obvious difference of trajectory with different drag velocity. 4.5. Relationship of Torque and Drag. Figure 19 presented friction force in axial direction caused by bristle deformation and viscous fluid in time domain. The viscous friction was followed with torsional velocity. The viscous friction decrease with value of torsional velocity became greater. However, friction force due to bristle deformation fell behind by varied torsional velocity. The pattern of two friction forces was mutually consistent. The levels of two friction forces were close to each other. Figure 20 presented friction torque in axial direction caused by bristle deformation and viscous fluid in time domain. There was also hysteresis between the varied torque caused by bristle deformation and drilling pipe torsional velocity. The value of torque due to bristle deformation increased with the value of friction decrease. There was similar pattern between axial friction force and friction torque caused by bristle deformation. The torque of viscous fluid was obviously lower than ones of bristle deformation.
5. Conclusions Given the microscope, complex, and field-oriented nature of the current rotation and torsional oscillation drill string axial friction resistance, the goal of this paper was to present a simple dynamic friction model based on the discrete LuGre model for the analysis of tribological effects in horizontal well drilling. This model was established on the basis of the average deflection of the general bristle model and considers the viscosity effect of mud. It is superior for describing the
Figure 20: Friction torque of bristle deformation and viscous fluid in time domain.
tribological behavior between the drill string and the rock of the wellbore. A computational program was developed to solve the present model, which was utilized to predict instantaneous general bristle deformation and frictional resistance at the contact surface. The established model was verified using experimental data without adopting a coefficient of vibration transfer. The computational results were consistent with the experimental results. The model can be applied to analyze the frictional resistance of the drill string and wellbore. The parameter sensitivity studies were used to evaluate the effect of the magnitude of the Stribeck velocity and general bristle deformation damp. The results indicated that Stribeck velocity and damp of bristle deformation were not sensitive to friction using the drilling operation parameter.
Shock and Vibration Drilling parameters of general field were adopted to analyze drill string axial and circumferential friction torque using the present model. The amplitude of dynamic shear and viscosity of drilling mud was positively correlated with the drill string axial friction resistance. The drag of drilling pipe also decreased with increase of torsional vibration amplitude. There was an optimal frequency that minimizes axial friction in the range of drilling parameters of general field. The axial friction would increase with increase of ROP. There was the order of magnitudes that the value of axial friction caused by bristle deformation and viscous fluid. The torque caused by bristle deformation was greater than ones of viscous fluid in range of drilling parameters of general field. We introduce this concept into drilling engineering to capture the reality of drill string torque and drag. We can combine the model of conventional drill string mechanics with the discrete LuGre model to forecast proper technology in drilling horizontal wells.
Nomenclature ̃𝑓 : Average of friction torque of bristle deformation and 𝐹 viscous fluid, N ̃𝑓 : Average of friction torque of bristle deformation and 𝑀 viscous fluid, N → 𝑒1 : A unit vector of axial direction of drill string ̃ : Average of friction force of bristle deformation, N 𝑓 𝑑 ̃ 𝑓V : Average of friction force of viscous fluid, N ̃𝑑 : Average of friction torque of bristle deformation, N 𝑚 ̃V : Average of friction torque of viscous fluid, N 𝑚 𝐷𝑤 : Diameter of wellbore, mm 𝐹𝐹 : Dynamic friction force, N 𝐹𝑐 : Coulomb friction force, N 𝐹𝑓𝑥 : Axial direction component of dynamic friction force, N 𝐹𝑓𝑦 : Tangential direction component of dynamic friction force, N 𝐹𝑠 : Static friction force, N 𝑅0 : Outer diameter of drill string, mm 𝑓𝑑 : Friction force of bristle deformation, N 𝑓V : Friction force of viscous fluid, N 𝑚𝑑 : Friction torque of bristle deformation, N 𝑚V : Friction torque of viscous fluid, N V𝑟 : Velocity of relative motion drill string, m/s V𝑟1 : Virtual relative velocity of motion drill string in previous half of time step, 𝜇m/s V𝑟2 : Virtual relative velocity of motion drill string in following half of time step, 𝜇m/s V𝑠 : Stribeck velocity, 𝜇m/s V𝑥 : Axial direction velocity component of motion drill string, m/s V𝑦 : Instantaneous tangential direction velocity component of motion drill string, m/s 𝑥1 : 𝑥 coordinate of end point of bristle projection 𝑀1 , 𝜇m 𝑥2 : 𝑥 coordinate of end point of bristle projection 𝑀2 , 𝜇m 𝑥3 : 𝑥 coordinate of end point of bristle projection 𝑀3 , 𝜇m 𝑦1 : 𝑦 coordinate of end point of bristle projection 𝑀1 , 𝜇m
𝑦 coordinate of end point of bristle projection 𝑀2 , 𝜇m 𝑦 coordinate of end point of bristle projection 𝑀3 , 𝜇m Tangential stiffness of general bristles, N/𝜇m Damp coefficient of general bristles, N/(𝜇m/s) Damp coefficient of mud viscous friction, N/(m/s) The well-hole inner diameter, m The length of drilling pipes, m The outer radius of drilling pipes, m The axial velocity of drilling pipes considering fluid, consist of V𝑥 and mean velocity of fluid, m/s Angle between virtual elastic deformation vector of general bristle and axial direction, rad Angle between elastic deformation vector of general bristle and axial direction, rad Coefficient of drill string eccentric, dimensionless Viscosity of drilling mud, Pa⋅s Dynamic shear of drill string, MPa The rotating angular velocity of drilling pipe, rad/s End point of bristle projection Number of time step in one second, dimensionless 𝑥 coordinate of end point of bristle projection M, 𝜇m 𝑦 coordinate of end point of bristle projection M, 𝜇m Elastic deformation of general bristles, 𝜇m Virtual elastic deformation of general bristles in the calculation time step, 𝜇m Time step, 1𝑒 − 6 s Axial direction relative displacement of motion drill string in one time step, 𝜇m Axial direction relative displacement of motion drill string in one time step, 𝜇m Amplitude of torsional oscillation, rpm Macroscope velocity relative to drilling fluid, m/s.
Additional Points Highlights. An improved discrete LuGre model and method for describing and predicting the friction between a drill string and wellbore rock was established for given downhole conditions. The influence of mud properties and torsional oscillation parameters on the axial and transverse friction resistance was discussed based on the established model.
Conflicts of Interest The authors declare that they have no conflicts of interest.
Acknowledgments This research was sponsored by the National Natural Science Foundation of China (Grant no. 51274171), the Sichuan Province Science & Technology Program (Grant no. 2015SZ0003), and the National Science and Technology Major Project of China (Grant no. 2016ZX05022-01).
References [1] E. Maidla and M. Haci, “Understanding Torque: The Key to Slide-Drilling Directional Wells,” in Proceedings of the IADC/SPE Drilling Conference, Society of Petroleum Engineers, Dallas, Tex, USA, 2004.
14 [2] E. Maidla, M. Haci, S. Jones, M. Cluchey, M. Alexander, and T. Warren, “Field proof of the new sliding technology for directional drilling,” in Proceedings of the 2005 SPE/IADC Drilling Conference - Drilling Technology: Back to Basics, pp. 723–730, February 2005. [3] E. Maidla, M. Haci, and D. Wright, “Case history summary: Horizontal drilling performance improvement due to torque rocking on 800 horizontal land wells drilled for unconventional gas resources,” in Proceedings of the SPE Annual Technical Conference and Exhibition 2009, ATCE 2009, pp. 195–206, October 2009. [4] C. Gillan, S. Boone, G. Kostiuk, C. Schlembach, J. Pinto, and M. LeBlanc, “Applying precision drill pipe rotation and oscillation to slide drilling problems,” in Proceedings of the SPE/IADC Drilling Conference and Exhibition 2009, pp. 53–65, March 2009. [5] M. Urbakh, J. Klafter, D. Gourdon, and J. Israelachvill, “The nonlinear nature of friction,” Nature, vol. 430, no. 6999, pp. 525– 528, 2004. [6] R. Pohlman and E. Lehfeldt, “Influence of ultrasonic vibration on metallic friction,” Ultrasonics, vol. 4, no. 4, pp. 178–185, 1966. [7] S. Matunaga and J. OnodA, “A novel method of friction force reduction by vibration and its application to gravity compensation,” in Proceedings of the 33rd Structures, Structural Dynamics and Materials Conference, Dallas, Tex, USA, 1992. [8] H. Storck, W. Littmann, J. Wallaschek, and M. Mracek, “The effect of friction reduction in presence of ultrasonic vibrations and its relevance to travelling wave ultrasonic motors,” Ultrasonics, vol. 40, no. 1-8, pp. 379–383, 2002. [9] V. C. Kumar and I. M. Hutchings, “Reduction of the sliding friction of metals by the application of longitudinal or transverse ultrasonic vibration,” Tribology International, vol. 37, no. 10, pp. 833–840, 2004. [10] C. C. Tsai and C. H. Tseng, “The effect of friction reduction in the presence of in-plane vibrations,” Archive of Applied Mechanics, vol. 75, no. 2-3, pp. 164–176, 2006. [11] P. Gutowski and M. Leus, “The effect of longitudinal tangential vibrations on friction and driving forces in sliding motion,” Tribology International, vol. 55, pp. 108–118, 2012. [12] P. Gutowski and M. Leus, “Computational model for friction force estimation in sliding motion at transverse tangential vibrations of elastic contact support,” Tribology International, vol. 90, pp. 455–462, 2015. [13] X. Wang, P. Chen, and T. Ma, “a. Modeling and experimental investigations on the drag reduction performance of an axial oscillation tool,” Journal of Natural Gas Science Engineering, pp. 39–118, 2017. [14] A. Mehmood, S. Laghrouche, M. El Bagdouri, and F. S. Ahmed, “Sensitivity analysis of lugre friction model for pneumatic actuator control,” in Proceedings of the 2010 IEEE Vehicle Power and Propulsion Conference, VPPC 2010, September 2010. [15] P. S. M. Dougherty, R. Pudjoprawoto, and C. Fred Higgs, “Bit cutter-on-rock tribometry: Analyzing friction and rateof-penetration for deep well drilling substrates,” Tribology International, vol. 77, pp. 178–185, 2014. [16] J. A. Greenwood and J. B. P. Williamson, “Contact of nominally flat surfaces,” Proceedings of the Royal Society of London A: Mathematical, Physical and Engineering Sciences, vol. 295, no. 1442, pp. 300–319, 1966. [17] A. Majumdar and B. Bhushan, “Fractal model of elastic-plastic contact between rough surfaces,” Journal of Tribology, vol. 113, no. 1, pp. 1–11, 1991.
Shock and Vibration [18] C. Canudas de Wit, H. Olsson, K. J. Astrom, and P. Lischinsky, “A new model for control of systems with friction,” IEEE Transactions on Automatic Control, vol. 40, no. 3, pp. 419–425, 1995. ˚ om, C. Canudas De Wit, M. G¨afvert, and [19] H. Olsson, K. J. Astr¨ P. Lischinsky, “Friction Models and Friction Compensation,” European Journal of Control, vol. 4, no. 3, pp. 176–195, 1998. [20] S. A. Mirhaj, “Evaluation of Shear Forces and Stream-Thrust Forces in Torque and Drag Analysis,” in Proceedings of the SPE Asia Pacific Oil and Gas Conference and Exhibition, Jakarta, Indonesia, 2001. [21] E. Cayeux, H. J. Skadsem, B. Daireaux, and R. Holand, “Challenges and Solutions to the Correct Interpretation of Drilling Friction Tests,” in Proceedings of the SPE/IADC Drilling Conference and Exhibition, The Hague, The Netherlands, 2017. [22] P. Wang, H. Ni, R. Wang, Z. Li, and Y. Wang, “Experimental investigation of the effect of in-plane vibrations on friction for different materials,” Tribology International, vol. 99, pp. 237–247, 2016. [23] M. R. Kermani, R. V. Patel, and M. Moallem, “Friction identification in robotic manipulators: case studies,” in Proceedings of 2005 IEEE Conference on Control Applications, 2005. CCA 2005, pp. 1170–1175, Toronto, Canada, 2005. [24] Y. Yu, Y. Li, and J. Li, “Parameter identification and sensitivity analysis of an improved LuGre friction model for magnetorheological elastomer base isolator,” Meccanica, vol. 50, no. 11, pp. 2691–2707, 2015. [25] H. Dou and Y. Yang, “Further understanding on fluid flow through multi-porous media in low-permeability reservoirs,” Petroleum Exploration and Development, vol. 39, no. 5, pp. 674– 682, 2012. [26] I. Giorgio and D. Scerrato, “Multi-scale concrete model with rate-dependent internal friction,” European Journal of Environmental and Civil Engineering, pp. 1–19, 2016. [27] X. Wang, H. Ni, and R. Wang, “b. Modeling and analyzing the movement of drill string while being rocked on the ground,” Journal of Natural Gas Science Engineering, pp. 39-28, 2017. [28] Z. F. Li, “Fundamental equations and its applications for dynamical analysis of rod and pipe string in oil and gas wells,” Acta Petrolei Sinica, vol. 20, no. 3, pp. 87–90, 1999. [29] T. Piatkowski, “Dahl and LuGre dynamic friction models The analysis of selected properties,” Mechanism and Machine Theory, vol. 73, pp. 91–100, 2014.