potential reliability issues of high powered devices due to excessive .... Therefore, 2s2p thermal test board is a stacked-up of 7 layers that alternates high and ..... frame, as well as the thermal test vehicle recommended by the US JEDEC ... appears quite relevant as well as according with industrial accuracy expected level.
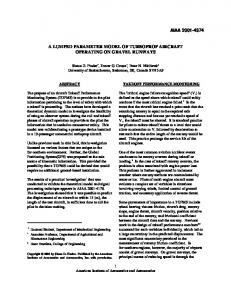
ANALYTICAL MODELING OF MULTI-LAYERED PRINTED CIRCUIT BOARD USING MULTI-STACKED VIA CLUSTERS AS COMPONENT HEAT SPREADER Eric MONIER-VINARD1, Najib LARAQI2, Cheikh Tidiane DIA1,2, Minh-Nhat NGUYEN2, Valentin BISSUEL1 1
2
Thales Global Services, 92366 Meudon la foret Cedex - France Laboratoire Thermique Interfaces Environnement (LTIE), 92410 Ville d’Avray - France
ABSTRACT In order to help the electronic designer to early determine the limits of the power dissipation of electronic component, an analytical model was established to allow a fast insight of relevant design parameters of a multi-layered electronic board constitution. The proposed steady-state approach based on Fourier series method promotes a practical solution to quickly investigate the potential gain of multi-layered thermal via clusters. Generally, it has been shown a good agreement between the results obtained by the proposed analytical model and those given by electronics cooling software widely used in industry. Some results highlight the fact that the conventional practices for Printed Circuit Board modeling can be dramatically underestimate source temperatures, in particular with smaller sources. Moreover, the analytic solution could be applied to optimize the heat spreading in the board structure with a local modification of the effective thermal conductivity layers. Keywords: Analytical PCB Modeling, Effective Thermal Conductivity, Copper Via Impact
1.
Introduction
Electronic components are continuously getting closer to the chip size and require more and more an efficient thermal management to limit the temperature excess to preserve component reliability. For still air conditions, the heat spreading of these miniaturized devices is henceforth done through the surrounding metallic planes of its multilayer Printed Circuit Board. Moreover, initially designed to realize the electrical interconnection through dielectric layer between the various embedded metallic layers, via concept is today used to make chip pad attachment to the high thermal conductive planes of the board. Thus a set of metal planes are connected together from via matrix with the aim to locally create an efficient thermal path to drain the heat in the heart of board structure. Printed Circuit Board has to be considered as the dominant remover of component heat and an accurate three-dimensional prediction of temperature distribution is mandatory for evaluating the temperatures of its sensitive Surfaces Mounted Devices. More than ever, electronic board designers are aware to deliver an optimized board design to eliminate potential reliability issues of high powered devices due to excessive temperature beyond manufacturer limit. The ability to know the sensitivity of component temperatures to the relevant board design parameters, such as the use of thermal vias, is today a crucial stake. Last generation of miniaturized electronic component is reinforcing the need for simulating in thinner details its vicinity board architectures with a minimum of setup, pertinent assumptions and low computation time is henceforth mandatory. Thus the conventional assumptions for electronic board thermal modeling are discussed with the aim to check the pertinence of existing methods and to quantify their inherent uncertainty. For instance, the PCB effective thermal conductivity is a major parameter for electronic thermal analysis so its conventional calculation technique was debated. The present study is based on the use of an analytical thermal model for better discerning the sensitive parameters and managing solution accuracy. The objective of this work is to promote a systematic characterization of the design of electronic boards, at an early stage. Analytical methods are easy to use, effortless to implement, as well as to have no complex meshing or convergence rules to master [1]. So the proposed approach highlights a case in cooling arsenal techniques for spreading heat away from overheated sources. 1
2.
Analytical model and assumptions
The proposed analytical formulation allows fast evaluation of temperature profile of constitutive dielectric or conductive layers of an electronic board under steady state conditions. The cuboids board shape, pictured in Figure 1, is considered cooled by coupled convection and radiation heat exchanges to enable potential infrared measurement validation at laboratory boundary conditions. Like in many conventional studies on PCB thermal behavior, the four lateral edges are assumed to be adiabatic due to their very low thickness. Therefore top and rear surfaces are exposed to a specific uniform heat transfer coefficient according to the Newton's law, named respectively ht and hr. Both coefficients combine convection and radiation effects and allow us to take into account the gravity orientation. Upper source ( xc, yc, zc)
z Layer nl znl = Hb
y
q
x
Layer 1 z1 = t1
Ws
Ls ht Wb Hb hr Lb
Figure 1: Definition of geometric parameters of the analytical model
Thus the heat of the planar source is only transfer through these external surfaces to the ambient, defined as TA. The planar source can be located on upper or lower board external surfaces. Its heat flow rate q is assumed uniform over the source. The board shape is always approximated by a rectangular or a square geometry. Its overall length, width and thickness are respectively defined by Lb, Wb, Hb. Each interface of adjacent layer is considered in perfect thermal contact. The set of equations describing the proposed conduction model and its boundary conditions are summarized below. The subscript letter i is the index to the nl constitutive layers of the electronic board and x, y, z are Cartesian coordinates. If is the difference between the local and the reference temperatures, the generalized steady-state governing equation depends on a set of axial thermal conductivity values, defined by kx, ky or kz: (1)
Edge boundary conditions: (2)
Board's boundary conditions, when the heating source is located on top surface (i = nl): (3)
Board's boundary conditions, for a heating source located on bottom surface (i = 1): (4)
Where u(x,y) and l(x,y) are the prescribed heat flux function of the upper and lower board surfaces. Interlayer temperature continuity and flux conversion boundary conditions: 2
(5)
(6)
The 3D temperature distribution of an upper or lower source location on a PCB has been solved using conventional Fourier series. The final practical solution of the temperature distribution can be written as: (7)
The upper limit M and N of truncated Fourier series depend on accuracy requirements and m or n are non-negative integers. Both relationships of the Fourier coefficient Am and Bn are respectively: (8)
(9)
Where the source length, width and its center location are defined as Ls, Ws, xc and yc. The Kronecker function is brought in the formulae to extend the domain validity to the indeterminate cases when m and/or n are equal to zero using the limit expressions of the equations As m and Bsn. The z-axis thermal profile, , over the cross section depends on the number of layers which are to be scrutinized to properly characterize the thermal behavior of the board. Its definition according to the boundary conditions of the upper or lower heating planar source such as if: The heating source is located on the upper board surface The heating source is located on the lower board surface (10) (11)
With the formulae
and
is given by: (12)
(13)
While the others parameters of the solution are presented in the Appendix A. The exponential equation form was adopted to resolve large dimension ratio between heat source and PCB substrate, a constant issue for analytical thermal modeling approach. The mean temperature of an arbitrary rectangular source of dimensions Ls and Ws, located at xc, yc, zc coordinates, is obtained by integrating both cosine functions over the source region. (14)
Where the average Fourier coefficients are given by: 3
(15)
If several chips are mounted on the different PWB external surfaces, the solution for the temperature distribution may be obtained using the superposition principle. (16)
And the Fourier coefficient Am,j and Bn,j dedicated to each j heating source by: (17)
(18)
3.
Board physical geometries
The board analysis focuses on a high effective thermal conductivity test board with two external signal traces of 50μm and two internal power-ground planes of 35μm. This kind of multiple layers PCB is commonly named 2s2p board in regard of its 4 copper trace layers as shown in Figure 2. The PCB size for the presented study is fixed at 75mm x 100mm x 1.6mm. Top signal layer
z7
j=6
Dielectric insulation layer
z5
j=4
Buried power-ground layer
z3
j=2
Dielectric insulation layer
z1
Bottom signal layer
Figure 2: 2s2p laminated cross section overview
Therefore, 2s2p thermal test board is a stacked-up of 7 layers that alternates high and very low conductive layers. As a consequence, the effective thermal conductivity of this stack up is strongly anisotropic with a high heat spreading capability in-plane and a very poor one in cross-plane. Rightly underneath of top or bottom surface mounted devices, the dielectric thicknesses of the layers 2 and 6 usually lower than 250µm have a major influence on the way the heat is removed. The present investigation deals with board parameters to assess the pertinence of analytical board modeling applied to small heating sources that are representative of copper pads of electronic component. 4.
Effective thermal property calculations
4.1. Continuous copper trace signal layers of the electronics board For a two-constituent PWB material, the thermal property approximation is commonly based on parallel conduction model. Thus, the effective thermal conductivity ke is the weighted arithmetic mean of the thermal conductivities of the dielectric and copper materials. (19)
Where ke, km, kf are respectively the thermal conductivities of the derived equivalent material, the dielectric matrix and the copper filler. Sf and Sm, represent the matrix and filler surfaces and the volume fraction of the filler. Most of the time, in regard of conductivity ratio, the influence of matrix material is negligible and the effective conductivity is directly proportional to copper volume percentage [1] S. Vintrou, N. Laraqi, A. Baïri, 4
Calculation and analysis of thermal impedance of microelectronic structures from analytical models, Solid-State Electronics, 2012,67, 45-52. []. For low copper covering area fraction, this conventional linear rule of mixture model returns a
high thermal conductivity value that is clearly too optimistic for discontinuous and dispersed copper pads of a realistic signal layer of high density electronic board. The assumption of continuous heat conduction in parallel in both solids can be assumed as the upper bound model. 4.2. Discontinuous copper signal layers of the electronic board It occurs that the electrical insulation due to the weak thermal conductivity of dielectric materials acts as a heat-spreading barrier [4]. This one has a major impact on the effective thermal conductivity of the derived compound material. Many theoretical and empirical models have been defined to estimate the thermal conductivity of composite solid mixtures. In our case, the overall thermal conductivity of each layer depends in a complex arrangement on the geometry of the copper traces, disposed in an insulating material. Based on general effective medium theory, the relationship proposed by Bruggeman was considered to estimate the conductivity of dispersed heterogeneous shape particles. (20)
This expression is defined as the lower bound model and is applicable to mixture when neither compound is continuous. By definition, PCBs are complex multi-layered structures in which high thermal conductivity copper layers are sandwiched between low thermal conductivity glass-epoxy layers. Each ilayer has a specific j axial effective thermal conductivity kej,i. Tableau 1 compiles, for 2s2p thermal test board under investigation, the values of the layer thickness, copper covering area factor and effective thermal conductivity derived of upper bound and lower bound models. The thermal conductivities of matrix and filler materials are assumed to be isotropic and respectively fixed at 0.3W.m-1.K-1 for FR4 material and 400W.m-1.K-1 for the copper. Tableau 1: 2s2p multi-layer thermal model data set nli
ti (mm)
j,i (%)
kej,i (W.m-1.K-1) (eq.19)
kej,i (W.m-1.K-1) (eq.20)
7 6
0.050 0.250
15 0
60.3 0.3
0.544 0.3
5
0.035
95
380.
370.
4
0.930
0
0.3
0.3
3
0.035
95
380.
370.
2
0.250
0
0.3
0.3
1
0.050
15
60.3
0.544
These results show that PCBs heat-spreading capabilities depend mainly on both buried power-ground planes (3-5) of board structure. 5.
Calculation Corner
Mathcad® software version 15.0 was used to conduct the analytical model calculations. Its results are defined by the subscript AM, for Analytical Model calculation. To check the performances of the developed analytical model, a set of test cases is compared to the computations given by two electronic cooling software named Icepak® 15.0 (CFD1) and Flotherm® 9.3 (CFD2) as well as for special cases to ANSYS thermal (CFD3). The subscript NM for Numerical Model computation designs their results. 6.
Pertinence of the analytical approach
At first, the purpose is to check its agreement to predict the thermal behavior of each layer of a complex board layout. Both models of effective thermal conductivities calculation are compared as well. 5
The model was submitted to the following laboratory boundary conditions: both upper and lower heat transfer coefficients ( ht, hr ) at 12.2W.m-2.K-1, a reference temperature fixed at T ∞=85°C, a square source of 5mm with its centroid located at (37.5, 55,1.6) mm, an uniform source dissipation of 0.5W, upper limit values of truncated Fourier series are fixed at M=225 and N=300. In practice, the number of terms in the double summation is based on a ratio proportional to a Board Size – Source Size which has to be multiply per an appropriate factor, named “a”. In the current case, the “a” parameter has been fixed equal to 15. (21)
The comparison of the models is done on the local and average temperatures of each board layer considering the planar source location and size. For small sources, this peculiar zone is the most sensitive path for heat spreading throughout the board. Two specific error metrics named Ts and are used to compare the models agreement, as reported in (eq. 23). The numerical results are considered as the reference value. (22)
6.1. Upper bound model Tableau 2 presents the set of results for the studied seven-layer structure and the good agreement that is reached from the proposed analytical approach and both numerical simulations. Two distinct numerical models were created in order to confirm the numerical results. Tableau 2: Cross-plane temperatures of a 2s2p board using upper bound model MATHCAD
CFD1
Layer location
TcAM (°C)
TavAM (°C)
TcNM (°C)
TavNM (°C)
z7 z6 z5 z4 z3 z2 z1 z0
104.8 104.8 95.2 95.2 90.5 90.5 90.3 90.3
101.8 101.8 94.5 94.5 90.5 90.5 90.2 90.2
104.8 104.8 95.1 95.1 90.6 90.6 90.3 90.3
101.9 101.9 94.4 94.4 90.4 90.4 90.3 90.3
(%) 0.1 0.1 -0.4 -0.4 0.1 0.1 0.1 0.1
CFD2 (%) 0.3 0.3 -0.6 -0.6 -0.7 -0.7 -0.2 -0.2
TcNM (°C)
TavNM (°C)
104.8 104.8 95.1 95.1 90.5 90.5 90.3 90.3
101.9 101.8 94.4 94.4 90.4 90.4 90.2 90.2
(%) 0.2 0.3 0.4 0.4 0.3 0.3 0.3 0.3
(%) -0.1 -0.1 0.3 0.2 0.2 0.2 0.2 0.2
The error percentage never exceeds 1% and the maximum temperature divergence is lower than 0.5°C. 6.2. Lower bound model Tableau 3 details the temperatures of the seven-layer structure when a pessimistic model of thermal conductivity calculation is used. Tableau 3: Cross-plane temperatures of a 2s2p board using lower bound model MATHCAD
CFD1
Layer location
TcAM (°C)
TavAM (°C)
TcNM (°C)
TavNM (°C)
z7 z6 z5 z4 z3 z2 z1 z0
116.6 114.8 98.5 98.5 91.6 91.6 91.5 91.5
113.8 112.1 97.2 97.2 91.5 91.5 91.4 91.4
116.9 115.0 98.6 98.6 91.7 91.7 91.6 91.6
113.9 112.2 97.3 97.3 91.5 91.5 91.5 91.5
(%) 0.9 0.6 0.4 0.4 0.2 0.2 0.2 0.2
CFD2 (%) 0.2 0.4 0.9 0.9 0.7 0.7 0.6 0.7
TcNM (°C)
TavNM (°C)
116.4 114.7 98.5 98.5 91.6 91.6 91.5 91.5
113.8 112.1 97.1 97.1 91.5 91.5 91.4 91.4
(%) 0.7 0.4 0.6 0.6 0.4 0.4 0.4 0.7
(%) 0.1 0.1 0.3 0.3 0.1 0.1 0.3 0.1 6
The error percentage remains below 1% and the maximum temperature divergence is lower than 0.5°C. The high accuracy of the promoted analytical approach is resulting of the large number of the upper limits M and N of truncated Fourier series, chosen for the analysis. The comparison of the two tables demonstrates the impact of the choice of upper or lower bound model on the layer temperatures. Using lower bound model, the temperature of the heating source rises of more than 25% corresponding to temperature excess of 12°C.Thus an optimistic calculation of effective thermal conductivities is going to significantly undervalue the maximum temperature encountered at the bottom side of the electronic component. The lower bound model is used in further calculations and its predictions are confronted to numerical simulations. 7. Industrial PCB layer layout Multiple layers PCB with 4 to 16 copper trace layers have become the norm so the analytical model has to be able to quickly estimate the temperature of a heating source on such stack-up architectures. Thus a board structure of 10 copper trace layers, described in Tableau 4, has been computed with the aim to evaluate the consuming time to analyze complex board architectures. The board is made of a symmetrical frame of 6 signal traces (1-5-7-13-15-19) and 4 internal copper planes (3-9-11-17). Tableau 4: Example of a layer layout of an industrial PCB nli 1-19 2-18 3-9-11-17 4-8-12-16 5-7-13-15 6-14 10
j,i (%) 20 0 80 0 20 0 0
ti (mm) 0.050 0.145 0.035 0.150 0.035 0.095 0.140
kej,i (W.m-1.K-1) 0.745 0.3 280 0.3 0.745 0.3 0.3
Tableau 5 displays the result agreement for a source power of 0.5W at laboratory boundary conditions. Tableau 5: Temperature evaluation of a realistic PCB of 19 layers MATHCAD Layer location 5x5
CFD1
TcAM TavAM (°C) (°C)
TcNM (°C)
TavNM (°C)
109.2
109.2
106.9
106.9
CFD2
(%) 0.1
(%) -0.4
TcNM TavNM (°C) (°C) 109.1
107.0
(%) 0.1
(%) -0.4
For a compound electronic board of nineteen sandwiched layers, it can be seen that the maximum error is inferior to 1% and that temperature divergence never exceeds 0.5°C. Moreover, the computation time has been compared between analytical and numerical calculation. Thus the determination of each selected point or area of the board using Mathcad® software can be run in 30 seconds. The vector of the source centered temperatures is computed is less than 25 minutes. At the opposite, the solving of all nodes of the numerical model is achieved in less than 3 hours. 8.
Compact model of multi-layered PCB
It is generally assumed that a multi-layered PCB can be always efficiently represented by one homogenous layer having a couple orthotropic thermal conductivities and similar overall dimensions. If that assumption has the immediate benefit to permit shorter computation time, its influence on temperature prediction is often unknown in particular for small source, our primary concern. j=6 j=4 j=2
Dielectric layer Dielectric layer
t2
z5
Homogenous layer Hb=∑tj
z3 z1
DTM
t2 CTM
Figure 3: Reduction order of multi-layered PCB structure 7
Figure 3 presents the practical concept of a “compact” thermal modeling (CTM) of the board layer layout which is usually applied to an industrial electronic board. As a useful technique [5], its in-parallel (the x and y directions) and in-series (the z direction) effective thermal conductivities are calculated according to formulae: Stack-up of in-series n layers (23)
Stack-up of in-parallel n layers (24)
For two-constituent layer, using in-plane and cross-plane stack-up expressions, the deducted thermal conductivities are respectively: kx = ky = 20.7W.m-1.K-1 and kz = 0.336W.m-1.K-1 for upper bound model kx = ky = 16.5W.m-1.K-1 and kz = 0.323W.m-1.K-1 for lower bound one. As mentioned earlier, these sets of effective thermal conductivities demonstrate that an electronic board is strongly anisotropic. Thus the lower bound model promotes a reduced PCB efficiency to spread the heat in-plane, in peculiar for the closest layer of the heating source. The following Tables show the comparison of the source temperatures for a multi-layered board and a single homogenous layer. The result confrontation is done for previous conditions and the lower bound model is used for the calculations of the effective thermal conductivities. Tableau 6: Comparison of DTM-CTM predictions of the source temperatures
Source (mm2) 2.5 x 2.5 5x5 10 x 10
a) Using Mathcad DTM CTM TcAM TavAM TcAM TavAM (°C) (°C) (°C) (°C) (%) (%) 174.6 162.7 135.2 127.6 -44.0 -45.2 116.6 113.8 111.0 107.2 -17.7 -22.9 99.4 98.1 99.0 97.1 -2.8 -7.6
Source (mm2) 2.5 x 2.5 5x5 10 x 10
b) From CFD1 software DTM CTM TcNM TavNM TcNM TavNM (°C) (°C) (°C) (°C) (%) (%) 175.7 163.1 135.6 127.8 -44.3 -45.2 116.9 113.9 111.3 107.6 -17.6 -21.9 99.9 98.5 99.4 97.4 -3.2 -7.9
c) From CFD2 software DTM CTM TcNM TavNM TcNM TavNM (°C) (°C) (°C) (°C) (%) (%) 172.3 161.6 135.0 127.7 -42.6 -44.0 116.4 113.8 110.7 107.2 -18.1 -22.9 99.3 98.0 98.7 97.0 -4.2 -8.1
All displayed Tables highlight the fact that the conventional practice for modeling PCB has to be carefully handled when the source size is going very small. The compact model returns a significant under evaluation of the temperature of the heating source. 9. Analytical model for board embedded sources When a heating source is located at the interface of the s layer and s+1 layer ( ), the generalized steady-state governing equation need be solved for a new set of boundary conditions. Updated interlayer temperature continuity and flux conversion boundary conditions, for 0 ≤ x ≤ Lb and 0 ≤ y ≤ Wb: (25)
8
(26)
Where e(x,y) is the prescribed heat flux function at the common interface of adjacent layer. The final solution forms of the temperature distribution are similar to previous expressions, only m,n,i(z) has to be replaced by:
(27)
For a random set of interlayer sources (first column of the Table) a comparison of analytical and numerical models was led for the extreme boundary conditions. Tableau 7 presents the new temperatures mapping that is resulting of the evolution of internal boundary conditions (Neumann). The test is performed for an upper square source of 5mm dissipating 0.5W. Tableau 7: Impact of embedded sources on cross-plane temperatures Qi (W)
Layer location
0.5 -0.429 0.429 -0.150 0.150 -0.0031 0.0031 0
z7 z6 z5 z4 z3 z2 z1 z0
MATHCAD TcAM TavAM (°C) (°C) 100.4 98.7 96.6 96.6 93.8 93.8 93.8 93.8
99.3 97.5 95.6 95.6 93.3 93.3 93.3 93.3
CFD1 TcNM TavNM (°C) (°C) (%) 100.8 99.4 -2.3 99.0 97.7 -2.1 96.6 95.6 -0.4 96.6 95.6 -0.4 93.7 93.2 0.8 93.7 93.2 0.8 93.6 93.1 1.7 93.6 93.1 1.5
(%) -1.0 -1.6 -0.4 -0.4 0.8 0.8 1.7 1.6
The prediction of the layer temperatures remains quite relevant and compliant with accuracy rules for early analysis of board design. 10. Cooling gain using thermal via matrix Design of electronic board demands more and more the definition of practical modeling process to quickly evaluate the potential decrease of component temperature of multi-layer PCBs such as thermal via structures use. Conventional PCB thermal attachment of electronic component pad is made of a matrix of Plated Through Hole (PTH acronym) via, having a diameter (D) of 0.3mm at usually 1mm pitch. Via drilled holes are electroplated with a minimum of 25µm copper thickness (δv) throughout via barrel. Figure 4 pictures the additional implementation of thermal via lands that is commonly made to extent it to direct thermal attachment of component pad to power-ground planes. Qs j=6
Source pad
Dielectric layer j=2
z7
v
Buried via matrix
D
Figure 4: Common practice for draining component heat from thermal PTH vias
A full copper land pad is considered rightly beneath the heating source, its thermal conductivity is fixed at 400W.m-1.K-1. The dielectric substance is assumed to fill the remaining hole. The comparison of Tableau 3 and Tableau 8 results allow to quantify the efficiency of a thermal via matrix to limit the source temperature. 9
Tableau 8: Cross-plane temperatures of a 2s2p board using a 5 x 5 thermal via matrix Layer location z7 z6 z5 z4 z3 z2 z1 z0
CFD1 TcNM TavNM (°C) (°C) 95,9 95,7 95,9 95,7 95,5 94,9 95,5 94,9 94,6 94,0 94,6 94,0 94,5 94,0 94,5 93,9
CFD3 TcNM TavNM (°C) (°C) 95,9 95,7 95,9 95,7 95,4 94,8 95,4 94,8 94,6 93,9 94,6 93,9 94,5 93,9 94,5 93,8
Numerous experiments have demonstrated that thermal via land has major impact on the junction-toambient thermal resistance [10]. This JESD51-2’s specific metric of the thermal behavior of the chip is defined by: (28)
Its value indicates the sinking capacity of the total heating power (Q) of the device through all the thermal paths between chip junction (T J) and ambient air (T A). In the spotted case, the source-to-ambient thermal resistance decreases from 63.8°C.W-1 to 21.8°C.W-1 (CFD1) and proves the gain of thermal via clusters to limit excessive temperature. The center temperature of source is efficiently reduced of 20°C. Moreover, the analysis of each layer temperature permits to identify the heat spreading effect of the various stacked via clusters. Therefore the board temperatures in source vicinity are more homogenous and its external opposite surfaces (0-7) are practically submitted to similar constraints. 11. Effective thermal conductivity of thermal via areas The previous fine modeling of the thermal via matrix is commonly substituted by a set of equivalent slabs having specific cross-plane thermal conductivities. The calculation of effective thermal conductivity of PTH via matrix is based on simple network of in series and in parallel thermal resistors. For this application case, the conventional linear rule of mixture model can be applied to determine the thermal properties of a continuous cross-plane structure of aligned thermal via which are buried in dielectric layers. The following relationship formalizes the influence of a matrix of via on the cross-plane thermal conductivity of a simple epoxy resin slab. This last one takes into account the parallel heat spreading of a counted set of dielectric and annealed copper cylinders. (29)
Moreover, the number (nv), the pitch and size of thermal via must be chosen wisely to avoid making some of them useless to spread the heat in the high conductive planes of the board (3-5). Thus considering the defined parameters (D, δv), previous copper and dielectric thermal conductivities and a source square size of 5mm, the cross-plane effective thermal conductivity of the homogenous slab is going to be equal to 2, 3.4 and 8.9W.m-1.K-1, when via numbers are respectively 5, 9 and 25. 12. Practical analytical approach for modeling via clusters impact This section describes a proposed analytical approach for modeling the influence of a local set of slabs having specific cross-plane thermal conductivities. The principle is based on the appliance of appropriate set of positive and negative fictive sources that has been described previously. These ones are applied to the upper and lower interface where the slab is
10
inserted. Figure 5 pictures the additional implementation of the initial analytical model that is defined with the purpose to extent it to direct thermal attachment of component pad to power-ground planes. Qs j=6 j=4 j=2
kej
Qs
z7
z7
–Qj
Copper pad
tj
Buried slab
j=4
Q=0
Dielectric layer
j=2
Dielectric layer
Qj
Figure 5: Concept of analytical modelling of multi-layered localized isotropic cuboid
The main assumption considers that due to very low thermal conductivity of the dielectric layers, 0.3W.m-1.K-1, the in-plane conduction is negligible. So the cross-plane heat flow rate through each slab is supposed constant. By successive iterations a process flow permits to determine a vector of appropriate fictive dissipation that matches the interlayer thermal resistances on each thermal resistance of the set of modified cubes. The fitting criterion for an isotropic slab inserted between zj and zj-1 is given by: (30)
(31)
The comparison of the novel analytical approach to numerical computation of multi-slab model is done for the following conditions: a full copper pad beneath the heating source with an isotropic thermal conductivity of 400W.m-1.K-1, three source-size slabs are taken into account in the dielectric layers (2-4-6), their cross-plane thermal conductivity is fixed at 8.9W.m-1.K-1 corresponding to a 5 x 5 matrix of thermal via, their in-plane thermal conductivity is assumed to be 0.3W.m-1.K-1. Tableau 9 shows the board behavior when a direct thermal attachment of the source to both copper planes (3-5) is considered. Besides Tableau 9 demonstrates that the slab of the layer 2 has a very poor impact on the source heat transfer to PCB structure and can be neglected to accelerate the source temperature calculation. The results confirm the assumption of the weak influence of in-plane conduction of the low-conductivity dielectric layer of the board. The agreement of both models demonstrates that it seems possible to take into account the presence of various thermal conductivity areas in an analytical approach using a technique based on a set of buried heating sources. Tableau 9: Impact of source-size slabs on cross-plane temperatures Layer location z7 z6 z5 z4 z3 z2 z1 z0
MATHCAD TcAM TavAM Qi (°C) (°C) (W) -0.496 0.017 0.479 -0.218 0.218 -0.0039 0.0039 0
96.2 96.2 95.7 95.7 94.8 94.8 94.8 94.8
95.3 95.3 94.8 94.8 94.1 94.1 94.1 94.1
TcNM (°C) 95.7 95.7 95.3 95.3 94.5 94.5 94.5 94.5
CFD1 TavNM (°C) (%) 95.4 4.8 95.4 4.8 94.8 3.6 94.8 3.6 93.9 2.9 93.9 2.9 93.9 2.8 93.9 2.7
(%) -0.7 -0.7 0.3 0.3 2.1 2.1 2.0 1.9
Moreover the comparison of Tableau 3 and Tableau 9 highlights the relevance of the practical analytical approach to accurately evaluate the temperature of the source for a realistic case. The predicted source-to-ambient thermal resistances are respectively 21.2°C.W-1 and 21.4°C.W-1. 11
Eventually, the analytical model allows weighting quickly the potential gain of large via number, such as 25, in order to select appropriate set of thermal via clusters in source vicinity. Using that practical approach, the electronic designers will be able to early analyze the limits of the power dissipation of miniaturized devices at laboratory conditions. 13. Conclusion A developed analytical model has been applied to estimate the temperature distribution of each layer of a set of industrial board frame, as well as the thermal test vehicle recommended by the US JEDEC Standard JESD51-7 to characterize the thermal performances of electronic component. Numerous comparisons for a set of parameters have been done with electronics cooling software to evaluate the pertinence of an analytical model for rugged ambient conditions. The agreement of the analytical model appears quite relevant as well as according with industrial accuracy expected level. Besides, the presented work highlights the fact that the concept of Compact Thermal Model for PCB can be very erratic, in particular when the size of the source is below 5 millimeters. Further the optimization of the conductive paths from the sensitive thermal surfaces of the package to the PCB is mandatory for the long-term survival of the device. Therefore a novel practical technique is defined to quickly quantify the potential benefit of a set of via placed just under the land pad of electronic component. The proposed model allows a local modification of the effective thermal conductivity of dielectric or external signal layers in order to optimize the component heat spreading in the board structure, our permanent objective.
Nomenclature Am, Bn G i j M, N nl
Fourier coefficients thermal conductance, W. K-1 layer identification heating source identification Fourier series truncation limit layers numbers
ht, hr Lb, Wb, Hb Ls, Ws, Hs t xc, yc
ns R T
heating sources numbers thermal resistance, K.W-1 temperature, K
CCAF CTM, DTM
T Qs qs ke kx, ky, kz
reference temperature, K heating power, heat flow rate of source, W heat flux density of source, W.m-2 effective thermal conductivity, W.m-1.K-1 isotropic thermal conductivities, W.m-1.K-1
heat transfer coefficient, W.m-2.K-1 PCB dimensions, m source dimensions, m layer thickness, m center location of heating source, m
Acronyms Copper Covering Area Factor Compact or Detailed Thermal Model
Greek symbols volume fraction of filler temperature excesses T(x,y,z) – T, K z-axis thermal profile Kronecker function
Reference [1] S. Vintrou, N. Laraqi, A. Baïri, Calculation and analysis of thermal impedance of microelectronic structures from analytical models, Solid-State Electronics, 2012,67, 45-52. [2] R. Lopes Costa, V. Vlassov, Evaluation of Inherent Uncertainties of the homogeneous Effective thermal Conductivity Approach in Modeling of Printed Circuit boards for Space Applications, Journal of Electronics Cooling and Thermal Control, 3 (2013), pp. 35-41. [3] P. Karayacoubain, M.M. Yovanovich, J.R. Culham, Thermal Resistance Based Bounds for Effective Conductivity of Composite Thermal Interface Materials, Proceedings 22nd IEEE Semiconductor Thermal Measurement and Management Symposium, Dallas (Texas), USA, 2006, Paper No. 1-4244-0154-2 [4] R. Kotetov, T. Andritsch, U. Lafont, Thermal Behaviour of Epoxy Resin Filled with High Thermal Conductivity Nanopowders, Proceedings IEEE Electrical Insulation Conference, Montreal, Canada, 2009. [5] Y. Shabany, Component size and effective thermal conductivity of Printed Circuit Board, Inter Society Conference on Thermal Phenomena, 2002.
12
[6] John N. Funk, M. Pinar Mengüç, Kaveh A. Tagavi, Clifford J. Cremers, A Semi-Analytical Method to Predict Printed Circuit Board Package Temperature, IEEE Transaction obn components, hybrids and manufacturing technology, vol 15, No. 5, 1992. [7] R. Schacht, B. Wunderle, D. May, B. Michel, H. Reichl, Modeling Guidelines and Non-Destructive Analysis for Thermal and Mechanical Behaviour of Via-Structures in Organic Boards, Thermal and Thermo-mechanical Phenomena in Electronic Systems Conference, 2008, 441-449. [8] E. Monier-Vinard, N. Laraqi, C. T. Dia, M. N. Nguyen, V. Bissuel, Analytical Thermal Modeling of Multi-Layered Active Embedded Chips into High Density Electronic Board, Thermal Science, 17 (2013), 3, pp. 695-706. [9] J. Devoe, A. Ortega, An Investigation of Board Level Effects on Compact Thermal Models of Electronic Chip Packages, Proceedings 18th IEEE Semiconductor Thermal Measurement and Management Symposium, San Jose, USA, 2002, Paper No. 07803-5624-5. [10] M. Brizoux, A. Grivon, W. C. Maia Filho, E. Monier-Vinard, J. Stahr, M. Morianz, Industrial PCB Development Using Embedded Passive and Active Discrete Chips Focused on Process and DfR, Proceeding of IPC APEX Conference, Las Vegas , USA, April 2010. [11] Yuri S. Muzychka, Kevin R. Bagnall and Evelyn N. Wang, Thermal Spreading Resistance and Heat Source Temperature in Compound Orthotropic Systems With Interfacial Resistance, IEEE Transactions on Components, Packaging and Manufacturing Technology, Vol. 3, No. 11, November 2013. [12] N. Rinaldi, Generalized Image Method with Application to the Thermal Modeling of Power Devices and Circuits, IEEE Transactions on Electron Devices, Vol. 49, No. 4, April 2002. [13] Y. S. Muzychka, J. R. Culham, M. M. Yovanovich, Thermal Spreading Resistance of Eccentric Heat Sources on Rectangular Flux Channels, Vol. 125, June 2003. [14] J. Richard Culham and M. Michael Yovanovich, Factors Affecting the Calculation of Effective Conductivity in Printed Circuit Boards, 1998 Intersociety Conference on Thermal Phenomena, 1998. [15] Y.S.Muzychka, M.M. Yovanovich and J.R.Culham, Influence of Geometry and Edge Cooling on Thermal Spreading Resistance, Journal of Thermophysics and Heat Transfer, Vol.20, No.2, April – June 2006.
Appendix A
(A.1)
(A.2) (A.3) (A.4) (A.5) (A.6) (A.7) (A.8) (A.9) (A.10) (A.11)
13