Modeling Management Information Systems’ Success: a study in the domain of Further Education and Training Mariette Visser
Judy van Biljon
Marlien Herselman
Human Sciences Research Council (HSRC) Private Bag X41, Pretoria, 0001 +27 72 607 5009
University of South Africa (UNISA) PO Box 392, Pretoria, 0003 +27 82 253 4327
Council for Scientific and Industrial Research (CSIR) PO Box 395, Pretoria, 0001 +27 82 809 4319
[email protected]
[email protected]
[email protected]
ABSTRACT
1.
Capacity in and enhancement of critical, scarce and intermediate skills are seen as a national priority in South Africa. The Department of Higher Education and Training (DHET) in South Africa has prioritized the success of the Further Education and Training (FET) sector to meet this need for capacity development in critical, scarce and intermediate skills. Management information systems (MIS) are pivotal in the efficient and effective running of FET colleges. Therefore, the evaluation of MIS success is an essential spoke in the wheel of FET college success. The problem is that no MIS success evaluation model for FET colleges could be found. In this paper, we describe the development and testing of an evaluation model and tool for MIS success. Information system’s evaluation theory and an analysis of FET policy documents were used to propose an initial success evaluation model and tool (questionnaire) for an educational environment (FET colleges) in South Africa. Using a quantitative approach the tool was applied in a survey at one public FET college to evaluate the success of the MIS deployed at the college. Findings from the survey lead to the refinement of the model which is also articulated in this paper and reflected as the SAFETMIS model. The paper is novel in proposing an IS theory based model and tool which can be used to evaluate MIS success at FET colleges and similar education contexts. The paper should be of interest to researchers in the field of Information Systems success evaluation and also to practitioners and managers in the field of Education.
The public FET college sector in South Africa has endured extensive changes over the past two decades. New policies have been implemented and legislation promulgated to create a framework for transformation in this sector. In 2001 a new institutional landscape was proposed that lead to the merging of 152 Technical Colleges (as these types of institution were called) into 50 multi-campus FET colleges. In the national plan of 2008 for FET colleges, the National Department of Education has committed to the establishment of a standardized business MIS in all public FET colleges that will enable colleges to monitor and account for all their administrative business processes, which include: student, academic, and financial administration, human resource management and development, and asset management [8, 9]. The planned integrated MIS has been implemented at eleven public FET colleges thus far. The implementation of the college mergers has been accompanied by challenges related to the substantive integration of college business systems and processes [2]. In a recent audit of programmes at public FET colleges it was found that very few colleges had taken steps to integrate their administrative, management, IT and communication systems [4]. The challenge is, therefore, to establish administration systems, information technology infrastructure and MISs to ensure the full merger of all information functions at the various sites and align their delivery towards the new FET college mission and mandate [8]. The monitoring and evaluation of key success indicators is not only essential for the management of a specific FET college, but is also of critical importance for the DHET to evaluate its own successes. The problem is that no documented evaluation model or tool to evaluate the success of MIS at public FET colleges in South Africa could be found.
Categories and Subject Descriptors H.5.3 [Information Systems]: Group and Organization Interfaces – evaluation/methodology.
INTRODUCTION
This study constructs a conceptual model that informs the design of an IS success evaluation tool by using the knowledge and trends in the field of information systems success evaluation and taking into account the requirements of South African policy with regard to the administration and functioning of public FET colleges. The study is organized as follows. In section 2 a brief review of information systems’ evaluation models is presented. An initial MIS evaluation model for FET colleges is proposed as a point of departure. In section 3 the research design is discussed and in section 4 results and findings of the study are presented. The final, refined conceptual model of the study is also provided in section 4, and concluding remarks are presented in section 5.
General Terms Management, Measurement, Performance, Design.
Keywords Information system success; Management Information Systems; Information Systems success evaluation; FET college; Construct measurement; D&M IS success model. Permission to make digital or hard copies of part or all of this work for personal or classroom use is granted without fee provided that copies are not made or distributed for profit or commercial advantage and that copies bear this notice and the full citation on the first page. Copyrights for components of this work owned by others than ACM must be honored. Abstracting with credit is permitted. To copy otherwise, to republish, to post on servers or to redistribute to lists, requires prior specific permission and/or a fee. SAICSIT '12, October 01 - 03 2012, Pretoria, South Africa Copyright 2012 ACM 978-1-4503-1308-7/12/10…$15.00.
384
2. 2.1
The motivation for this decision is presented in section 2.2.
LITERATURE REVIEW Success evaluation models
2.2 Motivation for the selected base model for this study
Specialized literature defines evaluation as a type of research that applies social science procedures to assess the conceptualization, design, implementation and utility of social intervention programmes [20]. It is generally accepted in the literature that evaluation studies have three main purposes: to judge merit or worth, to improve programmes and to generate knowledge [16].
A number of studies have been conducted to validate the D&M model. Seddon and Kiew [28] examined the relationships among four of the constructs and found significant support. Rai, Lang and Welker [25] compared the original D&M model [6] to the respecified D&M IS success model created by Seddon [27] and found that the original model stood up reasonably well to the validation attempt and outperformed the Seddon model. Sedera, Gable and Chan [29] also tested several success models, including the D&M and Seddon models, against empirical data and determined that the D&M model provided the best fit for measuring enterprise systems success [23]. McGill, Hobbs and Klobas [19] examined the full D&M IS success model and found that the model provided strong support for the relationships between perceived system quality and user satisfaction, perceived information quality and user satisfaction, user satisfaction and intended use, and user satisfaction and perceived individual impact. Thus, the overwhelming evidence in the international literature on the strength of the D&M IS success model lead to the decision to base the model for this study on D&M’s IS success model.
The most commonly used theories on which IS success evaluation models are based are: the theory of reasoned action; the theory of planned behavior; the theory of beliefs and attitudes; the behavioral theory of the firm; and the mathematical theory of communications, while the most frequently used models to evaluate IS success are [37]: • • • •
the DeLone and McLean IS success model (D&M IS Success Model); the Technology Acceptance Model (TAM); the Task-Technology Fit model (TTF); and the End User Computing Satisfaction model (EUCS).
Many researchers in the field of IS success evaluation have conducted empirical studies based on portions, combinations or extensions of these models [3, 13, 15, 21, 22, 24, 25, 27]. The synthesis of models and their underlying theories is presented in Table 1. As illustrated in Table 1, IS success models are based on either one or a combination of theories. This raised the question: which model, extension, or combination will be suitable for this study? Eight models namely, the Technology Acceptance Model (TAM) with its extensions (TAM2, UTAUT, TAM3), the Wixom and Todd model, the Task-Technology Fit (TTF) model, the original Delone and Mclean (D&M) IS success model, the updated Delone and Mclean (D&M) IS success model, the Model of User Satisfaction, the Re-specified Model of IS success, and the End User Computing Satisfaction model (EUCS) were studied in more detail in order to make an informed decision in this regard.
In addition, evidence of the application of the updated D&M IS success model in South African research was found. Twine and Brown [31] conducted interpretive research by using categories within the updated D&M IS success model as a lens to investigate the effectiveness of web conferencing systems. A further justification for the use of the D&M IS Success model is the recommendation of Roseman and Vessey [26]. In their study of the role of applicability checks in the relevance of IS research, they allude to this model as being highly relevant for practical application. Only the three models namely the Original D&M IS Success Model, the Updated D&M IS Success Model, and the End User Computing Satisfaction Model which were selected as most appropriate and integrated to develop the proposed conceptual model for this study will be described in sections 2.3 to 2.5.
The Original D&M IS Success Model, the Updated D&M IS Success Model, and the End User Computing Satisfaction Model were selected as most appropriate and integrated to develop the proposed conceptual model for this study.
Table 1. Most commonly utilized information systems success evaluation models and their underlying theoretical frameworks Year: Theory
Theory developed by
Theory
1934
LaPiere, R.T. – Evidence in the literature of the link between attitudes and behaviors [17]
Led to the formulation of the theories of reasoned action and planned behavior
1975
Fishbein and Ajzen [12]
Theory of Reasoned Action, Theory of Planned Behavior
Name of the model based on theory
Technology Acceptance Model [5]
Model abbreviation
TAM
Technology Acceptance Model 2 [33] TAM2 Unified Theory of Acceptance and Use of Technology [34]
385
UTAUT
Model developed by:
Davis F.D., Bagozzi R.P., Warshaw P.R. Venkatesh, V., Davis, F.D. Venkatesh, V., Morris, M.G., Davis, F.D., Davis, G.B.
Year: Model
1989 2000
2003
Technology Acceptance Model 3 [32] TAM3
1963
Cyert and March
1963
Task Technology Fit Model [14]
TTF Model
TAM/TTF Model with Computer Self-Efficacy [10]
Combined TAM/TTF Model
Development of a Tool for Measuring Behavioral Theory of and Analyzing Computer User the Firm Satisfaction [1] The Measurement of End-User Computing Satisfaction [11] Integration of the concept theories; 'Beliefs and attitudes Integration of the User satisfaction about the system' with literature and the Technology 'Beliefs and attitudes Acceptance Model [36] about using the system'
Venkatesh, V., Bala, H. Goodhue, D.L., Thompson, R.L. Dishaw, M.T., Strong, D.M., Bandy, D.B.
2008 1995 2002
CUS
Bailey, J.E., Pearson, S.W.
1983
EUCS
Doll, W.J., Torkzadeh, G.
1988
Integration of User Wixom, B.H., Satisfaction (US) Todd, P.A. and TAM
2005
1949
Shannon and Weaver [30]
Expanded Shannon & Weaver's Mathematical Theory theory by extending 'effectiveness of Communications level' into three categories
Expanded Mathematical Theory of Communications
Mason, R.O.
1978
1978
Mason [18]
Expanded Delone and McLean IS Success Mathematical Theory Model [6] of Communications
D&M IS Success Model
Delone, W.H., McLean, E.R
1992
Seddon, P.B., Kiew, M. Y
1996
Seddon, P. B.
1997
Delone, W.H., McLean, E.R
2003
Extended D&M IS Extension of the Delone and McLean Success Model IS Success Model combined with the combined with Technology Acceptance Model [28] TAM Re-specification and extension of the Partial behavior DeLone and McLean Model of IS model of IS Use Success [27] Updated Delone and McLean IS Updated D&M IS Success Model [7] Success Model
2.3
influence on the recipient and organizational impact was the influence of the information on the system. A diagram illustrating the development of the original D&M IS success model from the theory of communication is given in Figure 1.
Original D&M IS success model
The original DeLone and McLean taxonomy was based on Richard Mason’s modification of Shannon and Weaver’s [30] mathematical theory of communications which identified three levels of information: • • •
the technical level (accuracy and efficiency of the system that produces it) the semantic level (its ability to transfer the intended message) the effectiveness level (its impact on the receiver) [30].
Mason adapted this theory for IS and expanded the effectiveness level into three categories: receipt of information, influence on the recipient, and influence on the system [18]. DeLone and McLean identified categories for IS success by mapping an aspect of IS success (found in literature reviews of seven sources which included a 100 empirical studies) to each of Mason’s effectiveness levels [6]. This analysis yielded six variables of success: system quality, information quality, use, user satisfaction, individual impact, and organizational impact.
Figure 1. Categories of IS success adapted from D&M [6] DeLone and McLean developed their initial taxonomy using established theories of communication adapted to IS. These theories suggested that the flow of information was linear; however, they proposed that, for IS, these different measures of success were independent, but that there was interdependency among them [6]. Figure 2 shows the original D&M IS success model.
System quality was equivalent to the technical level of communication, while information quality was equivalent to the semantic level of communication. The other four variables were mapped to Mason’s sub-categories of the effectiveness level. Use related to Mason’s receipt of information; user satisfaction and individual impact were associated with the information’s
386
Figure 2. D&M Initial IS success Model [6]
2.4
Updated D&M IS success model
Based on further research the original D&M IS success model was updated to the model shown in Figure 3. A key addition of the updated model was to include service quality as an aspect of IS success [31]. This reflects the changing nature of IS which also needed to assess service quality when evaluating IS success. DeLone and McLean recommended assigning different weights to system quality, information quality and service quality, depending on the context and application of the model [31]. DeLone and McLean [7] also note that since the impacts of IS have evolved beyond the immediate user, additional IS impact measures, such as work group impacts, inter-organizational and industry impacts, consumer impacts and societal impacts should be considered. Accordingly, they grouped all the impact measures into a single impact or benefit category called net benefits.
Figure 4. A Model for measuring End-user Computing Satisfaction [11]
2.6
The proposed theoretical model for this study, as depicted in Figure 5, comprises a combination of three models: the original D&M IS Success Model, the updated D&M IS Success Model and the End-User Computing Satisfaction Model. The proposed theoretical model was used to develop the evaluation tool (survey questionnaire) for evaluating the MIS of the selected public FET college [35].
Figure 3. D&M updated IS success Model [7]
2.5
Initial model proposed for this study
The conceptual model for this study was constructed by extending the original D&M IS success model to include an additional construct, service quality, which is part of the updated D&M IS success model. Since all users of the system, which was intended to be evaluated, are obligated to use the system, the construct of intention to use was omitted. It was furthermore decided to extend the user satisfaction construct in the original D&M IS success model by incorporating the End User Computing Satisfaction Model.
EUCS Model
MIS Success Evaluation Model
Doll and Torkzadeh [25] investigated end-user computing satisfaction by contrasting traditional versus end-user computing environments and developed an instrument which merges ease of use and information product items to measure the satisfaction of users who interact with a specific application. Figure 4 provides an illustration of the model, a list of questions used and the identified underlying factors or components of end-user computing satisfaction acquired by factor analysis (Content, Accuracy, Format, Ease of use, and Timeliness).
Figure 5. Proposed MIS Success Evaluation Model
387
available at [35]. Each MIS success evaluation construct was generated by calculating the mean of the underlying items for each participant. The proposed conceptual model should therefore be studied in conjunction with the effectiveness measures included in the evaluation tool (questionnaire).
In order to design and develop an evaluation tool (survey questionnaire), effectiveness criteria to measure each of the six main evaluation constructs namely: information quality, service quality, systems quality, user satisfaction, individual impact and organizational impact were investigated as described in section 3.2. The developed model and tool were empirically tested on one public FET college in SA and the results of the testing are presented in section 4.
3.
4.
RESEARCH DESIGN
A pragmatic, interpretive and post-positivist philosophical paradigm was implemented. After the literature analysis on IS success evaluation and FET policy documents, the quantitative data was gathered through a survey strategy by using a purposive designed questionnaire. The section in the questionnaire on success evaluation of the MIS, comprising forty-two questions, is composed of questions that were selected and adapted from standardized IS success evaluation questionnaires found in the literature, which have previously been empirically tested [35]. The business management information system at the selected public FET college is the application context.
3.1
4.1
Profile of MIS users
The gender distribution of the respondents was almost equal with 58% (or 94 participants) being female and 42% (or 69 participants) male. Fifty-two percent of the participants were lecturing staff, 37% support staff and 11% management staff. The mean age of all participants was 35, with just over half the participants being younger than 35 years (56%). The average ages of support, lecturing and management staff was 31, 36 and 44 years respectively. More than half of the participants (57%) had a diploma or occupational certificate as their highest academic qualification. This is not surprising, since FET colleges focus primarily on offering vocational education. One of the distinct findings of the study was that the majority (81%) of MIS users at public FET College X perceived themselves to have above average to excellent computer proficiency skills.
Population and sampling
Two sampling frames were involved in the study, namely the population of all public FET colleges (50 in total) and the population of MIS users at the selected public FET college. A non-probability sampling technique was employed on the first sampling frame for the selection of the public FET college. One public FET college was purposively sampled to represent a benchmark for the FET sector. It was decided to select one of the top performing public FET colleges for application of the proposed evaluation model. Another condition for selection was that the FET college should be one of the eleven public FET colleges in which the new integrated MIS of DHET has been implemented, since all public FET colleges will eventually use this MIS system. Hence, the selected college, FET College X, (called FET College X according to confidentiality agreement) has been purposefully selected on those criteria and also since this specific college was proposed by the head of the FET unit at the DHET.
4.2
Statistical analyses
The data analysis provided evidence for adaptations and extensions to the proposed theoretical model. Before each construct variable was calculated, tests for internal consistency and scale reliability (Cronbach’s alpha) and unidimensionality (Principal Component Analysis (PCA)) were done. Principle component analyses were carried out on all constructs (indicators) to illustrate unidimensionality in the underlying variables, i.e. the items in the questionnaire. The results of the PCA on each success evaluation construct are depicted in Tables 2 to 7 in the Appendix and explained below.
One of the eventual aims of the new integrated MIS is that all college staff should have access to and use the system on a daily basis for academic, administrative and management purposes. At the time of the survey, 163 staff members at FET College X were already using the MIS as part of their daily activities. The average system usage duration per staff member has reportedly been between one and two years. The entire population of the second sampling frame, the total number of MIS users (N=163 participants) at the selected public FET college participated in the survey, hence a 100% response rate was achieved.
3.2
RESULTS AND FINDINGS
This section presents the results of the survey by firstly giving a brief description of the biographical characteristics of the MIS users; secondly by motivating changes to the initial conceptual model and thirdly by providing summary results on the measurements of the different IS success evaluation constructs.
4.2.1
Individual impact (indi)
Tables 2a and 2b illustrate that one component, which explains 78,528% of the total variance in the sample, is extracted, showing that the five items used to create indi are unidimensional. Furthermore, all items load highly (above 0.8 factor loadings) to this component as depicted in Table 2b.
4.2.2
Information quality (infq)
Tables 3a and 3b show that a PCA extracted two components from the eleven items that underlie infq; these were named outpq (output quality) and dataq (data quality). Together, these two components explain 74.478% of the total variance in the sample. The rotated component matrix (Table 3b) depicts high factor loadings – factor loadings less than 0.6 were excluded from the analysis.
Questionnaire design
The final questionnaire consists of four sections that respectively cover questions on: identification and consent, employment information, MIS evaluation, and personal information. The section in the questionnaire which investigates the evaluation of the MIS was developed by adapting and selecting questions from four standardized empirically tested questionnaires found in the literature [11, 13, 15, 21]. That section consists of forty-two items that were presented in a frequency-of-use Likert rating scale format in terms of which participants had to rate each item on a scale of 1 to 5, where 1 equals almost never; 2 equals some of the time; 3 equals about half of the time; 4 equals most of the time; and 5 equals almost always. The developed questionnaire is
4.2.3
System quality (sysq)
Tables 4a and 4b illustrate that the PCA extracted two components from the twelve items that underlie sysq, which were named: eof (ease of functioning) and eoa (ease of access). Together these two components explain 65.998% of the total variance in the sample. The rotated component matrix (Table 4b) depicts high factor loadings.
388
4.2.4
The following changes to the initial conceptual model were suggested by these tests as illustrated in Tables 2 to 8 and graphically presented in Figure 7:
Service quality (serq)
Tables 5a and 5b illustrate that one component which explains 79.444% of the total variance in the sample is extracted with PCA, showing that the five items used to create serq are unidimensional. Furthermore, all items load highly (above 0.8 factor loadings) to this component.
4.2.5
the construct information quality has two underlying components namely: data quality and output quality;
•
the construct system quality has two underlying components namely: ease of access and ease of functioning;
•
the tests furthermore revealed that the construct user satisfaction consists of three instead of five underlying components namely: ease of use, content and format.
Organizational impact (orgi)
Tables 6a and 6b illustrate that one component which explains 72.329% of the total variance in the sample is extracted, showing that the eight items used to create orgi are unidimensional. Furthermore, all items load highly (above 0.8 factor loadings) to this component.
4.2.6
•
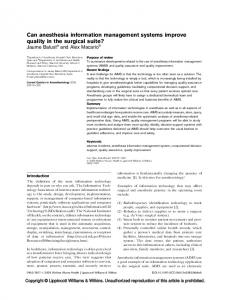
The adapted and extended SA-FETMIS success evaluation model is depicted in Figure 7.
End-user computing satisfaction (eucs)
Tables 7a and 7b show that PCA extracted three components which were named eou (ease of use), con (content) and for (format). This finding, of three underlying components instead of five as proposed in the theoretical model, suggests a very important adaptation to the proposed theoretical model. The proposed theoretical model suggests five first-order variables: eou (ease of use), con (content), acc (accuracy), tim (timeliness), and for (format) for the construct end-user computing satisfaction (eucs), whereas the analysis in Tables 7a and 7b of the data for FET College X shows that the thirteen underlying items of eucs grouped into three underlying components. Together these three components explain 73.749% of the total variance in the sample.
v15a1 v15a2
indi v15a3 v15a4 v15a5 v15b1 v15b2 v15b3
dataq
v15b4 v15b5
infq
v15b6 v15b7 v15b8 v15b9
outpq
v15b10 v15b11 v15c1
The scale reliability, as calculated for the success evaluation indicators, is discussed in the next section and then the adjusted and extended theoretical model is presented as the SA-FETMIS success model.
v15c2
v15c5 v15c6 v15c7
v15c9 v15c10 v15c11 v15c12 v15c13 v15c14
serq v15c15 v15c16 v15c17 v15d1 v15d2 v15d3 v15d4
•
System quality (sysq), was created by calculating the mean of twelve items;
•
Service quality (serq), was created by calculating the mean of five items;
•
Organizational impact (orgi), was created by calculating the mean of eight items;
•
End-user computing satisfaction (eucs), was created by calculating the mean of thirteen items;
•
Overall IS success (bmseval), was created by calculating the mean of fourty-one items that were used to create indi, infq, sysq, serq, orgi, and eucs.
orgi
v15d5 v15d6 v15d7 v15d8
Individual impact (indi), was created by calculating the mean of five items; Information quality (infq), was created by calculating the mean of eleven items;
eof
v15c8
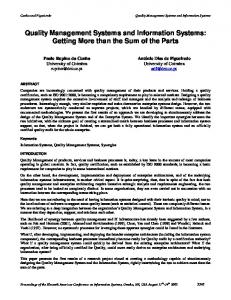
The scale reliability statistic was calculated for all first-, secondand third-order factors (success evaluation indicators) and the results are provided in Table 8 in the Appendix. Evidently, all success evaluation indicators have high internal consistency with all Cronbach’s alpha values higher than 0.7. A structural representation of the construction of IS success evaluation indicators is presented in Figure 6. Each construct as depicted in the conceptual model (Figure 6) was evaluated by using the ratings of all the MIS users on a number of items and were calculated as follows:
•
bmseval
sysq
v15c4
4.2.7 Scale reliability statistic (Cronbach’s Alpha) testing
•
eoa
v15c3
v15c1, v15c2, v15c10
eou
v15b2, v15b3, v15b4, v15b5, v15c5
con
v15b7, v15b8, v15b9, v15b10, v15b11
for
eucs
Figure 6. Structural representation of the construction of IS success evaluation indicators for this study
389
[3] Chow, W.S. 2004. An Exploratory Study of the Success Factors for Extranet Adoption in E-Supply Chain. Journal of Global Information Management. 12(4), 60. [4] Cosser, M., Kraak, A. and Winnaar, L. 2011. Further Education and Training (FET) colleges audit, May-July 2010: National Profile of the FET college sector. Unpublished client report. Human Sciences Research Council: Pretoria. [5] Davis, F.D., Bagozzi, R.P. and Warshaw, P.R. 1989. User Acceptance of Computer Technology: A Comparison of Two Theoretical Models. Management Science. 35, 982-1003. [6] DeLone, W. and McLean, E. 1992. Information Systems Success: The Quest for the Dependent Variable. Information Systems Research. 3(1), 36. [7] DeLone, W.H. and McLean, E.R. 2003. The DeLone and McLean Model of Information Systems Success: A Ten-year Update. Journal of Management Information Systems. 19(4), 9-30.
Figure 7. Conceptual model for evaluation of MIS success at public FET College X – The SA-FETMIS success model
5.
[8] Department of Education. 2008. National Plan for Further Education and Training Colleges in South Africa. Department of Education: Pretoria.
DISCUSSION AND CONCLUSION
This study investigated the evaluation of MIS success at public FET colleges in SA based on internationally developed models and tools from the literature on IS success evaluation. Quantitative data was captured and analyzed to test the proposed model, including the composition of the constructs as illustrated in this paper. The paper makes two theoretical contributions. Firstly, the comprehensive comparison of information systems success evaluation models from which the initial model was synthesized. Secondly, the SA-FETMIS success model which is supported by the survey tool (as developed and tested in this study) for evaluating MIS success at a public FET college. The changes clearly reflect the FET context as captured from the FET policy documents. For example the construct information quality is decomposed into two underlying components namely data quality and output quality which resonates with the focus on reporting. The construct system quality has two underlying components namely ease of access and ease of functioning which reflects infrastructural issues. Having user satisfaction consist of three instead of five underlying components adds to the parsimony of the model. The practical contribution lies in the usefulness of that model and tool on organizational and managerial levels. Further testing at other FET colleges is needed to refine the SA-FETMIS success model and verify the general applicability of the model in measuring MIS success.
6.
[9] Department of Higher Education and Training. 2011. Revised Strategic Plan, 2010/11 - 2014/15, and operational plans for the 2011/12 finacial year: Pretoria. [10] Dishaw, M.T., Strong, D.M. and Bandy, D.B. 2002. Extending the Task-Technology Fit Model with self-efficacy constructs, In Human-Computer Interaction Studies in MIS, Eighth Americas Conference on Information Systems. http://sigs.aisnet.org/SIGHCI/amcis02_minitrack/RIP/Disha w.pdf, 1021-1027. [11] Doll, W.J. and Torkzadeh, G. 1988. The Measurement of End-User Computing Satisfaction. MIS Quarterly. 12(2), 259-274. [12] Fishbein, M. and Ajzen, I. 1975. Belief, attitude, intention, and behavior: An introduction to theory and research. Reading, MA: Addison-Wesley. [13] Gable, G.G., Sedera, D. and Chan, T. 2008. Reconceptualizing Information System Success: The IS-Impact Measurement Model. Journal of the Association for Information Systems. 9(7), 377-408. [14] Goodhue, D.L. and Thompson, R.L. 1995. Task-Technology Fit and Individual Performance. MIS Quarterly. 19(2), 213236.
ACKNOWLEDGMENTS
[15] Ifinedo, P., Rapp, B., Ifinedo, A. and Sundberg, K. 2010. Relationships among ERP post-implementation success constructs: An analysis at the organizational level. Computers in Human Behavior. 26, 1136–1148.
We wish to thank the CEO and staff of public FET College X for their support and extensive contribution to the study, the University of South Africa (UNISA) and the Human Sciences Research Council (HSRC) for financial support of the study.
7.
[16] Lange, L. and Luescher, T.M. 2003. A monitoring and evaluation system for South African higher education: conceptual, methodological and practical concerns. South African Journal of Higher Education. 17(3), 82-89.
REFERENCES
[1] Bailey, J.E. and Pearson, S.W. 1983. Development of a Tool for Measuring and Analysing Computer User Satisfaction. Management Science. 29(5), 530-545.
[17] LaPiere, R.T. 1934. Attitudes vs. Actions. Social Forces. 13, 230-237.
[2] Bisschoff, T.C. and Nkoe, M.N. 2005. The merging of Further Education and Training colleges - challenging factors in three provinces of South Africa. South African Journal of Higher Education. 19(3), 203-217.
[18] Mason, R.O. 1978. Measuring Information Output: A Communication Systems Approach. Information and Management. 1(4), 219-234. [19] McGill, T., Hobbs, V. and Klobas, J. 2003. User-developed applications and information systems success: a test of
390
DeLone and McLean’s model. Information Resources Management Journal. 16(1), 24-45.
[29] Sedera, D., Gable, G., G. and Chan, T. 2004. A Factor and Structural Equation analysis of the Enterprise Systems Success Measurement Model, In Proceedings Americas Conference on Information Systems. New York, USA.
[20] Mouton, J. 2001. How to succeed in your Master's & Doctoral Studies. A South African guide and resource book. Van Schaik Publishers, Pretoria.
[30] Shannon, C.E. and Weaver, W. 1949. The Mathematical Theory of Communication. University of Illinois Press, Urbana, IL.
[21] Ong, C.-S., Day, M.-Y. and Hsu, W.-L. 2009. The measurement of user satisfaction with question answering systems. Information & Management. 46, 397-403.
[31] Twine, A. and Brown, I. Evaluating web conferencing tool effectiveness. In SAICSIT '11, October 3-5. 2011. Cape Town, South Africa: ACM 978-1-4503-0878-6/11/10.
[22] Palmius, J. 2007. Criteria for measuring and comparing information systems, In Proceedings of the 30th Information Systems Research Seminar in Scandinavia IRIS 2007: Scandinavia 24.
[32] Venkatesh, V. and Bala, H. 2008. Technology Acceptance Model 3 and a Research Agenda on Interventions. Decision Sciences. 39, 273-315.
[23] Petter, S., DeLone, W. and McLean, E.R. 2008. Measuring information systems success: models, dimensions, measures, and interrelationships. European Journal of Information Systems. 17, 236–263.
[33] Venkatesh, V. and Davis, F.D. 2000. A Theoretical Extension of the Technology Acceptance Model: Four Longitudinal Field Studies Management Science 46, 186204.
[24] Petter, S. and McLean, E.R. 2009. A meta-analytic assessment of the DeLone and McLean IS success model: An examination of IS success at the individual level. Information & Management. 46(3), 159-166.
[34] Venkatesh, V., Morris, M.G., Davis, F.D. and Davis, G.B. 2003. User Acceptance of Information Technology: Toward a Unified View. MIS Quarterly. 27, 425-478.
[25] Rai, A., Lang, S.S. and Welker, R.B. 2002. Assessing the Validity of IS Success Models: An Empirical Test and Theoretical Analysis Information Systems Research. 13(1), 50-69.
[35] Visser, M.M. 2011. Towards developing an evaluation tool for business management information systems' success at public Further Education and Training (FET) colleges in South Africa. Master of Science Thesis, Information Systems, University of South Africa (UNISA), Pretoria.
[26] Rosemann, M. and Vessey, I. 2008. Towards improving the relevance of information systems research to practice: the role of applicability checks. MIS Quarterly. 32(1), 1-22.
[36] Wixom, B.H. and Todd, P.A. 2005. A theoretical integration of user satisfaction and technology acceptance. Information Systems Research. 16(1), 85-102.
[27] Seddon, P.B. 1997. A Respecification and Extension of the DeLone and McLean Model of IS Success. Information Systems Research. 8(3), 240-253.
[37] York University. 2010. Theories used in IS research. [cited 2011 27 May].
[28] Seddon, P.B. and Kiew, M.Y. 1996. A Partial Test and Development of DeLone and MacLean's Model of IS Success. Australian Journal of Information Systems. 4(1), 90109.
Appendix
Table 3b. Rotated Component Matrixa
Component
Table 2a. PCA on indi’s five underlying items Initial eigenvalues Total
% of variance
Cum %
Component Item outpq v15b9 .859 v15b8 .857 v15b10 .795 v15b7 .735 v15b11 .721
Extraction sums of squared loadings Total
% of variance
Cum %
1 3.926 78.528 78.528 3.926 78.528 78.528 2 .455 9.106 87.635 3 .329 6.587 94.221 4 .163 3.266 97.487 5 .126 2.513 100.00 Note: For all the component matrixes the extraction method was Principal Component Analysis and the rotation method was Varimax with Kaiser Normalization.
a.
Component Item eof v15c10 .785 v15c7 .778 v15c9 .752 v15c11 .701 v15c6 .673 v15c4 .665 v15c5 .653 v15c8 .575 v15c12 .567
Table 2b. Component Matrixa Component Item indi v15a4 .919 v15a2 .905 v15a3 .903
Component Item dataq v15b5 .850 v15b3 .843 v15b2 .774 v15b4 .772 v15b1 .654 v15b6 .650 Rotation converged in 3 iterations. Table 4b. Rotated Component Matrixa
Component Item indi v15a5 .867 v15a1 .835 a. 1 component extracted.
391
Component Item eoa v15c2 .865 v15c1 .799 v15c3 .790
a. Rotation converged in 3 iterations.
Table 3a. PCA on infq’s eleven underlying items - Total variance explained Initial eigenvalues Comp. Total 1 2 3 4 5 6 7 8 9 10 11
7.073 1.119 .541 .421 .361 .318 .280 .268 .233 .206 .181
% of variance 64.304 10.173 4.921 3.823 3.281 2.890 2.548 2.432 2.116 1.868 1.642
Cum % 64.304 74.478 79.399 83.222 86.504 89.394 91.941 94.374 96.490 98.358 100.000
Extraction sums of squared loadings % of Total Cum % variance 7.073 64.304 64.304 1.119 10.173 74.478
Rotation sums of squared loadings Total 4.167 4.025
% of variance 37.882 36.595
Cum % 37.882 74.478
Table 4a. PCA on sysq’s twelve underlying items - Total Variance Explained Initial eigenvalues Comp. Total 1 2 3 4 5 6 7 8 9 10 11 12
6.878 1.041 .779 .707 .625 .491 .414 .323 .248 .218 .164 .112
% of Variance 57.320 8.679 6.495 5.890 5.208 4.093 3.446 2.689 2.070 1.813 1.366 .931
Cum % 57.320 65.998 72.493 78.383 83.591 87.685 91.131 93.820 95.890 97.703 99.069 100.000
Extraction sums of squared loadings % of Total Cum % Variance 6.878 57.320 57.320 1.041 8.679 65.998
Rotation sums of squared loadings Total 4.494 3.425
% of Variance 37.453 28.545
Cum % 37.453 65.998
Table 7a. PCA on eucs’s thirteen underlying items – Total variance explained Initial eigenvalues Comp. Total 1 2 3 4 5 6 7 8 9 10 11 12 13
7.142 1.436 1.009 .620 .528 .475 .351 .335 .300 .268 .229 .172 .135
% of variance 54.940 11.045 7.764 4.770 4.063 3.653 2.698 2.580 2.307 2.059 1.762 1.321 1.037
Cum % 54.940 65.986 73.749 78.519 82.582 86.235 88.933 91.513 93.820 95.879 97.642 98.963 100.000
Extraction sums of squared loadings % of Total Cum % variance 7.142 54.940 54.940 1.436 11.045 65.986 1.009 7.764 73.749
392
Rotation sums of squared loadings Total 3.816 3.567 2.205
% of variance 29.352 27.436 16.962
Cum % 29.352 56.788 73.749
Table 7b. Rotated component matrixa
Total
% of var
Cum %
3.972 .491 .251 .157 .129
79.444 9.814 5.028 3.135 2.579
79.444 89.258 94.286 97.421 100.00
3.972
79.444
79.444
format v15b8 .833 v15b9 .785 v15b10 .738 v15b7 .724 v15b11 .691 v15b5 .828 v15b3 .789 v15b4 .785 v15b2 .721 v15c5 .542 v15c2 v15c1 v15c10 a. Rotation converged in 6 iterations.
Table 5b. Component matrixa Component Item serq v15c17 .918 v15c14 .913 v15c15 .899
Component Item serq v15c13 .870 v15c16 .854 a. 1 component extracted
Component
Extraction sums of squared loadings
Total
% of var
Cum %
Total
% of var
Cum %
1
5.786
72.329
72.329
5.786
72.329
72.329
2
.774
9.681
82.010
3
.416
5.204
87.214
4
.277
3.467
90.681
5
.241
3.007
93.688
6
.197
2.461
96.148
7
.169
2.107
98.255
8
.140
1.745
100.00
Success evaluation indicator/ construct serq (Service quality) infq (Information quality) outpq (Output quality) dataq (Data quality) eucs (End-user computing satisfaction) for (Format) con (Content) eou (Ease of use) bmseval (Overall MIS evaluation) orgi (Organizational impact) sysq (System quality) eoa (Ease of access) eof (Ease of functioning) indi (Individual impact)
Table 6b. Component matrixa Component Item orgi v15d4 .889 v15d3 .882 v15d2 .863 v15d1 .850 a. 1 component extracted.
.861 .796 .643
Table 8. Reliability statistic and mean of each success evaluation indicator/construct
Table 6a. PCA on orgi’s eight underlying items Initial eigenvalues
eou
Component Item orgi v15d5 .849 v15d7 .838 v15d6 .827 v15d8 .803
393
Standard deviation
Cum %
Mean
Total
% of var
Component content
Item
Level of factor
Extraction sums of squared loadings
Cronbach’s alpha
1 2 3 4 5
Initial eigenvalues
Number of items
Component
Table 5a. PCA on serq’s five underlying items
N
5
0.934 1st order 3.76 .8899 148
11
0.943
5
0.909 1st order 3.75 .8249 158
6
0.922 1st order 3.67 .9292 159
13
0.928
5 5 3
0.909 1st order 3.75 .8249 158 0.898 1st order 3.65 .9181 160 0.765 1st order 3.64 .9102 160
41
0.981 3rd order 3.61 .7598 163
8
0.944 1st order 3.59 .9610 156
12
0.929
2nd order
2nd order
3.71 .8206 159
3.68 .7668 162
3
2nd 3.58 .8009 161 order st 0.858 1 order 3.71 .9321 158
9
0.915 1st order 3.52 .8304 160
5
0.931 1st order 3.44 1.0066 161