Address correspondence to Ioannis Poulios, Department of. Chemistry ..... Xibilia, M.G.; Barbalace, N. (2004) Sulphur recovery unit modeling via stacked neural ...
Separation Science and Technology, 45: 1644–1650, 2010 Copyright # Taylor & Francis Group, LLC ISSN: 0149-6395 print=1520-5754 online DOI: 10.1080/01496395.2010.487736
Modeling Methodology Based on Stacked Neural Networks Applied to the Photocatalytic Degradation of Triclopyr Ciprian George Piuleac,1 Ioannis Poulios,2 Florin Leon,3 Silvia Curteanu,1 and A. Kouras2 1
Downloaded By: [Romanian Ministry Consortium] At: 08:05 9 September 2010
Department of Chemical Engineering, Technical University ‘‘Gheorghe Asachi’’ of Iasi, Iasi, Romania 2 Department of Chemistry, Aristotle University of Thessaloniki, Lab. Physical Chemistry, Thessaloniki, Greece 3 Department of Computer Science and Engineering, Technical University ‘‘Gheorghe Asachi’’ of Iasi, Iasi, Romania
In the present paper, we propose a modeling methodology based on stacked neural networks by combining several individual networks in parallel, whose outputs are weighted to provide the output of the stack. Also, a procedure was included for finding the optimal set of weights that leads to the best performance of modeling, on both training and validation data. As a case study, we consider the photocatalytic oxidation of triclopyr where the final concentration was evaluated depending on the reaction conditions, irradiation time and amounts of reactants. We show that the performance of the stack is better than those of individual networks, especially for the validation phase. Keywords decomposition; modeling; neural network; photocatalysis; triclopyr
INTRODUCTION Pesticides and agrochemical compounds in general have been detected in water since the 1950s. The United Nations estimates that less than 1% of all pesticides used in agriculture actually reach the crops. The remainder ends up contaminating the land, the air, and particularly the water (1–3). As these contaminants in many cases are toxic and non-biodegradable, they tend to accumulate in the environment with unpredictable consequences for the mid-term future (4). An ideal treatment method for pesticide wastes would be a non-selective one that could achieve rapid and complete degradation to inorganic products and could be suitable for small-scale wastes (5). Possible advanced treatment methods that are used at the present time include advanced chemical oxidation, Received 15 December 2009; accepted 10 April 2010. Address correspondence to Ioannis Poulios, Department of Chemistry, Aristotle University of Thessaloniki, Lab. Physical Chemistry, 54124 Thessaloniki, Greece. E-mail: poulios@chem. auth.gr
adsorption on granulated active carbon, incineration, etc. Among the so-called Advanced Oxidation Processes (AOP), solar photocatalytic methods like heterogeneous photocatalysis (TiO2=UV-A) or photo-Fenton reagent (Fe3þ=H2O2=UV-A,Vis) have proven to be effective for a variety of chemicals (pesticides, dyes, etc.) and different types of wastewater (industrial, municipal, etc.) (5–7). A variety of toxic agrochemical substances, such as insecticides and pesticides, have also been studied with regard to their photocatalytic degradation, in the presence of artificial or solar illumination, with very encouraging results, while studies dealing with real or simulated wastewater have revealed that their complete or partial degradation is possible via the above-mentioned methods (5,8–11). The phenomenological treatment of such photochemical systems is very complex. In general, the rate of reaction in heterogeneous photocatalytic systems is a complex nonlinear function of catalyst loading, light intensity, initial solution pH, reactant, and oxidants concentration, etc. Due to these reasons, the ability of systems such as artificial neural networks (ANN) to recognize and reproduce cause– effect relationships through training, for multiple input– output mappings, has gained popularity in various areas of chemical engineering, and also in the field of photocatalytic treatment of wastewater (12–17). Artificial neural networks (ANN) represent promising alternative tools for classical process modeling. The role of an artificial neural network is to discover the relationships that link patterns of input data to the associated output data. Numerous types of problems in science can be cast in the form of a pattern-matching problem, and artificial neural networks are among the most effective methods within machine learning for revealing these links. Once trained, artificial neural networks are fast in operation and are particularly valuable in circumstances where
1644
MODELING METHODOLOGY BASED ON STACKED NEURAL NETWORKS
Downloaded By: [Romanian Ministry Consortium] At: 08:05 9 September 2010
the volume of available raw data is large, but not enough is known about the relationships within the data to allow the scientist to build an analytical model (18). Among the existing numerous neural networks paradigms, the feed-forward neural networks are the most popular due to their flexibility in structure, good representational capabilities, and large number of available training algorithms (19). In general, there is no certainty that any individual model can extract all relevant information from the data set. The idea of combining neural network models is based on the premise that different neural networks can capture different aspects of process behavior and aggregating this information should reduce uncertainty and provide more accurate predictions. It is always possible that a stacked network could outperform a single-best trained network for the following reasons: 1. Optimal network architecture cannot always be guaranteed. 2. The optimization of network parameters is a problem with many local minima. Even for a given architecture, final network parameters can differ between one run of the algorithm and another. 3. Different activation functions and learning algorithms can also lead to different generalization characteristics, and no one activation function or learning algorithm is the best in all cases. 4. Convergence criteria used for network training can lead to very different solutions for a given network architecture (20). Stacked neural networks designed to improve predictive modeling, have been increasingly used in the chemical processes, especially for dealing with some complex nonlinear processes where the understanding of the phenomena is limited. Some examples are presented in references (20–24). Our paper presents a neural networks modeling methodology applied to the heterogeneous photocatalytic decomposition of triclopyr in the presence of TiO2 as photocatalyst and is based on our experimental data obtained earlier (25). The heterogeneous photocatalytic oxidation of organic pollutants in the presence of TiO2 as catalyst, under artificial or solar irradiation, is a well known methodology, the description of which is presented in several excellent review articles (5,26,27). Therefore, in this paper, the various stages of the photocatalytic process will not be further presented. This methodology includes simple and stacked feedforward neural networks and a technique of optimizing the weights of the stack to obtain the best performance of the neural models. The developed models, especially stacked neural networks, accurately predict the final concentration of triclopyr as a function of reaction conditions.
1645
NEURAL NETWORK MODELING Individual Neural Networks A good process model—accurate model with a short simulation time—is a prerequisite for application in the optimal control strategy. A phenomenological model of a chemical process is difficult to obtain, especially when limited knowledge about the process is available. Neural networks could overcome these difficulties because they have a series of advantages, such as the possibility to be applied to complex nonlinear processes, the ease in using neural models, the possibility of substituting experiments with predictions. Neural models need only input-output data (experimental data), so their advantages are evident against the complexity of the computations. The most common neural network architecture is the multi-layer feed-forward neural network (often called multi-layer perceptron, MLP) which has a layered structure, consisting of input, hidden, and output layers. The number of neurons in input and output layers corresponds to the independent and dependent variables in the modeling and hidden neurons will be established within the best topologies of the neural networks. The neural network modeling implies several stages— collecting the training data by experiments, choosing training and testing data sets, developing the neural network topology, training, and, finally, establishing the performance of the model by evaluating the network predictions for new, unseen data. For our case study, the photocatalytic degradation of triclopyr, we follow the final concentration of this compound as a function of process conditions. The neural models consider the irradiation time (t), the initial concentration of triclopyr (C0), the concentration of TiO2 used as a catalyst (CTiO2 ), and the concentration of H2O2 (CH2 O2 ) as inputs, and the final concentration of triclopyr (C) as the output. First, the data (368 in total) were split into training and validation data sets, about 15% being the test data set used to evaluate the performance of the neural network to data not being used in the training process. In this way, we can evaluate the most important feature of a neural model—the generalization capability. The number of hidden layers and units was established by training a different range of networks and selecting the one that best balanced generalization performance against network size. The best network topology was determined based on the mean of squared errors (MSE) of the training data. Hidden neurons, as well as the output layer neuron, use hyperbolic tangent as the nonlinear activation function. The network was trained using the well-known back-propagation algorithm. We consider that training ends when the network error (MSE) on the testing set becomes sufficiently small and does not increase.
1646
C. G. PIULEAC ET AL.
TABLE 1 Different neural networks developed with experimental data Network type
Downloaded By: [Romanian Ministry Consortium] At: 08:05 9 September 2010
MLP(4:5:1) MLP(4:10:1) MLP(4:15:1) MLP(4:20:1) MLP(4:12:4:1) MLP(4:24:8:1) MLP(4:25:20:1) MLP(4:30:25:1) MLP(4:42:14:1)
MSE
r
Ep %
0.0012 0.0004 0.000354 0.000375 0.000756 0.00058 0.000079 0.000106 0.00047
0.988230 0.998497 0.998669 0.99859 0.997156 0.997816 0.999702 0.999599 0.998232
19.2430 13.1822 9.9729 13.5923 17.9502 11.6835 3.8722 5.5637 10.6775
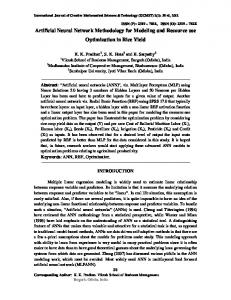
Table 1 contains a series of MLP with one or two hidden layers trained with experimental data, and their performances registered in the training stage: MSE, r (the correlation between experimental data and the output of the neural network) and Ep (percent error). Only several examples are presented in Table 1 from many neural networks trained on a different number of epochs (different training time). Taking into account their performance, three neural networks were selected—MLP(4:15:1), MLP(4:25:20:1), and MLP(4:30:25:1). Stacked Neural Networks Generally, stacked neural networks provide more accurate results than individual neural networks. In this paper, we compare the predictions of individual and stacked neural networks, especially in the validation phase, in order to select a neural model with a high generalization capability. For our stack model, we considered the three neural networks previously selected, MLP(4:15:1), MLP(4:25:20:1), and MLP(4:30:25:1), based on their good performances obtained in the training and validation phases. The method used to combine the parallel models was the weighted summation of the individual outputs. Consequently, the performance of the stack is influenced by the aggregated individual models and their corresponding weights. Figure 1 presents the stacked neural networks for our case study.
FIG. 1. Stacked neural networks developed for the modeling of photocatalytic degradation of triclopyr.
RESULTS AND DISCUSSION Individual and stacked neural networks were applied to the training and validation data sets in order to compare their performance and, finally, to choose the most appropriate model for the studied process. Figures 2 and 3 present some examples of predictions performed with individual networks on training and validation phases. The performance of individual networks can be improved by stacking them (17,24). Different stacks were developed with the three networks, MLP(4:15:1), MLP(4:25:20:1), and MLP(4:30:25:1), denoted by N1, N2, and N3, respectively, the weight of each being changed. In order to find the optimal weights, the first step was to systematically generate weights between 0% and 100% with a step of 10%, and record the average relative error and correlation on training and validation data sets. Several selected results are presented in Table 2. The first three rows of this table show the performance of the individual networks which compose the stack. Relative errors were calculated using the following formula: Er % ¼
Cexp � Cnet � 100 Cexp
ð1Þ
where C represents the concentration of triclopyr, and indexes exp and net denote experimental and network values. Table 2 refers to the first case approached in the paper and corresponds to the three of the best neural networks aggregated in a stack.
FIG. 2. Predictions of MLP(4:15:1) on training data compared with experimental data for the variation in time of final concentration of triclopyr using different concentration of TiO2.
1647
Downloaded By: [Romanian Ministry Consortium] At: 08:05 9 September 2010
MODELING METHODOLOGY BASED ON STACKED NEURAL NETWORKS
FIG. 3. Predictions of MLP(4:25:20:1) on validation data (C_net) compared with experimental data (C_exp) for the variation in time of final concentration of triclopyr using different concentration of TiO2.
One can see smaller errors and better correlations for the stacked neural networks than for individual networks. In order to find the optimal stacked neural network, separate neural networks were developed for interpolation. One network was prepared for the interpolation of the training results and another one for the validation results. They had two inputs, the weights for N1 and N2 and the correlation, r, as the output. Only two inputs are necessary because the third weight w3 ¼ 100 � w1 � w2. The significance of w1, w2, and w3 can be seen in Fig. 1. While these networks were admitted to be large enough, several variants were tried: MLP(2:24:8:1) and MLP(2:21:7:1), for training and validation, respectively, because the interpolation capacity here is more important than the generalization capability. The predictions of these models were generated with a step of 1% and the maximum correlation of 0.999045 was obtained with the following contributions of the individual networks N1, N2, and N3: w1 ¼ 15%, w2 ¼ 52%, and w3 ¼ 33%, respectively. Figure 4 shows the variation of the stack performance with the weights of
TABLE 2 Performance of the individual neural networks compared to different types of stacks (case 1) Weights, %
Training
Validation
w1
w2
w3
Average relative error, %
Correlation
Average relative error, %
Correlation
100 0 0 0 20 90 20 30 20 30 20 30 40 0 10 20 30 40 20 30 50 60 80 90
0 100 0 10 10 10 20 20 30 30 40 40 40 50 50 50 60 60 70 70 0 0 0 0
0 0 100 90 70 0 60 50 50 40 40 30 20 50 40 30 10 0 10 0 50 40 20 10
11.5402 4.1128 5.5549 3.9941 4.9967 12.0758 4.8894 5.6712 4.8472 5.6193 4.7986 5.5782 6.9750 3.5931 4.0535 4.7449 6.0830 6.9385 4.6821 6.0519 8.1606 9.1060 11.0887 12.1083
0.9989 0.9997 0.9995 0.9999 0.9998 0.9991 0.9998 0.9998 0.9998 0.9998 0.9999 0.9998 0.9997 0.9999 0.9999 0.9999 0.9998 0.9998 0.9999 0.9998 0.9996 0.9995 0.9992 0.9991
8.3935 6.3715 6.0048 5.2152 4.9750 7.8239 4.7159 4.8335 4.4543 4.6618 4.2697 4.6176 5.0794 4.2809 4.0997 4.2730 4.5913 5.0615 4.3546 4.6191 5.7264 6.1099 7.2274 7.7848
0.9954 0.9979 0.9976 0.9989 0.9989 0.9989 0.9989 0.9988 0.9990 0.9989 0.9990 0.9989 0.9987 0.9990 0.9990 0.9990 0.9989 0.9987 0.9990 0.9989 0.9981 0.9978 0.9968 0.9961
Downloaded By: [Romanian Ministry Consortium] At: 08:05 9 September 2010
1648
C. G. PIULEAC ET AL.
FIG. 4. The variation of the stack performance in the validation stage with the weights of the component neural networks for stack 1.
the component neural networks, for the validation stage in case 1. Because of the interpolation errors, the above result (the maximum) is not precise. Additional experiments were performed in the neighborhood of the potential maximum in order to improve the solution. The value 0.999048 for correlation corresponds to a stack with 12%, 50%, and 38% (stack 1).
In another trial, three neural networks with one single layer (the simplest networks with acceptable performances), MLP(4:5:1), MLP(4:10:1), and MLP(4:15:1) were considered for the stack. The entire procedure described above was repeated to obtain the weights of the individual networks in the stack which leads to the best correlation in the validation phase. Table 3 presents comparatively some of the results provided by individual and stacked neural networks. Here, N1, N2, and N3 refer to the neural networks with one hidden layer and 5, 10, and 15 hidden neurons, respectively, and w1, w2, and w3 are the contributions of the networks to the stack output. An optimization procedure based on a separate neural network for all training and validation results, MLP(2:15:5:1), with the weights as inputs and the correlation as the output, gives the weights 9%, 55%, and 36% with a correlation of 0.996071. Figure 5 presents the variation of the correlation values with the weights of the stack, emphasizing the optimum (maximum). Additional simulations around this optimum point found a correlation of 0.996087 for the following weights: 11%, 53%, and 36% (stack 2). Certainly, the results of the stacks are better than those of the individual models as it can be seen in Tables 2 and 3. Both stacks, with optimum values for the weights, were tested with validation experimental data; a part of these results are presented in Table 4. It is evident that the results
TABLE 3 Performance of the individual neural networks compared to different types of stacks (case 2) Weights, %
Training
Validation
w1
w2
w3
Average relative error, %
Correlation
Average relative error, %
Correlation
100 0 0 30 10 20 10 30 40 10 20 30 40 20 10 20 10
0 100 0 10 20 20 30 30 30 40 40 40 40 50 60 60 70
0 0 100 60 70 60 60 40 30 50 40 30 20 30 30 20 20
17.4134 12.7506 11.5402 12.2974 11.8047 11.9118 11.6393 11.9454 21.0089 11.5215 11.6410 11.8988 12.4304 11.5937 11.4386 11.6012 11.4941
0.9979 0.9986 0.9989 0.9988 0.9989 0.9989 0.9989 0.9988 0.9987 0.9989 0.9988 0.9988 0.9987 0.9988 0.9988 0.9988 0.9988
14.9485 9.7000 8.3935 8.7145 7.6877 8.0733 7.5663 8.7902 9.6016 7.6186 8.2003 8.8925 9.7276 8.4065 8.2020 8.6493 8.6330
0.9925 0.9948 0.9954 0.9958 0.9959 0.9959 0.9960 0.9959 0.9957 0.9961 0.9960 0.9959 0.9957 0.9960 0.9961 0.9960 0.9960
1649
Downloaded By: [Romanian Ministry Consortium] At: 08:05 9 September 2010
MODELING METHODOLOGY BASED ON STACKED NEURAL NETWORKS
FIG. 5. The variation of the stack performance in the validation phase with the weights of the component neural networks for stack 2.
of the two stacks are similar. Consequently, the simpler stack, with only one hidden layer, can be chosen to model the decomposition process of triclopyr.
CONCLUSIONS In this paper, we compare the predictions of individual and stacked neural networks, especially in the validation phase, in order to select a neural model with a high generalization capability. The procedure is applied to the photocatalytic decomposition of triclopyr and the process is evaluated by the final concentration of triclopyr as a function of the reaction conditions—initial concentration, time, pH, and catalyst concentration. The stack was constructed from three feed-forward neural networks with one or two hidden layers whose outputs were weighted. Different stacks were developed by changing the component networks and the weights with which each individual network contributes to the total (stack) output. An optimization method based on an interpolation neural network with individual neural network weights as inputs and the correlation between experimental and predicted data as the output leads to the finding of the decision surface of the values for the three weights, and to the discovery of the optimum set of weights. The results of the stacks were better than those of the individual models. Good predictions were obtained in the validation phase, so these models give a very good
TABLE 4 Results obtained with the two stacks in the validation phase Reaction conditions (input parameters) Time
C0
TiO2
H2O2
11 19 16 19 6 15 6 4 8 9 7 14 3 18 4 17 5 28 6 18
10 10 10 10 10 10 10 10 10 10 10 10 10 15 5 7.5 15 15 10 10
0.1 0.1 0.25 0.5 1 1 2 2 2 2 2 2 2 2 2 2 2 2 3 3
0 0 0 0 0 0 2 10 15 50 100 100 150 0 0 0 0 0 0 0
Output parameter C exp
Stack 1 12%, 50%, 38%
Stack 2 11%, 53%, 36%
C_net
Error, %
C_net
Error, %
3.47 3.577 1.15 1.157 1.54 1.581 0.52 0.502 3.57 3.738 0.63 0.654 2.44 2.440 3.40 3.516 1.04 1.108 0.65 0.607 1.01 0.887 0.63 0.545 5.07 5.031 0.72 0.766 1.67 1.633 0.10 0.106 6.48 6.501 0.14 0.166 2.94 3.172 0.31 0.320 Average Error
2.974367 0.076864 2.568428 4.620038 4.444041 3.549991 0.181637 3.211716 5.813032 7.938381 12.4089 13.88995 0.794277 5.385821 2.514447 2.203196 0.270999 14.93935 7.621371 1.333485 4.139456
3.577 1.158 1.580 0.500 3.735 0.656 2.441 3.525 1.103 0.609 0.885 0.539 5.033 0.766 1.633 0.109 6.502 0.167 3.171 0.320
2.974367 0.0095 2.503552 5.000038 4.360217 3.866658 0.140728 3.47591 5.335536 7.635048 12.6064 14.83795 0.754839 5.385821 2.514447 0.564638 0.286422 15.63175 7.587442 1.333485 4.101125
1650
C. G. PIULEAC ET AL.
representation of the photocatalytic oxidation of triclopyr, and they could be capable of providing useful information for experimental practice. ACKNOWLEDGEMENTS This work was completed with the financial support provided by the Romanian Ministry of Education and Research through the National Program for Research, Development and Innovation II, grant 316=2008, contract no. 671=2009.
Downloaded By: [Romanian Ministry Consortium] At: 08:05 9 September 2010
REFERENCES 1. Readman, J.W.; Albanis, T.; Barcelo, D.; Galassi, S.; Tronczynski, J.; Gabrielides, G. (1993) Herbicide contamination of Mediterranean estuarine waters: Results from a MED POL pilot survey. Marine Pollution Bulletin, 26: 613–619. 2. Kopling, D.W.; Thurman, E.M.; Goosby, D.A. (1996) Occurrence of selected pesticides and their metabolites in near-surface aquifers of the Midwestern United States. Environ. Sci. Technol., 30: 335–340. 3. Meyer, M.T.; Thurman, E.M. (1996) Herbicide Metabolites in Surface Water and Ground Water. ACS Symposium Series 630, American Chemical Society, Washington, DC. 4. Hayo, M.G. (1996) Assessing the impact of pesticides on the environment. Agric. Ecosyst. Environ., 60: 81–96. 5. Blanco, J.; Malato, S. (2001) Solar Detoxification. UNESCO, Natural Sciences, World Solar Programme 1996–2005 [chapter 2], (http:// www.unesco.org/science/wsp). 6. Robertson, P.J.; Bahnemann, D.W.; Robertson, J.M.C. (2005) Handbook of Environmental Chemistry, Vol. 2, Part M; Springer-Verlag: Berlin Heidelberg, 367–423. 7. Blake, D. (2001) Bibliographic Work on the Heterogeneous Photocatalytic Removal of Hazardous Compounds from Water and Air, National Renewable Energy Laboratory, Technical Report, NREL= TP-510-31319. 8. Konstantinou, I.K.; Albanis, T.A. (2003) Photocatalytic transformation of pesticides in aqueous titanium dioxide suspensions using artificial and solar light: intermediates and degradation pathways. Appl. Catal. B, 42: 319–335. 9. Ishiki, R.R.; Ishiki, H.M.; Takashima, K. (2005) Photocatalytic degradation of imazethapyr herbicide at TiO2=H2O interface. Chemosphere, 58: 1461–1469. 10. Huston, P.L.; Pignatello, J.J. (1999) Degradation of selected pesticide active ingredients and commercial formulations in water by the photo-assisted Fenton reaction. Water Res., 33: 1238–1246. 11. Toepfer, B.; Gora, A.; Li Puma, G. (2006) Photocatalytic oxidation of multicomponent solutions of herbicides: Reaction kinetics analysis with explicit photon absorption effects. Appl. Catal. B, 68: 171–180. 12. Salari, D.; Daneshvar, N.; Aghazadeh, F.; Khataee, A.R. (2005) Application of artificial neural networks for modeling of the treatment
13.
14.
15.
16.
17.
18. 19.
20.
21.
22.
23.
24.
25.
26.
27.
of wastewater contaminated with methyl tert-butyl ether (MTBE) by UV=H2O2 process. J. Hazard. Mat., B125: 205–210. Guimaraes, O.L.C.; Silva, M.B. (2007) Hybrid neural model for decoloration by UV=H2O2 involving process variables and structural parameters characteristics to azo dyes. Chem. Eng. Proc., 46: 45–51. Duran, A.; Monteagudo, J.M.; Mohedano, M. (2006) Neura networks simulation of photo-Fenton degradation of Reactive Blue 4. Appl. Catal. B: Environmental, 65: 127–134. Suditu, G.D.; Secula, M.; Piuleac, C.G.; Curteanu, S.; Poulios, I. (2008) Genetic algorithms and neural networks based optimization applied to the wastewater decolorization by photocatalytic reaction. Rev. Chim., 59: 816–825. Caliman, F.A.; Curteanu, S.; Betianu, C.; Gavrilescu, M.; Poulios, I. (2008) Neural networks and genetic algorithms optimization of the photocatalytic degradation of alcian blue 8gx. J. Advanced Oxidation Technologies (ACS), 11: 316–326. Piuleac, C.G.; Rodrigo, M.; Can˜izares, P.; Curteanu, S.; Sa´ez, C. (2010) Ten steps modelling of electrolysis processes by using neural networks. Environ. Modelling & Software, 25 (1): 74, doi:10.1016= J.ENVSOFT.2009.07.012. Cartwright, H. (2008) Using Artificial Intelligence in Chemistry and Biology; CRC Press, Taylor & Francis Group, Oxford, UK. Ma, L.; Khorasani, K. (2004) New training strategies for constructive neural networks with application to regression problems. Neural Networks, 17: 589–609. Tian, Y.; Zhang, J.; Morris, J. (2001) Modeling and optimal control of a batch polymerization reactor using a hybrid stacked recurrent neural networks. Ind. Eng. Chem. Res., 40: 4525–4535. Xibilia, M.G.; Barbalace, N. (2004) Sulphur recovery unit modeling via stacked neural network. Proceedings of the IASTED International Conference on Applied Simulation and Modelling, art. No. 443-061, 65–70. Zhang, J.; Morris, A.J.; Martin, E.B.; Kiparissides, C. (1999) Estimation of impurity and fouling in batch polymerization reactors through the application of neural networks. Comput. Chem. Eng., 23: 301–314. Zhang, J. (2008) Batch-to-batch optimal control of a batch polymerization process based on stacked neural network models. Chem. Eng. Sci., 63: 1273–1281. Piuleac, C.G.; Curteanu, S.; Cazacu, M. (2010) Stacked neural network modeling applied to the process of metal ion sorption by the functional silica xerogel. Rev. Roum. Chim., 55 (2): 85–97. Poulios, I.; Kositzi, M.; Kouras, A. (1998) Photocatalytic decomposition of triclopyr over aqueous semiconductor suspensions. J. Photochem. Photobiology A: Chemistry, 115: 175–183. Hoffman, M.R.; Martin, S.; Choi, W.; Bahnemann, D. (1995) Environmental applications of semiconductor photocatalysis. Chem. Rev., 95: 69–96. Fujishima, A.; Rao, T.N.; Tryk, D.A. (2000) Titanium dioxide photocatalysis. J. Photochem. Photobiol., C 1: 1–21.