Landscape dynamics are the result of multiple interacting biophysical and ... landscape modeling; regional landscapes; social-ecological networks.
Copyright © 2012 by the author(s). Published here under license by the Resilience Alliance. Parrott, L., C. Chion, R. Gonzalès and G. Latombe. 2012. Agents, individuals, and networks: modeling methods to inform natural resource management in regional landscapes. Ecology and Society 17(3): 32. http://dx.doi.org/10.5751/ES-04936-170332
Synthesis, part of a Special Feature on Applying Landscape Science to Natural Resource Management
Agents, Individuals, and Networks: Modeling Methods to Inform Natural Resource Management in Regional Landscapes Lael Parrott 1, Clément Chion 1, Rodolphe Gonzalès 1, and Guillaume Latombe 1 ABSTRACT. Landscapes are complex systems. Landscape dynamics are the result of multiple interacting biophysical and socioeconomic processes that are linked across a broad range of spatial, temporal, and organizational scales. Understanding and describing landscape dynamics poses enormous challenges and demands the use of new multiscale approaches to modeling. In this synthesis article, we present three regional systems—i.e., a forest system, a marine system, and an agricultural system— and describe how hybrid, bottom-up modeling of these systems can be used to represent linkages across scales and between subsystems. Through the use of these three examples, we describe how modeling can be used to simulate emergent system responses to different conservation policy and management scenarios from the bottom up, thereby increasing our understanding of important drivers and feedback loops within a landscape. The first case study involves the use of an individual-based modeling approach to simulate the effects of forest harvesting on the movement patterns of large mammals in Canada's boreal forest and the resulting emergent population dynamics. This model is being used to inform forest harvesting and management guidelines. The second case study combines individual and agent-based approaches to simulate the dynamics of individual boats and whales in a marine park. This model is being used to inform decision-makers on how to mitigate the impacts of maritime traffic on whales in the Saint Lawrence Estuary in eastern Canada. The third example is a case study of biodiversity conservation efforts on the Eyre Peninsula, South Australia. In this example, the social-ecological system is represented as a complex network of interacting components. Methods of network analysis can be used to explore the emergent responses of the system to changes in the network structure or configuration, thus informing managers about the resilience of the system. These three examples illustrate how bottom-up modeling approaches may contribute to a new landscape science based on scenario building, to find solutions that meet the multiple objectives of integrated resource management in social-ecological systems. Key Words: agent-based modeling; complex systems; individual-based modeling; integrated natural resource management; landscape modeling; regional landscapes; social-ecological networks INTRODUCTION Recent research suggests that ecosystems and landscapes are complex human–environment systems, having a dynamics characterized by uncertainty, threshold effects, and emergent patterns arising from multiple interacting processes linked across scales of space and time (Levin 1998, Crawford et al. 2005, Liu et al. 2007a, Liu et al. 2007b, Ryan et al. 2007). Human–environment systems are increasingly being studied under the guise of "ecological systems (SES)" or "coupled human and natural systems (CHANS)" (Liu et al. 2007a, Liu et al. 2007b). This literature has advanced the theory on the resilience of social-ecological systems (Folke 2006), the adaptive capacity of human communities, and the incorporation of complexity science into sustainable resource management (Walker et al. 2004, Norberg and Cumming 2008). Clearly, long-standing approaches to landscape and ecosystem management, traditionally based on a “command and control” paradigm applied to a single resource considered in isolation (Holling and Meffe 1996), must be replaced by innovative, integrated approaches that incorporate the inherent complexity of social and ecological systems (Parrott 2002, Harris 2007, Norberg and Cumming 2008, Parrott and Meyer
1
2012). In addition, case studies from diverse locations around the world conclude that, to be successful, landscape management approaches should be developed in collaboration with regional populations, using participative methods that engage local stakeholders (Ostrom et al. 1999, Armitage et al. 2008, Norberg and Cumming 2008, Brondizio et al. 2009). Models can be useful platforms to engage stakeholders by informing them about the complexity of the resource system with which they interact and allowing them to explore the potential outcomes of different management and intervention scenarios (Carpenter and Gunderson 2001, Seely et al. 2004, Bryan et al. 2011). Hybrid models, often integrating geographic information systems with agent or individualbased approaches, are tools of choice for modeling regional systems and are increasingly being used to study natural and common-pool resource management problems (Parker et al. 2003, Matthews et al. 2007). In such models, the basic modeling units are individual entities at a low level of the organizational structure (e.g., individual stakeholders, individual animals or plants, or highly resolved landscape units) and higher level patterns and processes emerge during a simulation as the result of the collective actions of the lower-
Complex Systems Laboratory, Department of Geography, Université de Montréal, Canada
Ecology and Society 17(3): 32 http://www.ecologyandsociety.org/vol17/iss3/art32/
level entities. By simulating processes from the bottom up, such models capture many of the characteristics of complex systems (e.g., hierarchy, cross-scale interactions, emergence) and are well suited to exploratory modeling and scenario testing (Bradbury 2002). Hybrid models have been applied in a variety of natural resource management contexts, including agriculture, hydrology and irrigation, and rangeland and forest management (Berger 2001, Becu 2003, Deadman et al. 2004, Gross et al. 2006, Manson 2006, Moreno et al. 2007, Schlüter and Pahl-Wostl 2007, van Oel et al. 2010). Ostrom (2009) presented a conceptual framework for describing and analyzing social-ecological systems, in which four main subsystems in interaction with each other are identified (Fig. 1). Fig. 2 shows how Ostrom’s framework can be transcribed into a typical bottom-up modeling framework. Here we show how Ostrom’s general framework can be applied to conceptualize three regional systems facing conservation planning and management challenges. These three systems, which include a forest system, a marine system, and an agricultural system, have been selected specifically to illustrate the general applicability of the approach across a range of resource types (Fig. 3). We describe how hybrid, bottom-up models can be developed to represent key components in each system and inform stakeholders about the potential impacts of different management scenarios on the landscape. We discuss how simulating the emergent responses of each system from the bottom up can contribute to stakeholder awareness of system complexity and develop an understanding of the need to consider a range of possible outcomes when intervening on the landscape. Fig. 1. Conceptual framework of a social–ecological system, as proposed by Ostrom (2009).
Fig. 2. Simulation of a social-ecological system using a bottom-up approach. The model represents local interactions between human and biophysical components (users and resource units) in a regional landscape (resource system). These interactions give rise to emergent patterns and processes (outcomes) in the system. Components may re-organize or modify their behavior in response to emergent outcomes, giving rise to feedback loops within the system. As shown here, and in the three case studies presented in this article, the actions taken by the governance system, in the form of policy and management scenarios, are typically input to the model by a human end-user.
METHODS AND RESULTS Case study 1: boreal forest system, northeastern Canada Context The study area is a ~72,000-km2 section of primary boreal forest situated in the Côte-Nord region of Quebec, Canada (Fig. 3), which is a central area within the range of the endangered forest-dwelling caribou (Rangifer tarandus caribou). Forestry is the second-largest economic activity in this region and large sectors are subject to harvesting and regeneration schemes. In this social-ecological system, logging companies with concessions exploit the same resource units (wood). Concerns about the situation of woodland caribou populations have led to the implementation of an ecosystem-based approach to forest management in the region, in which management plans that are proposed for large areas (thousands of square kilometers) attempt to ensure the economic viability of the forest industry while at the same time preserving the biodiversity of the forest. Fig. 4 and Table 1 describe the main subsystems and variables of the study region.
Ecology and Society 17(3): 32 http://www.ecologyandsociety.org/vol17/iss3/art32/
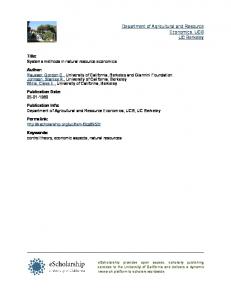
Fig. 3. Locations and representative landscapes of the three study areas described in the text. (a) Locations on the world map. Insets show the extent of each study area (dashed line) and the locations of images b and c (dark rectangles). (b) Representative area of the landscape of case study 1, showing the spatial configuration of cutblocks and residual forest. (c) View of the estuary and surrounding landscape of case study 2. (d) Representative area of the landscape of case study 3, showing agricultural fields and remnant vegetation patches.
(Cartography by Marc Girard) (Google Earth image copyrights. (b): © 2012 TerraMetrics, © 2012 Cnes / Spot Image. (c): Data – SIO, NOAA, U.S. Navy, NGA, GEBCO. Image – © 2012 TerraMetrics, © 2012 Cnes / Spot Image. (d): © 2012 GigitalGlobe, © 2012 Whereis ® Sensis Ply Ltd.) Woodland caribou habitat is the ancient boreal forest that covers much of Canada. The distribution of caribou has been gradually receding towards the north as the result of the northerly advance of logging and other anthropogenic activities (Schaefer 2003). By modifying the structure of the
landscape, via habitat fragmentation and by changing the distribution of stand ages, forest harvesting activities have a major impact on wildlife species (Thompson et al. 2003). These activities reduce and fragment the habitat of the caribou, but they also modify their interactions with other species,
Ecology and Society 17(3): 32 http://www.ecologyandsociety.org/vol17/iss3/art32/
Table 1. Conceptual framework of case study 1: boreal forest, northeastern Canada. Conceptual framework
Boreal forest case study
In the model
Social, economic, and political setting Resource system
Economic development: logging companies. Government policies: species at risk act. Sector: forest. Boundaries: number of companies, management units. Size: 72,000 km2. Predictability: medium. Location: Côte Nord, Quebec, Canada. Mobility: none. Replacement rate: at the scale of the century. Economic value: high. Spatial and temporal distribution: crucial. Provincial Ministry of Natural Resources and Wildlife. Number: 2 (Arbec, Abitibi-Bowater). Socioeconomic attribute: logging companies. Importance of resource to them: crucial. They can cut according to different techniques. Harvesting level: high. Conflicts: competing economic and conservation priorities. Investment: industry, government ,and university sources. Ecological performance measures: forest regrowth (wood), biodiversity (caribou conservation). Wolf, caribou, and moose. Herbivores food: lichen, leaves, and shrubs.
Not represented. The setting serves as the context behind the creation of the model. Explicitly modeled.
Resource units
Governance system Users
Interactions
Outcomes Related ecosystems
especially with their main predator, the wolf (Canis lupus), through: (1) creation of a road network that allows wolves to move more efficiently (James and Stuart-Smith 2000), and (2) apparent competition with the moose (Alces alces) (James et al. 2004, Wittmer et al. 2007) whose population numbers increase in the regenerating forest. An increase in moose numbers is typically followed by an increase in wolves, therefore increasing predation pressure on caribou. Due to these complex feedbacks between landscape structure and the population dynamics of caribou, wolf, and moose, the effects of management plans on the long-term viability of the caribou population are little known. Modeling may help to identify the ideal spatial configuration of cutblocks to maintain the economic viability of the forest industry in the region while at the same time maximizing the long-term viability of the caribou population. Emergence Forest harvesting on the landscape thus has a compounded and nonlinear effect on caribou by not only reducing the total area of their habitat, but also by changing the movement patterns and population dynamics of the species with which they interact, thus potentially increasing encounter rates between caribou and their predators. This is a complex phenomenon that cannot be predicted without considering the interactions between landscape pattern and individual-level behaviors, and it involves a number of important feedback loops.
Not explicitly represented. The resource (wood) is found more abundantly in some land cover types, which are explicitly represented in the model. Modeled indirectly via scenarios provided by the model end-user. Not represented. Users are implicitly included through the construction of roads and cuts in the scenarios. Not represented. The model itself is a tool to improve communication between the governance system and the users, and to allow for a better understanding of the resource system by both parties. Explicitly modeled (caribou) and not represented (wood). Explicitly modeled.
Animal movements depend on local conditions, habitat connectivity, and, according to unified foraging theory (Mangel 1986), an animal’s internal state. This internal state is itself a result of the past history of the animal and varies with time. Different structures of the landscape can therefore result in feedbacks that give rise to different spatial and nonspatial characteristics of landscape use by individuals. For example, the functional response in habitat selection, defined as a disproportionate selection of a habitat type with respect to its availability (Mysterud 1986), gives rise to an important variability in habitat selection for different environments. Additionally, local predator–prey interactions can modify an animal’s behavior. Analysis of empirical data shows that wolf presence modifies its prey’s behavior (Creel et al. 2005, Proffitt et al. 2009). Moreover, wolves modify their behavior after a successful kill (Kuzyk 2002), giving rise to complex feedback loops between landscape structure, predator–prey interactions, and animal movements. Lastly, resources are nonlimiting in this system, implying that top-down forces are regulating animal populations, and that the frequency of predator–prey interactions is therefore crucial for population viability. In addition to landscape structure, the respective sizes of animal populations also have an influence on predator– prey interactions, giving rise to another feedback loop linking population and individual-level dynamics.
Ecology and Society 17(3): 32 http://www.ecologyandsociety.org/vol17/iss3/art32/
Fig. 4. Conceptual diagram showing the main components and interactions of the boreal forest social-ecological system, based on Ostrom’s framework (Ostrom 2009). The dashed lines encircle parts of the system that are not explicitly included in the model.
Model The model is designed to explore the relationships described above between landscape structure, animal movements, and population viability. It explicitly represents the resource system (the forest landscape) and the outcomes of resource use on the ecosystem (populations of moose, caribou, and wolf). Resource units (volume of harvestable wood) are not considered. The governance system and resource users are implicitly included in the model in the form of management plans (spatial and temporal allocation of cutblocks, development of the road network) that are input to the model by human end-users. See Table 1 for additional details. The model represents the evolution of the forest landscape at a yearly time step (spatial extent 72,000 km2; scale 25x25 m). Spatial variables can be divided into two groups: those related
to land cover (e.g., vegetation), and those related to human activities (e.g., roads, logging, etc.). Moose, caribou, and wolves are represented as individuals, using an individualbased modeling approach that simulates individual movements, interactions, and energetic requirements at 4-h time steps. Individuals move according to step selection functions (Fortin et al. 2005) that assign scores to different possible steps (direction and distance of movements) by favoring selection or avoidance of environmental variables, coupled with internal (or state) variables. More specifically, herbivores select steps based on energy gains and losses, distance to roads, density of recent cuts and regenerating stands, and percentage of canopy cover at the destination location. The individual’s energy balance over the last few days (based on resource availability in recently visited
Ecology and Society 17(3): 32 http://www.ecologyandsociety.org/vol17/iss3/art32/
locations) and its perceived predation risk (based on recent wolf presence in space or time) are also taken into account in the movement function and there is an important trade-off to be made between energetic requirements and predation risk. Previously visited patches are retained in memory so that home range characteristics can be reproduced (Van Moorter et al. 2009, Bonnell et al. 2010). Wolves move based on landscape characteristics—i.e., land cover types, altitude, elevation, road density, density of recent cuts, density of regenerating stands, percentage of canopy cover, and the gradient of canopy cover —and do not consider energetic requirements in their habitat selection. Territorial behavior emerges because wolves remember previous kill sites, tend to return to previous locations, and avoid locations where wolves from other dens were in the past (Lewis et al. 1997). Wolves have two displacement modes: a wandering one and a resting one. The resting mode occurs after having killed a prey. Herbivores therefore influence wolves’ behavior by changing this mode. Individuals reproduce each year, and die naturally after a certain number of years, allowing the simulation of population dynamics over long time scales. Application The model is being used to test the effect of different management plans on the long-term (100-y) evolution of animal populations, especially caribou, i.e., on the outcomes of the interaction between the users (logging companies) and the resource system. By simulating animal responses and vegetation evolution from the bottom up, the model can enhance our understanding of both the direct and indirect effects of human activities on the woodland caribou that arise from complex interactions between multiple species and their environment. Due to the complexity of the interactions between the wolf and caribou in space and time, the response of the caribou population to different harvesting scenarios is highly nonlinear and essentially impossible to predict without using simulation based on a bottom-up modeling approach. There will likely be many surprises in this emergent response, such as unforeseen consequences of specific spatial or temporal configurations of cutblocks and residual stands. The economic implications of the simulated management plans are currently assessed independently from the model. Explicitly modeling the wood (resource units) available for harvest and the economic costs and benefits of different management scenarios would improve the usefulness of the model for management and planning. While excluding the human component from the model greatly simplifies the modeling process, end-users interacting with the model will be faced with a multiple-objective, spatiotemporaloptimization problem for which the solution space is quite large. Future development could include the addition of a software agent (or a population of software agents) that searches the solution space for optimal harvesting scenarios, in order to find an acceptable compromise between socioeconomic considerations and conservation.
Case study 2: Saint Lawrence Estuary, eastern Canada Context This example is a 6000-km2 seascape, encompassing the Saguenay River and a portion of the Saint Lawrence Estuary in Quebec, Canada (Fig. 3). Marine ecosystems of the region are characterized by the regular presence of up to 13 marine mammal species including a threatened population of resident belugas (Delphinapterus leucas) and several migratory whale species such as the endangered North Atlantic Blue whale (Balaenoptera musculus). A whale-watching industry is well established in the region, with over 10,000 whale-watching excursions each year. Conservation concerns led to the creation of a federal marine park in 1998 that covers the core area of whale watching in the estuary (Guénette and Alder 2007). A marine protected area covering a larger portion of the estuary is currently in the proposal stage. The resource system thus consists of the portion of the Saint Lawrence Estuary covered by the Saguenay–Saint Lawrence Marine Park and the proposed Saint Lawrence Estuary Marine Protected Area. These conservation areas are under the jurisdiction of Parks Canada and Fisheries and Oceans Canada, respectively. Both institutions comprise the governance system. In the context of whale watching, whales represent the resource units of the system and the resource users are whale watchers (tourists led by boat captains representing different companies). Fig. 5 and Table 2 describe the main subsystems and variables of the system. Access to the resource units in the marine park is controlled by Parks Canada. The park introduced a permit system in 2002, requiring all commercial whale-watching vessels operating in the park to carry a permit. Regulations imposing speed limits in the vicinity of whales and minimum boat–whale distances were also adopted in 2002. In addition, the park's regulations stipulate the boats must increase their distance from a whale under observation when five or more boats are in the vicinity of the pod. Despite the presence of these regulations, the large size of the system makes it difficult to enforce the law effectively across the entire conservation area and there is considerable concern about the potential impact of human activities on the whale populations. Large boat aggregations around whales may shorten their dives (Michaud and Giard 1998), possibly affecting foraging success and interfering with vital functions. In addition, whales have been observed to maneuver to avoid boats, again potentially interfering with their foraging activities (C. Martins et al., personal communication). Despite these observations, the long-term cumulative impacts on whales are hard to quantify and are not immediately evident. These factors tend to reinforce the status quo in terms of how companies do whale watching. Lastly, there is a high turnover of boat captains, and this lack of stability means that there is very limited transfer of knowledge and environmental awareness amongst captains from one year to the next.
Ecology and Society 17(3): 32 http://www.ecologyandsociety.org/vol17/iss3/art32/
Fig. 5. Conceptual diagram of the social-ecological system of whale-watching activities in the Saint Lawrence Estuary’s conservation areas, based on Ostrom’s framework (Ostrom 2009). The dashed lines encircle parts of the system that are not explicitly included in the model.
(Image credits. Whale cartoon: http://www.wpclipart.com/cartoon/animals/whale/cartoon_whale.png.html. Photo of whale watching boat: J. Normand.) In this case, modeling may help increase understanding of the behaviors of whale-watching captains, and help explore the potential effects of different management scenarios (e.g., new whale-watching regulations) on the dynamics of whalewatching excursions and on the exposure of whales to boats. Emergence Patterns of boat aggregations and excursion dynamics are emergent properties of the system that can directly affect marine mammal exposition. Whale-watching captains communicate and share information via VHF radio to make whale localization and observation easier. This information constitutes the basis of their decision making, which is based on extrinsic factors (e.g., park regulations, vessel operations
guidelines, whale spatial distributions, species abundances) and intrinsic factors (e.g., values, preferences, knowledge, beliefs). Captain decisions underlying excursion dynamics thus emerge from interactions between captains and from the captains’ interactions with the resource system and the resource units, which are constrained by the governance system. Management actions (e.g., increasing surveillance by park wardens) and policy (e.g., introducing new regulations) are thus part of a suite of variables that influence captain behavior and, due to the emergent properties of the system, may not necessarily have the desired effect.
Ecology and Society 17(3): 32 http://www.ecologyandsociety.org/vol17/iss3/art32/
Table 2. Conceptual framework of case study 2: Saint Lawrence Estuary, eastern Canada. Conceptual framework
Saint Lawrence Estuary case study
In the model
Social, economic, and political setting
Government priorities and budget. Laws and regulations (e.g., Species at Risk Act, Oceans Act). Economical crisis affecting tourist demand. Precautionary principle. Free-enterprise principle. Sector: maritime and fluvial. Boundaries: Active marine park and proposed marine protected area limits. Size: 6000 km2. Location: Saint Lawrence Estuary and Saguenay River, Quebec, Canada. Five whale species. Mobility: yes Number of units: species abundance highly variable. Economic value: whale presence drives regional tourism. Whale species spatial and temporal distribution: major driver of whale-watching boat dynamics. Parks Canada and Fisheries and Oceans Canada, supported and informed by NGOs and universities.
Not represented in the model.
Resource system
Resource units
Governance system
Users
Interactions
Outcomes
Related ecosystems
Whale watchers. 12 whale-watching companies. 59 commercial permits. ~10,000 excursions/y. ~300,000 whale-watching tourists/y. 7 to 800 passenger boats. Information sharing between captains (VHF radio). Information sharing between companies and governing institutions. Captain training (e.g., whale ecology, observation regulations) by Parks Canada and NGOs. User conflicts. Lobbying activities. Regulations enforced by park wardens. Whale observation on-board watching boats. Boats–whale co-occurrences. Whale social behaviors. Core areas used by whales. Whale exposure to boats (ecological indicators). Whale-watching excursions performance (indicators related to tourist satisfaction).
Upstream and downstream connected ecosystems of the Saint Lawrence River. Arctic ocean from where an important flow of cold water stems. Climate change affecting water temperature and possibly system productivity.
Model A model was developed to explore the potential emergent responses of the system to different management scenarios. The model explicitly represents the resource system (marine environment), the resource units (whales), and the resource users (whale watchers). The governance system is implicitly
These contextual variables supported the need for such a model and affect managers’ room to maneuver in their decision making.
Modeled explicitly. A set of the spatial environment’s physical attributes is modeled to account for important processes. Data availability also influenced modeling choices at the conceptualization stage. Modeled explicitly.
Modeled indirectly via scenarios provided by the model end-user. Rules of the 2002 regulations on maritime activities in the Marine Park are implemented in 3MTSim. The model supports the testing of new management scenarios. Modeled explicitly. Companies', boats', and captains’ real characteristics are simulated.
Modeled explicitly. In the current version of the model, boats respond to boats, boats respond to whales, whales respond to whales, and whales do not respond to boats.
Modeled explicitly. Since most excursions take place in the marine park dedicated to education and conservation, both social and ecological indicators are monitored in the model. Not represented in the model.
represented in the form of management scenarios (e.g., constraints on captains in the form of regulations) that are input to the model. See Table 2 for more details. The marine environment (extent 6000 km2, resolution 100 m) is represented by spatially explicit representations of
Ecology and Society 17(3): 32 http://www.ecologyandsociety.org/vol17/iss3/art32/
bathymetry and other physical attributes of the estuary (e.g., buoys, lighthouses). The five species of whales most targeted by whale-watching excursions are represented using an individual-based approach. Modeled whales move in threedimensional space and they realistically reproduce known movement patterns (individual level), aggregation patterns (social level), and distribution patterns (population level) (Lamontagne 2009). Three different kinds of actors compose the resource users, namely companies, captains, and tourists. In the model, companies and captains are explicitly represented. Companies offer departures from their homeport according to a planned schedule. Captains are modeled as agents with cognitive abilities developed based on an interview campaign and field observations (Chion et al. 2011). Virtual captains also have a visual module, different kinds of memory, and communication abilities. For different management scenarios, the model simulates the movement of all of the boats and whales in the study area at 10-min time steps for the duration of the May-to-October tourist season. A more detailed overview of the model is given in Parrott et al. (2011). Applications The model is being used as a decision-support tool to test and explore the impact of new management scenarios (e.g., reduction of speed limits, increase in minimum allowable distances between boats and whales, change in the maximum amount of time permitted for the continuous observation of the same whale) on spatiotemporal patterns of whale-watching excursions and on marine mammal exposure to boats. By simulating from the bottom up, the model can provide insight into potential emergent responses of the system, informing conservation area managers about the range of changes to expect. Changes can be documented by monitoring variables such as: the risk of boat–whale collisions, the total time of whale exposure to boats at a given distance, or the total number of co-occurrences between boats and whales within a given radius. Changes relative to whale-watching excursions can also be monitored, such as: total time spent in observation during excursions, the average number of species observed during excursions, or the average number of boats on observation sites. These variables are important indicators, not just for conservation purposes but also for whale-watching companies, and permit an analysis of the relative trade-offs between conservation and economic considerations for each management scenario. Lastly, the model can serve to improve our understanding about the cross-scale relationships between captain decision making and aggregate system properties. Case study 3: Eyre Peninsula, Australia Context The Eyre Peninsula is an 80,000-km2 region in South Australia, 250 km west of the city of Adelaide (Fig. 3). It is bordered to the south, east, and west by the Southern Ocean. The climate of the peninsula varies greatly, according to a south–north gradient, from a Mediterranean-type climate in
the south to a semi-arid climate in the north (where rainfall is highly variable at around 250 mm/y). The economy of the region is primarily based on agriculture, i.e., grain and grazing. The landscape is therefore largely rural. Apart from fields and pasture, the landscape includes 959,000 ha of native vegetation: 729,000 ha are on public land and the remaining 230,000 ha are on privately owned land. The Eyre Peninsula has several native plant and animal species that are threatened, endangered, or vulnerable (Matthews et al. 2001). These species are affected by a variety of factors (Matthews et al. 2001:139), including the connectivity of their habitats, which is related to land-cover change on privately owned land, i.e., clearance of native vegetation for agriculture, fencing of remnant vegetation to protect against grazing, and revegetation through native tree windbreaks or through the use of perennial bush for grazing, etc. A variety of conservation efforts are being carried out on the peninsula to help restore native species habitats. Fig. 6 and Table 3 describe the main components and variables of the Eyre Peninsula’s socialecological system. Biodiversity, supported by habitats of connected patches of remnant vegetation (the resource units of the social-ecological system as shown in Fig. 6), is the focus of this case study. The conservation and maintenance of biodiversity on the Eyre Peninsula is a growing preoccupation, particularly in a context of climate change scenarios that forecast decreased and more variable rainfall, which will put pressure on already stressed ecosystem services. Conserving and augmenting biodiversity in the region may provide increased ecological resilience in the landscape and augment the capacity of ecological systems on the peninsula to adapt to environmental change. Biodiversity on the Eyre Peninsula partly depends on the protection and improvement of the many and scattered native vegetation patches on privately owned land; however, farmers and other landowners on the Eyre Peninsula have different views of the importance of conserving biodiversity (Ward and MacDonald 2009). Hence, biodiversity conservation faces a number of challenges, which means that project managers and officers must develop innovative programs that take into account environmental and socioeconomic constraints, i.e. native saltbush for grazing, planting native trees as wind barriers, etc. Emergence Both the social and ecological subsystems of the Eyre Peninsula may exhibit emergent properties. The governance system, for example, is composed of many actors belonging to a variety of agencies, groups, or organizations, i.e., governmental agencies, universities and research centers, farmers' groups, etc. These actors interact with each other in many ways, such as through information-sharing or other cooperation, in order to best manage the ecological subsystem. The way these interactions occur between heterogeneous actors leads to the emergence of social structural patterns at higher hierarchical scales. These emergent patterns can exhibit
Ecology and Society 17(3): 32 http://www.ecologyandsociety.org/vol17/iss3/art32/
Fig. 6. Conceptual diagram of the social-ecological system of the Eyre Peninsula, South Australia, based on Ostrom’s framework (Ostrom 2009).
features considered important for a robust and adaptive governance system. A high social capital, for instance, emerges from the density of interactions at the level of individuals, and is often related to the capacity of individuals to organize in order to better manage natural resources (Crona 2006:135–155). Similarly, the number and nature of influential actors, which may affect the robustness and adaptive capacity of the governance system (Crona 2006), emerge from each individual’s level of centrality. The centrality of an individual relates to his/her capacity to connect, on his/her own scale, more individuals than average within the system. Thus each individual’s level of influence within the system is a function of the connectedness of the other individuals in the system, and the flow of information through the social network is the emergent result of all of these interconnections. In the resource system, individual patches
of vegetation are linked to each other to form a network of habitat connectivity. The structure and dynamics of the habitats of threatened, endangered, or vulnerable species emerges from the local interactions of the individual patches. For both the social and ecological subsystems, individual interactions need to be explicitly taken into account to learn about the emerging structural qualities of each of the subsystems. Model summary A model has been developed to explore the resilience and adaptive capacity of the Eyre Peninsula region relative to a series of potential changes. The governance system, resource users, and resource units of the system are explicitly modeled using a network approach (Prell et al. 2009, Cumming 2011). The network of interactions between governance system agencies and users, i.e., information sharing, co-participation
Ecology and Society 17(3): 32 http://www.ecologyandsociety.org/vol17/iss3/art32/
Table 3. Conceptual framework of case study 3: Eyre Peninsula, South Australia. Conceptual framework
Eyre Peninsula case study
In the model
Social, economic, and political Economic development of the region. setting Government resource policies (Natural Resource Management Act and plan). Resource system Sector: agriculture. System boundaries: agricultural part of the Eyre Peninsula, South Africa. Productivity of system: capacity of the system to sustain economy and, in our case study, a healthy population of endangered native plants and animals. Resource units Units of land (suitable or not, to sustain healthy native species population).
Governance system
Users
Interactions
Outcomes
Natural resource management agencies. Local governments. NGOs. Special interest groups. Farmers (whose livelihood mainly comes from cereal crops and/or livestock).
Modeled implicitly as context and motivation for the project.
Modeled explicitly: the model includes the resource system as a network of land-units suitable to sustain a selection of important native species. These resources are modelled as a habitat connectivity network.
Modeled explicitly: each land unit is mapped and is part of the landscape connectivity network according to its cover (native vegetation or not). Their nature (remnant vegetation patches, perennials for agriculture, etc.), spatial distributions, and size are taken into account. Modeled explicitly: some natural resource management, local governments, and state agencies are selected as part of a biodiversity conservation programs network.
Modeled explicitly: farmers are modelled as intermediaries between the governance system and the resource units. Their number, socioeconomic attributes, locations, and knowledge of the system are taken into account. Management of native vegetation by farmers on their Some interactions are explicitly included in the model. Within land. the governance system (modelled as a network): natural Information sharing among farmers. resource management and NGO personnel, farmers, etc. Information sharing among natural resource management exchange information and collaborate on promotion and/or personnel. implementation of biodiversity conservation programs. Conflicts among and/or between farmers (as individuals Within the resource system (also modelled as a network), or groups) and natural resource management personnel. interactions include seed dispersal and capacity of animals to Promotion of conservation programs. migrate from one patch to another (both a function of distance Lobbying activities regarding conservation programs. and landscape features between two patches). Self-organizing activities (mainly at the farmer level). Between the governance and resource systems, the users Networking activities. (farmers) act as intermediaries by deciding on the extent to Etc. implement biodiversity conservation programs. Ecological performance measures (biodiversity, resilience, Modeled explicitly: structural indices related to resilience are etc.). calculated from the patterns of interactions described above.
in program promotion, and/or implementation efforts, is mapped from a series of interviews. In this network, each actor (individual or agency) is a node and their interactions are edges. For the resource system, satellite remote sensing is used to identify the significant native vegetation patches of the region (resource units). Links are established thereafter between patches, according to the maximum dispersal distance of a selection of animal and plant species, to form a habitat network. As resource units (native vegetation patches) and resources users (farmers) are spatially located, both networks can then be connected. In this coupled social-ecological network, the governance network influences individual resource users, who in turn affect resource units, which in turn affect the resource system. As a consequence, changes in the social subsystem (removal of nodes or edges) may spread to the ecological system and affect habitat connectivity. How these perturbations spread through the networks and how they affect its resilience may then be analyzed through a series of structural metrics (see Gonzalès and Parrott 2012 for a short review).
Unlike the two previous examples, this model does not have a dynamic component. However, in a future version, the dynamics of actors may be modeled using an agent-based approach, and the resource units may also be modeled using a spatial land-use model. These components can then be interlinked with the network to permit the evolution of the social-ecological network over time and to facilitate the exploration of certain “what-if” scenarios. Applications The model can be applied to better understand and identify the structural characteristics leading to both robustness and adaptability in the coupled governance and resource systems. With relatively simple analyses, this social-ecological model can quickly help identify which resource units are more important to landscape-level habitat connectivity or, in a context of climate change, which resource units are the most threatened. Knowing this, the coupled model can help identify where, within the governance system, more intensive management initiatives should be put in order to protect these
Ecology and Society 17(3): 32 http://www.ecologyandsociety.org/vol17/iss3/art32/
areas first. Similarly, the model can, by identifying gaps in the connectivity of the governance network, or by pinpointing areas of the network where too few actors control access to a disproportionate amount of information, help focus efforts to better share information and collaborate within, and among, agencies. Importantly in the context of this case study, this model can identify actors that strongly connect program managers with resource users, and inform governance initiatives that could help provide information to resource users more efficiently in order to encourage them to participate in biodiversity-protection programs. Finally, another set of analyses can help explore the nonlinear responses of the system by identifying which node or link removals would spread perturbations the farthest across the governance and habitat networks. Building upon the same ideas, this approach can help explore “what-if” scenarios where nodes and/or links might be added or removed from the system. Such scenarios, which would take advantage of the bottom-up approach of this model to tackle questions that would be difficult to answer using more standard methods, might include: What if a state agency was to curb its efforts in biodiversity conservation on the Eyre Peninsula? How would the disturbance caused by the removed nodes within the governance system spread through the ecological network and impact the robustness and adaptive capacity of the social-ecological system? How, on the other hand, would an increase in funding towards local initiatives help build social capital at the community level? How, in turn, would this new higher density of interactions in one small part of the network spread across organizational scales and affect both the structural qualities of the whole governance network and of the habitat? Many scenarios and analyses of this sort can be explored to take advantage of the bottom up, nonlinear aspect of the system, and tackle questions that would have been difficult to answer with more standard methods. When the analyses and scenarios are carefully formulated to fit a population's needs, this kind of model can contribute to the development of climate change adaptation strategies as well as inform stakeholders on how to best implement management and planning programs so as to create a more resilient regional landscape. DISCUSSION We have described three case studies in which bottom-up, hybrid modeling approaches are used to improve our understanding and analytical capacity for managing landscapes as complex social-ecological systems. Bottom-up modeling is one approach that permits the explicit consideration of cross-scale interactions, emergence, and nonlinearity when analyzing and characterizing the structure and dynamics of landscapes. These three case studies show three different ways in which the overall approach of bottom-up modeling can be
implemented to study a regional system. The choice of how to implement the approach, what to model, and in what detail, depended on the problem being studied and the available data. In the first two case studies, objects representing human and biophysical components, e.g., boats, whales, and forest mammals, interact in a realistic, spatially explicit environment. Their collective behavior gives rise to emergent patterns and processes on the landscape, e.g., animal home ranges, “hotspots” of boat activity, which in turn feedback to modify the behavior of individuals. In the third case study, human and ecological components of the system are modeled as spatially located, interacting nodes in a network. The network representation allows a detailed study of emergent modularity and other structural properties that are important for system sustainability (Gonzalès and Parrott 2012). To simplify the modeling process, in all three cases, policy and management scenarios for conservation are implemented by the end-user of the model via an interface with the model. The dynamic of the governance process that leads to policy development, and the feedback between system outcomes and new policy and management scenarios, are thus not explicitly modeled. The scenarios proposed by an end-user serve to constrain the behavior of individual components—e.g., caribou movement on a recently harvested landscape will be modified; whale-watching tour boats must respect regulations regarding speed limits and approach distance while in the presence of marine mammals; a new land-use policy requires the conservation of native flora and fauna on 20% of all privately owned land—thus affecting not only individual decisions but also the nature of the patterns and processes that emerge. In this way, the end-user can explore how different interventions influencing individual-level behavior are manifested in the patterns and processes that emerge on the landscape. This exercise may ultimately lead to hypothesis building about the mechanisms behind observed patterns on the landscape and to reverse engineering experiments in which one attempts to find the appropriate set of policies, regulations, or direct interventions that give rise to a desired outcome at the landscape scale. While the models described here are, like every model, caricatures of the real systems, they are also heavily grounded in empirical data. In our experience, the strong link to data, used for model development, calibration, and validation, leads to relatively realistic representations of the phenomena being studied and instills confidence in the model end-users. However, the data required to build a good bottom-up model is not always available, and this can limit the general applicability of the approach. Additional challenges in bottomup modeling include the length of time required to build and validate a good model and the problem of maintaining the model (through addition of new data) so that it can have a usable lifetime extending over multiple years. Lastly, a model intended for application in natural resource management needs
Ecology and Society 17(3): 32 http://www.ecologyandsociety.org/vol17/iss3/art32/
to be pertinent to the people who will use it. The participation and contribution of end-users to building the model is essential to ensure that it will be useful and answer the right questions at the end. These last considerations are likely true for any applied modeling exercise and not just for bottom-up modeling. A bottom-up model, built in collaboration with resource users and representatives from the governance system, can contribute to increased understanding of the dynamics of the resource units and resource system. It is thus an appropriate tool to harness when seeking to facilitate the self-organization of sustainable resource management within a social-ecological system. Many of the variables that Ostrom identified as being necessary for sustainable management are also necessary precursors to a successful model-building project: clearly defined system boundaries and quantifiable states of the resource units, for example. We would add to this list model end-users who are heavily involved in model creation and clearly defined modeling objectives. Lastly, once completed, the model itself becomes a repository of knowledge about the system that surpasses the understanding of any one individual and that can be communicated and shared amongst all resource users. CONCLUSION The literature repeatedly calls for the need to consider that processes and functions on a landscape are the result of multiple interactions and feedbacks across scales of space, time, and organization (Liu et al. 2007b, Ryan et al. 2007, Cumming et al. 2010, Cumming 2011). Cross-scale interactions, in the form of landscape pattern that affects individual movement patterns, institutional policies that affect navigational patterns, or governance systems that emerge from individual initiatives, are evident in all three of the case studies described here. In each case, bottom-up modeling provides a way of representing components at one or more scales of interest and of allowing cross-scale interactions to emerge within a simulation. In addition to interactions across scales, Ostrom and others have emphasized the importance of interactions between key ecological (resource system, resource units) and social components (governance system, resource users) for understanding the dynamics of complex social-ecological systems (Dietz et al. 2003, Norberg and Cumming 2008, Ostrom 2009). The hybrid models we describe explicitly include these interactions, in the form of management interventions that affect the natural environment or in the form of explicit modeling of users and their patterns of resource use. All three case studies contribute to increased understanding of the studied system and permit the simulation of alternate future scenarios. Given the uncertainty involved in predicting the dynamics of complex systems, we propose that landscape futures should be studied in terms of envelopes of probable
future states (Parrott and Meyer 2012) and that policy makers should make decisions designed to maintain the landscape within a desired envelope. Because they simulate emergence, bottom-up models can be used to identify the boundaries of these envelopes, within the limits of our knowledge and understanding of the system, and our ability to represent this knowledge in a model. Even so, the black swan theory (Taleb 2011) teaches us that rare, highly improbable outlier events have a disproportionate impact on the dynamics of a system, and are often responsible for completely redirecting its future trajectory. Such events cannot be predicted using known system properties, and the probability of recreating a black swan event in a model that also occurs in the future real world is extremely unlikely. However, bottom-up models can simulate the response of a system to an imposed “black swan” and can provide insight into which kinds of landscape structure and configuration are best adapted to dealing with such events. Bottom-up models are easy to understand and communicate, and stakeholders can often be directly involved in model building by contributing to the elaboration of model assumptions and behavioral rules for entities in the model, by proposing scenarios to be studied, and by contributing to interpreting and communicating simulation outcomes. This type of participatory modeling is gaining popularity as a way of helping stakeholders understand the complex dynamics of the system in which they intervene (Videira et al. 2003). Stakeholder engagement in the model-building process also ensures that the model responds to the needs of end-users and adequately incorporates multiple perspectives and conceptual models of the real system (Hare et al. 2003, Prell et al. 2007). In our experience with the three case studies described here, the model-building process also contributes to synthesizing and consolidating knowledge and information about a system, and to identifying gaps in our understanding. In this way, the model-building process contributes to knowledge sharing amongst stakeholders, which is one of the key criteria behind successful comanagement of a regional landscape (Armitage et al. 2008). Hybrid, bottom-up modeling is thus a key tool for landscape science that will likely continue to be used to inform management and planning in a wide range of natural resource management contexts. Responses to this article can be read online at: http://www.ecologyandsociety.org/vol17/iss3/art32/ responses/
LITERATURE CITED Armitage, D. R., R. Plummer, F. Berkes, R. I. Arthur, A. T. Charles, I. J. Davidson-Hunt, A. P. Diduck, N. C. Doubleday, D. S. Johnson, and M. Marschke. 2008. Adaptive comanagement for social-ecological complexity. Frontiers in
Ecology and Society 17(3): 32 http://www.ecologyandsociety.org/vol17/iss3/art32/
Ecology and the Environment 7:95-102. http://dx.doi.org/10.1 890/070089 Becu, N., P. Perez, A. Walker, O. Barreteau, and C. Le Page. 2003. Agent based simulation of a small catchment water management in northern Thailand: description of the CATCHSCAPE model. Ecological Modelling 170:319-331. http://dx.doi.org/10.1016/S0304-3800(03)00236-9
Crona, B. 2006. Of mangroves and middlemen: a study of social and ecological linkages in a coastal community. Department of Systems Ecology, Stockholm University, Stockholm, Sweden. Cumming, G. S. 2011. Spatial resilience in social-ecological systems. Springer, Dordrecht, Netherlands. http://dx.doi.org/1 0.1007/978-94-007-0307-0
Berger, T. 2001. Agent-based spatial models applied to agriculture: a simulation tool for technology diffusion, resource use changes and policy analysis. Agricultural Economics 25:245-260. http://dx.doi.org/10.1111/j.1574-086 2.2001.tb00205.x
Cumming, G. S., Ö. Bodin, H. Ernstson, and T. Elmqvist. 2010. Network analysis in conservation biogeography: challenges and opportunities. Diversity and Distributions 16:414-425. http://dx.doi.org/10.1111/j.1472-4642.2010.00651. x
Bonnell, T., R. Sengupta, C. Chapman, and T. Goldberg. 2010. An agent-based model of red colobus resources and disease dynamics implicates key resource sites as hot spots of disease transmission. Ecological Modelling 221:2491-2500. http://dx. doi.org/10.1016/j.ecolmodel.2010.07.020
Deadman, P., D. Robinson, E. Moran, and E. Brondizio. 2004. Colonist household decisionmaking and land-use change in the Amazon rainforest: an agent-based simulation. Environment and Planning B 31:693-710. http://dx.doi.org/10 .1068/b3098
Bradbury, R. 2002. Futures, predictions and other foolishness. Pages 48-62 in M. Janssen, editor. Complexity and ecosystem management. Edward Elgar Publishing, Cheltenham, UK.
Dietz, T., E. Ostrom, and P. Stern. 2003. The struggle to govern the commons. Science 302:1907.
Brondizio, E. S., E. Ostrom, and O. R. Young. 2009. Connectivity and the governance of multilevel socialecological systems: the role of social capital. Annual Review of Environment and Resources 34:253-278. http://dx.doi.org/ 10.1146/annurev.environ.020708.100707 Bryan, B., N. Crossman, D. King, and W. Meyer. 2011. Landscape futures analysis: assessing the impacts of environmental targets under alternative spatial policy options and future scenarios. Environmental Modelling & Software 26:83-91. http://dx.doi.org/10.1016/j.envsoft.2010.03.034 Carpenter, S. R., and L. H. Gunderson. 2001. Coping with collapse: ecological and social dynamics in ecosystem management. BioScience 51:451-457. http://dx.doi.org/10.16 41/0006-3568(2001)051[0451:CWCEAS]2.0.CO;2 Chion, C., P. Lamontagne, S. Turgeon, J.-A. Landry, L. Parrott, D. Marceau, C. C. A. Martins, R. Michaud, N. Ménard, G. Cantin, and S. Dionne. 2011. Eliciting cognitive processes underlying patterns of human–wildlife interactions for agentbased modeling. Ecological Modelling 222:2213-2226. http:/ /dx.doi.org/10.1016/j.ecolmodel.2011.02.014 Crawford, T. W., J. P. Messina, S. M. Manson, and D. O'Sullivan. 2005. Complexity science, complex systems, and land-use research. Environment and Planning B: Planning and Design 32:792-798. http://dx.doi.org/10.1068/b3206ed Creel, S., J. Winnie Jr, B. Maxwell, K. Hamlin, and M. Creel. 2005. Elk alter habitat selection as an antipredator response to wolves. Ecology 86(12):3387–3397. http://dx.doi.org/10.1 890/05-0032
Folke, C. 2006. Resilience: the emergence of a perspective for social-ecological systems analyses. Global environmental change 16:253-267. http://dx.doi.org/10.1016/j.gloenvcha.20 06.04.002 Fortin, D., H. Beyer, M. Boyce, D. Smith, T. Duchesne, and J. Mao. 2005. Wolves influence elk movements: behavior shapes a trophic cascade in Yellowstone National Park. Ecology 86(5):1320–1330. http://dx.doi.org/10.1890/04-0953 Gonzalès, R., and L. Parrott. 2012. Network theory in the assessment of the sustainability of social-ecological systems. Geography Compass6:76-88. http://dx.doi.org/10.1111/j.174 9-8198.2011.00470.x Gross, J., R. McAllister, N. Abel, D. Smith, and Y. Maru. 2006. Australian rangelands as complex adaptive systems: a conceptual model and preliminary results. Environmental Modelling & Software 21:1264-1272. http://dx.doi.org/10.1016/ j.envsoft.2005.04.024 Guénette, S., and J. Alder. 2007. Lessons from marine protected areas and integrated ocean management initiatives in Canada. Coastal Management 35:51-78. http://dx.doi.org/1 0.1080/10.1080/08920750600970578 Hare, M., R. Letcher, and A. Jakeman. 2003. Participatory modelling in natural resource management: a comparison of four case studies. Integrated Assessment 4:62-72. http://dx.do i.org/10.1076/iaij.4.2.62.16706 Harris, G. 2007. Seeking sustainability in an age of complexity. Cambridge University Press, Cambridge, UK. http://dx.doi.o rg/10.1017/CBO9780511815140
Ecology and Society 17(3): 32 http://www.ecologyandsociety.org/vol17/iss3/art32/
Holling, C., and G. Meffe. 1996. Command and control and the pathology of natural resource management. Conservation Biology 10:328-337. http://dx.doi.org/10.1046/j.1523-1739.1 996.10020328.x James, A., S. Boutin, D. Hebert, A. Rippin, and J. White. 2004. Spatial separation of caribou from moose and its relation to predation by wolves. Journal of Wildlife Management 68 (4):799–809. http://dx.doi.org/10.2193/0022-541X(2004)068 [0799:SSOCFM]2.0.CO;2 James, A., and A. Stuart-Smith. 2000. Distribution of caribou and wolves in relation to linear corridors. Journal of Wildlife Management 64(1):154–159. http://dx.doi.org/10.2307/3802985 Kuzyk, G. W. 2002. Wolf distribution and movements on caribou ranges in west-central Alberta. M.Sc. thesis. Wildlife Ecology and Management, Department of Renewable Resources, University of Alberta, Edmonton, Alberta, Canada. Lamontagne, P. 2009. Modélisation spatio-temporelle orientée par patrons avec une approche basée sur individus [A spatially-explicit individual-based model using the patternoriented approach]. M.Eng. thesis. École de technologie supérieure, Montréal, Quebec, Canada. Levin, S. 1998. Ecosystems and the biosphere as complex adaptive systems. Ecosystems 1:431-436. http://dx.doi.org/10 .1007/s100219900037 Lewis, M., K. White, and J. Murray. 1997. Analysis of a model for wolf territories. Journal of Mathematical Biology 35:749-774. http://dx.doi.org/10.1007/s002850050075 Liu, J., T. Dietz, S. R. Carpenter, M. Alberti, C. Folke, E. Moran, A. N. Pell, P. Deadman, T. Kratz, J. Lubchenco, and others. 2007a. Complexity of coupled human and natural systems. Science 317:1513-1516. Liu, J., T. Dietz, S. R. Carpenter, C. Folke, M. Alberti, C. L. Redman, S. H. Schneider, E. Ostrom, A. N. Pell, J. Lubchenco, and others. 2007b. Coupled human and natural systems. AMBIO: A Journal of the Human Environment 36:639-649. Mangel, M., and C. Clark. 1986. Towards a unified foraging theory. Ecology 16(5):1127–1138. http://dx.doi.org/10.2307/ 1938669 Manson, S. 2006. Land use in the southern Yucatan peninsular region of Mexico: scenarios of population and institutional change. Computers, Environment and Urban Systems 30:230-253. http://dx.doi.org/10.1016/j.compenvurbsys.2005.01.009 Matthews, E., A. Oppermann, and R. W. Inns. 2001. Biodiversity plan for the Eyre Peninsula, South Australia. Department for Environment and Heritage, South Australia, Australia.
Matthews, R., N. Gilbert, A. Roach, J. Polhill, and N. Gotts. 2007. Agent-based land-use models: a review of applications. Landscape Ecology 22:1447-1459. http://dx.doi.org/10.1007/ s10980-007-9135-1 Michaud, R., and J. Giard. 1998. Les rorquals communs et les activités d’observation en mer dans l’estuaire maritime du Saint-Laurent entre 1994 et 1996 : 2. Évaluation de l’impact des activités d’observation en mer sur le comportement des rorquals communs. Group for Education and Research on Marine Mammals (GREMM), Tadoussac, Quebec, Canada. Moreno, N., R. Quintero, M. Ablan, R. Barros, J. D'vila, H. Ramirez, G. Tonella, and M. F. Acevedo. 2007. Biocomplexity of deforestation in the Caparo tropical forest reserve in Venezuela: an integrated multi-agent and cellular automata model. Environmental Modelling & Software 22:664-673. http://dx.doi.org/10.1016/j.envsoft.2005.12.022 Mysterud, A., and R. Ims. 1998. Functional responses in habitat use: availability influences relative use in trade-off situations. Ecology 79(4):1435–1441. Norberg, J., and G. S. Cumming, editors. 2008. Complexity theory for a sustainable future. Columbia University Press, New York, New York, USA. Ostrom, E. 2009. A general framework for analyzing sustainability of social-ecological systems. Science 325:419-422. http://dx.doi.org/10.1126/science.1172133 Ostrom, E., J. Burger, C. Field, R. Norgaard, and D. Policansky. 1999. Revisiting the commons: local lessons, global challenges. Science 284:278. http://dx.doi.org/10.1126/ science.284.5412.278 Parker, D. C., S. M. Manson, M. A. Janssen, M. J. Hoffmann, and P. Deadman. 2003. Multi-agent systems for the simulation of land-use and land-cover change: a review. Annals of the Association of American Geographers 93:314-337. http://dx. doi.org/10.1111/1467-8306.9302004 Parrott, L. 2002. Complexity and the limits of ecological engineering. Transactions of the ASAE 45:1697-1702. Parrott, L., C. Chion, C. C. A. Martins, P. Lamontagne, S. Turgeon, J. A. Landry, B. Zhens, D. J. Marceau, R. Michaud, G. Cantin, N. Ménard, and S. Dionne. 2011. A decision support system to assist the sustainable management of navigation activities in the Saint Lawrence River Estuary, Canada. Environmental Modelling & Software 26:1403-1418. Parrott, L., and W. Meyer. 2012. Future landscapes: managing within complexity. Frontiers in Ecology and the Environment. [online] URL:http://www.esajournals.org/doi/pdf/10.1890/110082 .
Ecology and Society 17(3): 32 http://www.ecologyandsociety.org/vol17/iss3/art32/
Prell, C., K. Hubacek, and M. Reed. 2009. Stakeholder analysis and social network analysis in natural resource management. Society & Natural Resources 22:501-518. http: //dx.doi.org/10.1080/08941920802199202 Prell, C., K. Hubacek, M. Reed, C. Quinn, N. Jin, J. Holden, T. Burt, M. Kirby, and J. Sendzimir. 2007. If you have a hammer everything looks like a nail: traditional versus participatory model building. Interdisciplinary Science Reviews 32:263-282. Proffitt, K., J. Grigg, K. Hamlin, and R. Garrott. 2009. Contrasting effects of wolves and human hunters on elk behavioral responses to predation risk. Journal of Wildlife Management 73(3):345–356. http://dx.doi.org/10.2193/2008-210 Ryan, J. G., J. A. Ludwig, and C. A. Mcalpine. 2007. Complex adaptive landscapes (CAL): a conceptual framework of multifunctional, non-linear ecohydrological feedback systems. Ecological Complexity 4:113-127. http://dx.doi.org/10.1016/ j.ecocom.2007.03.004 Schaefer, J. A. 2003. Long-term range recession and the persistence of caribou in the taiga. Conservation Biology 17:1435-1439. http://dx.doi.org/10.1046/j.1523-1739.2003.02288. x Schlüter, M., and C. Pahl-Wostl. 2007. Mechanisms of resilience in common-pool resource management systems: an agent-based model of water use in a river basin. Ecology and Society 12(2):4. [online] URL:http://www.ecologyandsociety. org/vol12/iss2/art4/. Seely, B., J. Nelson, R. Wells, B. Peter, M. Meitner, A. Anderson, H. Harshaw, S. Sheppard, F. Bunnell, and H. Kimmins. 2004. The application of a hierarchical, decisionsupport system to evaluate multi-objective forest management strategies: a case study in northeastern British Columbia, Canada. Forest Ecology and Management 199:283-305. http: //dx.doi.org/10.1016/j.foreco.2004.05.048 Taleb, N. N. 2011. The black swan: the impact of the highly improbable. Random House Inc., New York, New York, USA. Thompson, I. D., J. A. Baker, and M. Ter-Mikaelian. 2003. A review of the long-term effects of post-silviculture on vertebrate wildlife, and predictive models, with an emphasis on boreal forests in Ontario, Canada. Forest Ecology and Management 177:441-469. http://dx.doi.org/10.1016/S0378-1127 (02)00453-X Van Moorter, B., D. Visscher, S. Benhamou, L. Börger, M. Boyce, and J. Gaillard. 2009. Memory keeps you at home: a mechanistic model for home range emergence. Oikos 118:641-652. http://dx.doi.org/10.1111/j.1600-0706.2008.17003. x
van Oel, P., M. Krol, A. Hoekstra, and R. Taddei. 2010. Feedback mechanisms between water availability and water use in a semi-arid river basin: A spatially explicit multi-agent simulation approach. Environmental Modelling & Software 25:433-443. http://dx.doi.org/10.1016/j.envsoft.2009.10.018 Videira, N., P. Antunes, R. Santos, and S. Gamito. 2003. Participatory modelling in environmental decision-making: the ria Formosa natural park case study. Journal of Environmental Assessment Policy and Management 5:421-447. http://dx.doi.org/10.1142/S1464333203001371 Walker, B., C. S. Holling, S. R. Carpenter, and A. Kinzig. 2004. Resilience, adaptability and transformability in social– ecological systems. Ecology and Society 9(2):5. [online] URL: http://www.ecologyandsociety.org/vol9/iss2/art5/. Ward, J., and D. H. MacDonald. 2009. Encouraging landholder participation in natural resource incentive programs on the Eyre Peninsula. CSIRO Land and Water— Society Economy and Policy, CSIRO Land and Water Policy and Economics Research Unit, Glen Osmond, South Australia, Australia. Wittmer, H., B. Mclellan, R. Serrouya, and C. Apps. 2007, Changes in landscape composition influence the decline of a threatened woodland caribou population. Ecology 76:568– 579.