Modeling of a multimodal image aggregation process using discrete geometry Julien Montagner
ERIM Faculty of Medicine, BP 38 28 place Henri Dunant 63001 Clermont-Fd Cedex 1, France +33 4 73 17 81 23
[email protected]
Vincent Barra
LIMOS Scientific complex, Les Cézeaux 63117 Aubière Cedex, France +33 4 73 40 77 68
[email protected]
Jean-Yves Boire
ERIM Faculty of Medicine, BP 38 28 place Henri Dunant 63001 Clermont-Fd Cedex 1, France +33 4 73 17 81 23
[email protected]
ABSTRACT In order to help clinicians with the diagnosis of neurodegenerative diseases, we provide a synthetic functional information located in relation with anatomical structures. The final image is processed by multimodal data fusion between SPECT and MR images. We propose a new method for the management of such multiresolution data, in which a geometrical model allows an accurate correspondence of voxels from both images, while preserving at best both original pieces of information. We use this matching method to replace the interpolation step in the compulsory image registration of the data fusion process. The geometrical model is first built from registration parameters. Computational geometry algorithms, applied to this model, allow the computation of numerical values used to process the final information. The method has been applied to brain perfusion and neurotransmission SPECT images. KEYWORDS Medical image processing, Synthetic functional image, Multimodal data fusion, Multiresolution data, Geometrical model
1. Introduction In the context of brain study, considering the central function and the position of this organ, medical images are the primary tool for clinical investigation. Images of this kind provide models of either anatomical structures or functional activities. Parkinsonian syndromes and Alzheimer’s disease are both qualified by an abnormal death of neuronal cells, in the upper part of the brainstem in the first case [Blandini et al. 2000], and at least in particular regions of the cerebral cortex in the second case [Rusinek et al. 1991]. The major physiological consequences of this decrease in nervous cells population are: a lack of dopamine in the striatum for Parkinson’s disease, involving automatic movement disorders, and a decrease in blood supply in the affected regions for Alzheimer’s disease, representative of the low neuronal activity. Both neurotransmission phenomenon and brain perfusion are classically observed on single photon emission computed tomography (SPECT) images. This modality provides 3D data sets in which numerical activities may be linked with e.g. interneuronal exchanges or neurons blood supply, depending on the used radiotracer [Brooks 2004]. Recently, new preventive treatments appeared for neurodegenerative pathologies, such as Alzheimer or Parkinson’s diseases. They require an early detection of the denervation. Despite numerous compulsory corrections applied to SPECT data during the tomographic reconstruction [Soret et al. 2003], the functional information they provide keep a low spatial resolution, which hinders the study of neuronal activity within small anatomical structures (figure 1). The visual information brought by the classical multimodal approach (investigation of the MR image / SPECT image couple) are thus not sufficient to draw a conclusion in the early stages of the pathology. We propose here to provide new diagnosis elements by the synthesis of an image holding both functional and anatomical data. The anatomical part is brought by a magnetic resonance (MR) image, as in the classical multimodal approach. Nevertheless, automatic image processing makes it possible to bring out data which were not obviously visible in original images, and allows multimodal images matching by means of data fusion. In most of software applications managing multimodal medical images, the image fusion is limited to a superimposed display of e.g. MR and SPECT images, with different color scales (gray levels are more prevalent to display MR data). In this case, information combination concerns color models derived from numerical activities associated with image voxels.
1
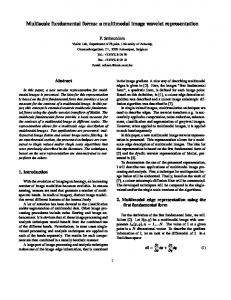
Caudate nuclei Putamens Striatum Cerebral cortex Axial cut of the brain
MR image (axial slice)
Neurotransmission and brain perfusion SPECT images (axial slices)
Figure 1. Schematic view, MR and SPECT images of brain structures involved in Parkinson’s and Alzheimer diseases On the contrary, we intend to compute a new information from MR and SPECT images, designed to be as close as possible to original numerical data. This fusion method was first used in the context of functional activity quantitation [Montagner et al. 2005]. It consists in replacing the registration step of the fusion process by the managing of spatial features (differences in orientation, position, and voxel sizes, due to differences in spatial resolution of acquisition equipments) of both images thanks to a geometrical model (tilling of the space by cubic models of the voxels). The main idea is to delay the modification of original activities until the final aggregation step of the fusion process. Original activities are then used, in combination with geometrical information extracted from the model, to compute the numerical values associated with voxels of the synthetic image (at the spatial resolution of the MR image). The idea of delaying the computations until the information quantity is sufficient, e.g. to take a decision or to reach the required accuracy, has previously been introduced in our work about image fusion, by the use of fuzzy logic to model the semantic part of the information [Barra Boire 2001]. Therefore, during the final step of the fusion process, the geometrical model is aggregated with the fuzzy one to generate the synthetic image. In the following, we first place our fusion process in the general context of multimodal medical image display. The method itself is then explained, from the extraction of registration parameters to the aggregation models used to create the final image. The fuzzy information model is only briefly presented, since the real contribution of this work concerns the geometrical model. This model and the algorithm used to compute the geometrical information are thus detailed. Finally, the fusion process is applied to brain perfusion and neurotransmission SPECT images, and these results are discussed.
2. Combination of anatomical and functional information As mentioned above, the image fusion process is not restricted to a combined display of both information sources. The general aim is to extract or emphasize diagnosis elements, not only intended to a visual perception. The application we propose in the following aims at providing a localized quantitative functional information, dedicated to the diagnosis of a given disease (e.g. directly showing hypoperfused gray matter). Processing a synthetic image from this new information is only one among the possible goals of the fusion process. The information we compute is a quantitative value relative to the functional activity, located in relation with the voxels of the anatomic image (the functional activity is redistributed within these voxels). The visual presentation of this information is obtained thanks to an aggregation with data of anatomical classes. The common part of every multimodal data integration process is a preliminary registration step. During this step, at least one of the original data sets is transformed in order to give the same coordinates, on both images, to an anatomical location. As a consequence, a brain structure is finally represented by two voxel sets with similar size, position and orientation. Once the images are aligned, integration processes have different ways to display the data: using gray levels or color models, in 2D or 3D, considering high level shape models or just numerical activities. The major difference we distinguish between these processes concerns their tendency to present the information through transformed data sets or thanks to data as close to the original values as possible. The synthetic image we process from original 3D data sets is presented as a collection of 2D images called slices. Therefore, we will only make below a brief presentation of 2D rendering techniques in order to give evaluation elements for the proposed method.
2.1. Combination modes
The selective slice by slice display of two combined medical images consists in drawing, on one of the images, either an entire part of the other one (e.g. a square window), or geometrical features extracted from the other (e.g. geometrical curves, region edges, level lines [Condon 1991]). The non-selective display consists in a global mixture of both data sets. When using a SPECT image for medical diagnosis, the maximal part of the functional information should be preserved [Stokking 1998]. 2
Display techniques for medical images are based on color models (e.g. variations of a hue) associated with either numerical activities or features processed from these activities. In a multimodal context, each image provides pieces of information which the other lacks. The quality of visual perception is an additional constraint. This quality depends on the image ability to emphasize relevant information (for the diagnosis) [Kundel 1990]. The interpretation of anatomical information is essentially linked to image outlines (i.e. strong activity gradients). In the case of a functional information, the important image features are large activity variations (within implicit anatomical structures).
2.2. Combination of color models
Main non-selective display modes are: arithmetical processing from numerical activities of the image (figure 2), and the association of some image features with color channels (e.g. RGB or HSV, possibly with an additional “alpha” channel for the management of transparency). The combined information may be confused when the multimodal data to integrate are both complex, or when they present many overlapping regions [Hill 1993]. The efficiency of color combination techniques decreases when the number of features to represent increases. In this case, it becomes necessary to use an advanced fusion strategy, as in the proposed method.
Original MR image
Registered SPECT image
MR data: gray levels SPECT data: “rainbow” palette
Combination of HSV models
Combination of RGB models
Figure 2. Non-selective combination of color models
2.3. Synthesis of a dedicated medical information
The image synthesis process presented in this paper belongs to the class of non-selective display methods. The redistributed functional activity may be considered as directly linked with the physical phenomenon measured in the SPECT image. The image fusion process allows reducing the complexity of the anatomical information, to emphasize the functional one. Since the anatomical information is limited to large brain tissue classes, the functional one is perceived through local activity variations within these classes. The preliminary study about image synthesis is presented in [Colin Boire 1999]. Image fusion between MR and SPECT data comes out to process fuzzy maps for brain tissues. Each map expresses the membership πC(v) of a voxel v from the anatomical image to a given class C of brain tissue (cerebrospinal fluid (CSF), white matter (WM), gray matter (GM) and hypoperfused gray matter (HGM)). The final value (v) associated with voxel v, in the synthetic image, is processed as (1) where µC is the mean functional activity of C voxels, estimated in the registered SPECT image. The information processed by (1) is composed of activity variations between the different classes, but local variations are suppressed by the average operator. The management of spatial features in image models allows the introduction of local variations into (1).
3. Proposed method Our goal is to preserve both original SPECT data and the anatomical information extracted from the MR image until the final fusion step, in which local variations of functional information are processed by proportional activity redistribution within voxels of the anatomical image. The main difficulty comes out from the difference in spatial resolution between both images. Indeed, this multiscale aspect of the data and the spatial misalignment of corresponding structures in both images involve the anatomical information and the functional information to be expressed in two different geometrical spaces (figure 3).
3
Figure 3. 2D illustration of the geometric model building according to registration step, composed of a rotation, a translation (1) and a rescaling of the data (2) between the anatomical ( ) and the functional ( ) images In the proposed method, the rigid deformation resulting from the usual registration step is not applied to the data, but we use the mathematical linear function associated with this transform to generate the geometrical models of both the MR and SPECT images, based on tilings of the space by their cubic voxels (figure 4). Finally, the identification of geometrical relations between the digital grids, i.e. volumes of the polyhedrons resulting from the intersection of the cubic voxels in general position, allows us to manage anatomical and functional data in a common spatial context for fusion. These numerical values, injected in the fusion process, act as weights to compensate the difference in resolution between original image data. The processing of intersection volumes, and thus the model itself, are, for the moment, restricted to the case of isotropic images (i.e. with cubic voxels). To our knowledge, the question of multiresolution management with preservation of both functional and anatomical original data has not been handled before. Moreover, most of the existing methods are based on the processing of the continuous information sampled in the images, and imply a compulsory resampling step [Calle 1999, Pajares DeLaCruz 2004]. To preserve the original SPECT activity and to locate it with respect to the anatomical information, we consider the discrete nature of the data, and the elementary volumes in which the continuous phenomenon has been integrated.
Figure 4. Alignment of the SPECT data on the MR image (with superimposed mask of the putamens), without resampling of the functional information
3.1. Information modeling
We assume that every anatomical structure of interest is mainly composed of pure tissue components (WM, GM and CSF). Because of partial volume effects [Wang Doddrell 2001], the numerical value associated with a MR image voxel v is a mixture of pure tissue values. Brain components are segmented in the MR image thanks to a fuzzy classification algorithm [Barra Boire 2000], fuzzy logic [Zadeh 1978] providing an adapted framework for the modeling of this tissue mixture (and for the uncertainty which qualifies medical images in general). The classification algorithm gives a set of maps, each voxel being associated with a membership degree to each tissue class (figure 5). The basic assumption is that the normalized membership of a given voxel to a tissue class may be considered as a percentage of this tissue in the basic volume element.
3.2. Building of the geometrical model
In the case of a brain study, rigid transforms are sufficient to match the cerebral structures on both images, since the brain is considered as a non-deformable solid [VanDenElsen et al. 1993]. The anatomical image being kept as spatial reference, registration parameters are processed to align SPECT data with the MR image. The 3D rigid transform is initially composed of a rotation and a translation (6 parameters). The difference in spatial resolution between acquisition systems implies a third part in the transform, based on the application of a scaling factor. The geometrical model is based on the representation of voxels from both images by cubes. The MR image is also used as geometrical reference, and its voxels are thus arbitrarily associated with unit cubes. As a consequence of the size difference between voxels of both images, the SPECT image is associated with a tilling of the space by larger voxels in general position. 4
Figure 5. Fuzzy membership maps of cerebrospinal fluid, white matter and gray matter Let T be the registration operator in homogenous coordinates. Since T changes the information expressed in a basis of 3 into information expressed in another basis, this matrix can be viewed as a basis change operator. T is the transition matrix from the basis (ui) associated with the MR image to the basis (bi) associated with the SPECT image (multiplying on the left by T transforms a coordinate set originally expressed in (bi) into coordinates expressed in the (ui) basis). Thus b12
b13
p1
u11
u12
u13
o1
b21 b22
b11
b23
p2
u 21 u 22
u 23
o2
b31 b32 0 0
b33 0
p3 1
u 31 0
u 33 0
o3 1
=
u32 0
T
(2)
where each basis is presented as an homogenous matrix, where columns 1..3 are the basis vectors (bi) and (ui), and column 4 contains the coordinates of the origin point associated with the basis: o (for (ui)) is, by definition, the origin of the canonical basis, and p (for (bi)) is the image of o and is possibly not null, because of the translation components in T (figure 6). Nevertheless, the registration transform is often built with respect to a central point (rotation and change of scale) which is not the geometrical origin (e.g. center of mass of SPECT data). In this case, the original transition matrix T has to be replaced with M = CTC −1
(3)
T
where C is the translation from the origin point (0 0 0 1) to the center c of the T transform in (bi). The generator vectors of cubes in the general position are the images of canonical unit vectors by M, and other cubes of the tiling are obtained by translation of the origin voxel (based on point p).
c (ui) o
(bi) p
Figure 6. 2D illustration of the (bi) basis processing by applying the M transform to the {(ui),o} system
3.3. Processing of the geometrical information
The discrete nature of MR and SPECT images makes the question of establishing their spatial relations very close to the digital coordinates change problem. The ratio between edge length of the low and large size voxels is not sufficient to disregard the committed error when rounding to integers the results of classical base changing formulas [Reveilles 2001]. In this case, one shall determine the volume of the geometrical intersection between unit volumes of the grids, in order to use this value in the compulsory interpolation step. Voxel sets of both images are modeled by cubic tilings of the space, with unit length for the MR image (preserved as spatial reference), and general position for the SPECT image. The intersection volumes between high and low size voxels are polyhedral (figure 7.a), and are computed using an efficient cube intersection 5
algorithm. The processing cost of a single intersection volume is lower than using a general algorithm for the intersection of convex polyhedrons, thanks to the use of analytic formulas linked with inherent cube symmetries (figure 7.b).
The octahedral group of cube symmetries
(a)
(b)
Figure 7. Example of intersection volume processed thanks to cube symmetries The principle is to run through the 6 faces of both cubes, processing a polygonal bound of the polyhedral volume at each iteration (at most 12 faces). Let C1 denote the cube providing the current square face F, and C2 the other cube (figure 8.a). The F support plan P presents a polygonal intersection I with the other voxel C2. The I vertices depend on the normal vector N of the plan P and the distance from C2 central point to P. Analytic formulas first provide vertices coordinates for a polygonal intersection I’ between C2 and a plan P’, located at the same distance from the central point of C2, and which normal vector N’ is constrained in a predefined conic region of the space (figure 8.b). N’ being an equivalent of N in the group of cube symmetries (figure 7.b), I is the image of I’ by a simple linear transform. I is possibly larger than the searched polygonal face. Therefore, the final polygon is processed as the plane intersection of I with the original square face F (figure 8.c) using an adapted version of O’Rourke’s general polygon intersection algorithm [ORourke 1998].
(a)
(b)
(c)
Figure 8. Main steps of the cube intersection algorithm (the current F is the basal face of cube C1)
3.4. Model combination step and image synthesis
In the context of the image synthesis process, the digital coordinates change is carried out by using intersection volumes as weights for numerical SPECT activities. A base activity µC is associated with each anatomical class C (either a mean activity, or an arbitrary gray level). The anatomical information is thus preserved in the edges of these classes, and local variations of the functional activity within each class are injected, in addition to µC, by equation (5). Let δv be the part of the activity, extracted from the original functional image , associated with the voxel v in the synthetic image. This value is processed from numerical activities of voxels V from , which v intersects: (4) where ρ(v,V) ∈ [0,1] is the intersection volume between voxels v and V. The value δv is thus a weighted mean activity, which belongs to the same numerical range as original functional activities. Finally, the value held by a voxel v, in the synthetic image, is (5)
6
4. Results and discussion 4.1. Presentation of image data
The image synthesis process has been applied to both brain perfusion SPECT ([99mTc]-ECD) and neurotransmission SPECT ([123I]-FP-CIT) images (figure 9). The concerned patient was affected by a multiple system atrophy (MSA, parkinsonism plus syndrome). A unique MR data set (T1 weight) was associated with both SPECT images, simultaneously acquired [ElFakhri et al. 2001]. SPECT images are thus aligned, with the same spatial resolution. Voxels from the MR image are 0.94 mm large in the slice plane. SPECT images are isotropic, with a voxel size of 2.33 mm. The slice thickness of the MR image is 1.5 mm, but the used registration process interpolates these data to cubic voxels.
Original MR image
Brain perfusion SPECT
Neurotransmission SPECT
Figure 9. MR image and dual neurotransmission / brain perfusion images
4.2. Synthetic images
Among the diagnosis elements brought by the classical multimodality approach (visual assessment of the couple SPECT / MR image), we focus on functional activity peaks, activity lacks, and on the shape and position of anatomical structures. The quality of synthetic images (figure 10), in relation to these diagnosis elements, has been assessed by an expert. He answered the following questions for both the brain perfusion and the neurotransmission images: 1. Are original diagnosis elements present on final synthetic image, and are these elements clearly visible? 2. Does this image fusion process really improve the ability to locate functional activity in relation to anatomical structures? Perfusion images refer to the activity of neurons in the whole brain. The corresponding functional activity is thus a global information, with low frequencies components. For the help in diagnosis, it has to be emphasized in the region of cerebral cortex. The concentration level of the tracer within CSF structures is null. Variations are visible in the WM and mostly in the GM (activity ratio estimated to 1/4). High activity levels in the cortical region are clearly visible, since the mean activity of this structure is already high. Nevertheless, hypoperfusion zones are mostly visible in regions with low base activity, i.e. white matter. In the case of the neurotransmission image, the high activity bound in the striatum implies a decrease of visual contrast in the surrounding region. Nevertheless, deducing the shape and position of anatomical structures remains possible thanks to the outlines of close tissue classes. Indeed the functional activity presents only low variations outside the striatum (CSF in the ventricular system and GM in the cortex). Likewise, edges of the putamens and caudate nuclei can also be deduced from activity low levels within the striatum itself. The synthesis process thus emphasizes the information brought by lacks of activity. Images presented in figure 10 were obtained by processing the voxel activities with formulas (4) and (5). The additive operator modeling information aggregation manages local variations, and the base activity associated with each tissue class, as signal deviations around a mean value. Nevertheless, this model is not unique, and other behaviors may be considered (e.g. multiplying operators). Moreover, equation (5) can be considered as incomplete, in the sense that the geometrical information don’t influence the first term of the numerator (global part of the functional information). In further developments, a solution will possibly consist in processing the global part of the functional activity associated with a voxel V of the SPECT image by modifying formula (1): the membership degree πC(V) of voxel V to a given brain tissue class C should be written considering the memberships of voxels v (membership maps extracted from the anatomical image) intersecting V, weighed by intersection volumes ρ(v,V).
7
(a)
(← bottom)
(b)
(← bottom)
(top →)
(top →)
Figure 10. Axial slices of the synthetic images obtained by fusion of MR data and the brain perfusion SPECT (a) and the neurotransmission SPECT (b)
5. Conclusion We have presented a method for the production of a new functional medical image, in which information location is improved thanks to the fusion with another reference image, delineating anatomical structures. From a clinical point of view, the produced information is fully coherent with physiological effects of the concerned pathology, and with the behavior of radiotracers used during the SPECT acquisition. The fusion of functional data with an anatomical reference provides the expected result, i.e. an improvement of the location of activity peaks and lacks in relation to brain anatomical structures. The clinical interest of the processed information for the differential diagnosis of parkinsonian syndromes will be assessed in the context of the FUSPARK project (French “Ministère de la Recherche”). Accuracy of the redistribution method is mainly linked with the quality of the registration step (through the transform parameters). This fusion process avoids adding an imprecision factor, linked with the location of anatomical structures, to the natural uncertainty of medical data. Moreover, the use of the geometrical model is fully coherent with the choice of fuzzy logic, since it allows delaying processing of the results until the available knowledge is sufficient. Thanks to the introduction of the geometrical model, the fusion process may possibly generate new information sets in which local variations of the functional activity are managed. First results are promising, and require to be confirmed with a larger database. In further developments, this principle will be applied to the synthesis of new information sets holding both global and local variations of the functional activity, and designed to emphasize dedicated diagnosis elements (e.g. new pathological tissue classes). ACKNOWLEDGMENTS This work was supported by a grant from the “Réseau National Technologies pour la Santé” of the French “Ministère de la Recherche”. The authors would like to thank the partners of the FUSPARK project, and specially Dr Marie-Odile HABERT (“La Pitié Salpetrière” hospital, Paris, France) for the assessment of synthetic images. REFERENCES [Blandini et al. 2000] Blandini, F., Nappi, G., Tassorelli, C., Martignoni, E. Functional changes of the basal ganglia circuitry in Parkinson' s disease. Progress in Neurobiology, 62: 63-88, 2000. [Rusinek et al. 1991] Rusinek, H., De Leon, M.J., George, A.E., Stylopoulos, L.A., Chandra, R., Smith, G., Rand, T., Mourino, M., Kowalski, H. Alzheimer disease: measuring loss of cerebral gray matter with MR imaging. Radiology, 1781: 109-114, 1991. [Brooks 2004]
Brooks, D.J. Neuroimaging in Parkinson' s disease. NeuroRx, 1: 243-254, 2004. 8
[Soret et al. 2003] Soret, M., Koulibaly, P.M., Darcourt, J., Hapdey, S., Buvat, I. Quantitative accuracy of dopaminergic neurotransmission imaging with 123I SPECT. Journal of Nuclear Medicine, 44: 1184-1193, 2003. [Montagner et al. 2005] Montagner, J., Barra, V., Reveillès, J.P., Boire, J.Y. Multiresolution images fusion for the quantification of neuronal activity: a discrete approach. 3rd IASTED International Conference on Biomedical Engineering, Innsbruck, Austria, 2005. [Barra Boire 2001] Barra, V., Boire, J.Y. A general framework for the fusion of anatomical and functional medical images. NeuroImage, 13: 410-424, 2001. [Condon 1991] Condon, B.R. Multi-modality image combination: five techniques for simultaneous MR-SPECT display. Computerized Medical Imaging and Graphics, 15-5: 311-318, 1991. [Stokking 1998] Stokking, R. Integration of functional and anatomical brain images : a survey of approaches, in Integrated visualization of functional and anatomical brain images. Thesis, University of Utrecht, Utrecht, Netherland, part 3: 21-40, 1998. [Kundel 1990] Kundel, H.L. Visual cues in the interpretation of medical images. Journal of Clinical Neurophysiology, 7-4: 472-483, 1990. [Hill 1993] Hill, D.L.G. Combination of 3D medical images from multiple modalities. Thesis, University of London, London, England, 1993. [Colin Boire 1999] Colin, A., Boire, J.Y. MRI-SPECT fusion for the synthesis of high resolution 3D functional brain images: a preliminary study. Computer Methods and Programs in Biomedicine, 60: 107-116, 1999. [Calle 1999] Calle, D. Image enlargement using similarities from a pyramid and induction onto a set. Thesis, Joseph Fourier University, Grenoble, France, 1999. (in french) [Pajares DeLaCruz 2004] Pajares, G., De La Cruz, J.M. A wavelet-based image fusion tutorial. Pattern Recognition, 37: 1855-1872, 2004. [Wang Doddrell 2001] Wang, D., Doddrell, D.M. A segmentation-based and partial-volume-compensated method for an accurate measurement of lateral ventricular volumes on T1-weighted magnetic resonance images. Magnetic Resonance Imaging, 19: 267-272, 2001. [Barra Boire 2000] Barra, V., Boire, J.Y. Tissue segmentation on MR images of the brain by possibilistic clustering on a 3D wavelet representation. Journal of Magnetic Resonance Imaging, 11: 267-278, 2000. [Zadeh 1978] 1978.
Zadeh, L.A. Fuzzy sets as a basis for a theory of possibility. Fuzzy Sets and Systems, 1: 3-28,
[VanDenElsen et al. 1993] Van Den Elsen, P.A., Pol, E.J.D., Viergever, M.A. Medical imaging matching - A review with classification. IEEE Engineering in Medicine and Biology, 12-1: 26-39, 1993. [Reveilles 2001] Reveilles, J.P. The geometry of the intersection of voxels spaces. Electronic Notes in Theoretical Computer Science, 46, 2001. [ORourke 1998] O' Rourke, J. Computational geometry in C., 2nd edition, Cambridge University Press (pub.), New-York, USA, 1998. [ElFakhri et al. 2001] El Fakhri, G., Moore, S.C., Maksud, P., Aurengo, A., Foley Kijewski, M. Absolute activity quantitation in simultaneous 123I/99mTc brain SPECT. Journal of Nuclear Medicine, 42-2: 300-308, 2001.
9