carried out at several levels. These include ... employ disk level tuning wherein, appropriate RAID levels are ... The standard memory model of DBMS consists of ...
International Journal of Computer Applications (0975 – 8887) Volume 42– No.5, March 2012
Modeling of DBMS Memory for Performance Tuning S.F.Rodd
U.P.Kulkrani
Asst.Prof. Dept. of Info. Sci. & Engg. Prof. Dept. of Comp. Sci. & Engg. Gogte Institute of Technlogy, SDMCET Dharwar, Karnataka, Belgaum, Karnataka INDIA.
A.R.Yardi Deputy Director, Walchand Engineering College, Maharashtra, INDIA
ABSTRACT
2. RELATED WORK
The performance of Database Management System(DBMS) is significantly affected when the key tuning parameters are altered. Most DBMS come along with several hundred tuning parameters. It is therefore important to identify only a few important tuning parameters and evaluate their effect on the system performance. The effect of each of the tuning parameter must be thoroughly understood so as to predict the performance when these parameters are altered. It is also important to understand the range of the tuning parameter over which tuning is most effective. Over tuning may lead to poor utilization of system resources. In this paper, a mathematical model is presented to predict the effect of one of the most important tuning parameter, namely, the buffer cache size and the model output is compared with experimental result. The model shows very close match with the experimental results.
Several approaches have been proposed to self tune the DBMS[2][3][4]. One of the approach is to monitor, analyze and tune, wherein, the key performance indicators are monitored, an analysis is carried out to figure out the suitable action plan and then the action is initiated to fix the problem. The tuning can be carried out at several levels. These include, physical database tuning involving changes to the underlying database tables, creating index, views and materialized views[1]. It has been observed that changes at the physical levels are not only expensive but are also difficult to implement [6]. Few others employ disk level tuning wherein, appropriate RAID levels are employed to perform the tuning action. Automatic resource selection[10] based on Pearson’s correlation coefficient is presented wherein the impact of the resources like data buffers, redo log buffer on performance is established. A ranking of tuning parameters based on statistics is presented in[5]. Resource usage analysis is presented in[9] wherein the effect of buffer size on Buffer Hit Ratio(BHR) for various workload types and a resource selection method based on correlation coefficient is presented. The self tuning techniques presented in all the previous papers are not based on sound mathematical modeling of the DBMS internal working. Hence, there is a need for a systematic investigation into the effect of each tuning parameter on the query performance based on fundamental principles. A formal mathematical model is presented here in this paper that describes the effect of one of the most important tuning parameters, namely the buffer cache on the query response time.
1. INTRODUCTION Database Management Systems(DBMS) are vital to the successful running of any business enterprise. With the proliferation of OnLine systems, E-commerce, Data-mining applications and Decision support systems, Database systems have become sophisticated with several new features and tools. After the installation and initial operational use, the data in the database and the number of users using the system grow exponentially. The Database Administrator(DBA) has to continuously monitor the performance and take appropriate measures so that the system is up and running on 247 basis. Any serious resource crunch and performance bottlenecks must be identified quickly and remedial measures must be applied so that, system keeps running with the same level of performance. Most modern DBMS come up with several hundred configuration and tuning parameters [5]. It is extremely difficult for a DBA to monitor several of these parameters and decide on extent of tuning required. This requires in-depth knowledge of tuning and experience. It is also important to see that the system is not over-tuned. This not only wastes resources but also some times may lead to reduced performance and eventually leading to instability[5]. Therefore it is desirable to identify key tuning parameters, study their effect over a wide range of values and also the effect of one tuning parameter on the other. This impact analysis help in building self tuning systems that are effective and stable. This would also considerably reduce the burden on the DBA and relieves him of the tedious and error prone task of tuning the system manually.
3. MEMORY ARCHITECTURE OF DBMS The memory structure of DBMS is segmented with each segment meant for a specific task. For instance the buffer cache holds the pages of active transactions; the redo log buffer holds the records necessary for recovery, Shared pool is shared memory area for all the concurrent transactions. However, the sizes of all these segments put together cannot exceed a fixed maximum called System Global Area(SGA). Apart from the system global area, the individual user processes have their Personal Global Area(PGA) and the size of this area also has significant effect on the query response times.
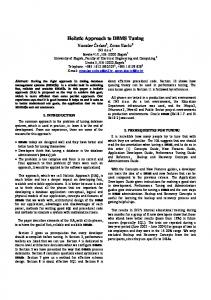
3.1 Model Description To understand the importance of various tuning parameters and their effect on the DBMS performance, a mathematical model is desirable. In this paper, effect of single parameter, namely the effect of buffer cache on response time is modeled. The DBMS is presented with n number of queries q1, q2, q3,……qn with each requiring varying number of disk blocks d1, d2, d3,
35
International Journal of Computer Applications (0975 – 8887) Volume 42– No.5, March 2012 ,……dn. The query execution engine of the DBMS generates query execution plans and each plan needs memory for the queries to be executed. The standard memory model of DBMS consists of System Global Area(SGA) of fixed size and this memory is allotted for holding disk blocks for answering the queries, updating fields, rolling back results, holding common queries of different transactions. The area of SGA that holds the disk blocks for executing the queries is called Buffer cache. The larger the size of this portion, faster will be the queries as the disk block need not be brought afresh from the disk if it is already there in the buffer cache. To better understand the role of Buffer cache in the query execution and improving throughput, there is a need to develop a model that describes the inner working of the DBMS precisely in terms of the tuning parameters, number of users etc. Figure 1 shows the logical view of the memory wherein the disk blocks required by each transaction is brought into the buffer cache before being processed. If page required is not found in the cache, it would be treated as a buffer miss and a process is initiated to get it from the disk. On the contrary a buffer hit results when the page requested is already in memory.
the Query response time, the activities in the DBMS memory are modeled as under : Let Bf be the change in the buffer size as result of which the average query response time will be reduced by a factor Qrt. It can be argued that larger the number of queries, longer will be the query response time Qrt and also the change in query response time when buffer size is altered by Bf. The user load N( Number of active users) also contribute to the increase in the Query response time, hence it is inversely proportional to Qrt. Therefore the following relation holds. Qrt - Bf Qrt
(1)
N For this derivation to hold the other tuning parameters like shared pool, redo log buffer size are assumed to be constant. Qrt = -k Bf Qrt users
where k is a constant & N number of
Separating the terms and integrating on both the sides we get
Q1
dQrt Qrt
Q2
DISK STORAGE
Bf Q3
= - k dBf
Buffer Cache
(2)
N
Integrating we get : lnQrt = - kBf + C
(3)
SGA
N Q4
Using the boundary conditions Bf
Query and their respective disk blocks
Qrt = Qrt_max
at Bf = Bfo ( Initial buf size)
Qrt = Qrt_min
when Bf ( Large buf size)
Other Space Qn
Figure 1. Memory Model for Query Execution in DBMS It is evident that the buffer space being limited and as the query arrival rate increases, there would be many buffer misses resulting in prolonged query response times. Therefore it is desirable to have a self tuning system, that proactively monitors the performance indicators like the query response time or buffer hit ratio and initiates corrective measures automatically. When a particular performance indicator such as buffer hit ratio falls below a designated threshold level, the buffer cache size will be increased to scale up the system performance. The DBMS is presented with a variety of workload types. Important among them include OLTP(On-Line Transaction Processing, DSS(Decision Support System), Web Work Load etc. Hence there is a need to establish the impact of buffer cache for every kind of workload. As a preliminary step, only the first two workload types are used to verify the model.
4. MATHEMATICAL MODEL Let the Qin_avr be the average query arrival rate and Qout_avr be the average query execution rate. In a fairly loaded DBMS we can assume that Qin_av > Qout_av. In this situation, if there is a very small buffer cache then, frequent misses will result in excessive disk I/Os resulting in poor throughput and query response times. To study the effect of size of buffer cache on
And substituting them in equation (3) we get, Qrt = Qrt_min + Qrt_max e –kBf/N
(4)
It is clear from the eqn. (4) that the query response time decreases exponentially with increase in buffer size and increases with increase in the number of users using the DBMS concurrently.
5 Experimental Results To validate the proposed mathematical model of DBMS memory, a set of experiments were carried out on Oracle 9i and MySQL. IBM Server with Xeon Processor running at 2.2Ghz with 10GB of RAM was used as hardware platform and Windows2003 Server as Operating system platform.
5.1 TPC-C (OLTP) Workload In this experiment, TPC-C(OLTP) load with a scaling factor of 2(Database size of 1.85GB) and a user load of 20 and 40 was used. The experiment was carried out using Benchmark Factory load generation and analysis tool. The effect of buffer size on the response time is estimated for different values of buffer size ranging from 4 MB to 56 MB. Fig. 2 shows the steady fall in the query response time with increasing buffer sizes. However, beyond 36 MB and 48 MB the response time saturates for 20 and 40 users respectively.
36
International Journal of Computer Applications (0975 – 8887) Volume 42– No.5, March 2012
Effect of Buffer Cache on Query Response Time
Response Time V/s Buffer Cache size
20
16
18 Qrt(Th)
Qrt (Th)
Qrt(Exp)
Qrt(Exp)
14
14 12
Response Time in secs.
Response Time in msec.
16
Th - Theoretical Exp - Experimental
10 8
40 Users
6
12 10
Work Load Type TPC-H
8
Users = 40
6 Experimental
4 2
4
Theoretical
0 0
2
20 Users 10
40
60
80
Buff. Cache size in MB
0 0
20
20
30
40
50
60
.
Buffer size in MB
Figure 2. Query Response time v/s Buffer size Hence, the tuning module must alter the buffer_size only within the useful range and avoid over-tuning which will not have any effect on the response time. On the contrary it will only lead to poor utilization of system memory. The experiment was repeated twice for checking the consistency in the results. The experimentally obtained data corroborates the proposed memory model. As expected, it is also evident that the query response is larger for increased user base. As seen from figure 2 that the graph obtained through the model and the experimentally established graph, show fairly close match. Hence, we conclude that the buffer size has significant impact on the query response time only over a limited range and tuning DBMS with buffer cache beyond the threshold has no effect on the query response time.The following parameter values are used in equation(5) TABLE 1. The constants and boundary values used in Eqn. 4 SGA
n
K1
Qrtmax
150MB
20/40
2
14.00/17.5
Qrtmin
0.25
From the graph it is quite clear that the tuning range of the buffer is limited and is most effective only over this limited range. With this knowledge, the DBA can now tune the DBMS far more effectively and confidently.
5.2 TPC-H(DSS) Workload In the second experiment the DBMS was presented with TPC-H kind of workload.
Figure 3. Query Response Time v/s Buffer size
As shown in figure 3, the response time behavior is similar, except that the response time saturates at much lower value than that in TPC-C kind of workload. This is quite on expected lines as the TPC-H load results in retrieval of large number of records.
5.3 Adhoc Query Workload In the third experiment, an Adhoc SQL query on a database comprising of three tables and having about 150,000 records was executed. The query used in the experiment was : SELECT ENAME, PROJ_NO, HOURS FROM EMP, WORKS_ON, PROJECT WHERE ESSN=SSN AND PNO=PNUM AND HOURS BETWEEN 10 and 15 ORDER BY HOURS DESC. The query response is recorded for a set of buffer cache. The result found was very different. As seen from figure 4, the response time decreases till 54MB but beyond this, the response time starts rising. This may be attributed to the fact that the memory for the buffer cache is adjusted from the other memory segments of the SGA. These include shared pool, redo log buffer etc. The reduced size of shared pool results in slower execution of the queries resulting in the increased response time. However, this rise would be much slower as the other parameters have marginal effect on the query execution time. To accommodate this effect, another term should be introduced in equation (4) as under : Qrt = Qrt_final - k1 e
-k Bf/Bth 2
(5)
Where Bth is the buffer threshold and k1, k2 are constants. So, the combined query execution time will be : Qrt=Qrtmin+Qrt_maxe –kBf/N + Qrt_final - k1 e-kBf/Bth (6) The plot of Qrt v/s the Buffer size Bf is as shown in Figure 2. As can be seen from the graph, initially, there is a huge paging activity and as a result, very poor query response time. But as the buffer size increases the Qrt shows steady fall eventually reaching a bottom value Qrt_min. at Bf =Bth.
37
International Journal of Computer Applications (0975 – 8887) Volume 42– No.5, March 2012
Effect of Buffer size on Response Time
9
Response TIME in secs
8 7 6 5 4 3 2 1 0 0 10 20 30 40 50 60 70 80 90 BUFFER SIZE in MB
Figure 4. Query Response time v/s Buffer cache size But beyond Bth, the query execution degrades as the effect of other memory segment start showing up. Bth is the threshold value of the buffer cache beyond which the query response time increases. The DBMS start stealing the memory space allocated to other segments like the shared pool and redo log buffer to meet the increased demand for larger buffer cache. As a result, the query performance degrades beyond a threshold value as shown in figure 2. However, the query execution time saturates for buffer cache size beyond 60MB. Figure 5 shows the effect of buffer cache on the query response time using the model describe using equation (6) Effect of Buffer size on Query Response Time
9
Qet_max
Query Response Time in secs
8
6. CONCLUSION Performance tuning is an important task of DBA by proactively monitoring the key performance indicators and initiating measures that fine tune the system for enhanced performance. In this paper, a memory model is presented here in this paper, describes the query execcution process inside the DBMS using the system memory and also to estimate the effect of buffer cache on the query response time. The model presented is compared with the experimental result and found to match well with the experimental data. This model is useful in deciding extent of tuning possible and its impact on the response time. It is clear that arbitrarily increasing the buffer cache size does not improve the performance. Over tuning may lead to wastage of system memory and in case of adhoc query the performance degrades beyond certain value of the buffer size. However, further investigation is required to find the effect of other tuning parameters and develop a model that would be useful for tuning the DBMS for more than one tuning parameter.
7. ACKNOWLEDGMENTS The authors wish to thank Dr. V.B.Sandur, Professor, Mechanical Department for his help in understanding mathematical modeling process. We also wish to extend our heartfelt thanks to our esteemed Management for their kind support. We also extend our heartfelt thanks to Coordinator Computer and their support staff of GIT, for extending the computing facility to carry out the experiments in the Computer laboratory to verify our model.
8. REFERENCES S. Agarwal and et.al., Automated selection of materialized views and indexes, VLDB, 2007. [2] Surjit Choudhuri, Vivek Narasayya, Self Tuning Database Systems : A Decade progress, Microsoft Research. 2007. [3] Philip Koopman, Elements of the Self-Healing System Problem Space, IEEE Data Engineering Bulletin. 2004. [4] Weikum G, Monkenberg A, Self-tuning Database technology: from Wishful Thinking to Viable Engineering, VLDB Conference, pages, 20-31, 2002. [5]
7 6 5 4
Qet_final
[6] Sanjay Agarwal, Nicolas Bruno, Surajit Chaudhari, AutoAdmin: Self Tuning Database System Technology, IEEE Data Engineering Bulletin, 2006. [6]
3 2
Bth Qet_min
1 0 0
As can be seen from figure 4 and 5 that the graph obtained from the model description very closely resembles the experimental result.
Peng Liu, Design and Implementation of Self Healing Database system, IEEE Conference, 2005.
[7] Rimma V. Nehme, Database, Heal Thyself, Data Engg. Workshop, April 2008. [8]
Wiese, David; Rabinovitch, Gennadi, Knowledge Management in Autonomic Database Performance Tuning, 20-25 April 2009.
[9]
B. DageVille and K. Dias, Oracle’s Self Tuning Architecture and Solutions, IEEE Data Engg. Bulletin, Vol 29, 2006.
10 20 30 40 50 60 70 80 90 100 Buffer size in M B
Figure 5. Query Response Time V/s Buffer cache using the model
Debnath, B.K.; Lilja, D.J.; Mokbel, M.F., SARD: A Statistical Approach for Ranking database Tuning parameters, Data Engineering Workshop, 2008. ICDEW 2008. IEEE 24th International Conference, April 2008 .
[10] Jeong Seok and Sang Ho Lee, Resource Selection for Autonomic Database Tuning, International Conference on Data Engineering, IEEE, 2005.
38
International Journal of Computer Applications (0975 – 8887) Volume 42– No.5, March 2012 [11] S. Choudhuri and G. Weikum, Rethinking Database System Architecture: Towards a Self Tuning Risc style Database System, VLDB Workshop, 2000, pp 1-10. [12] S. W. Cheng, D. Garlan et. al, Architecture based Self Adaptation in the presence of Multiple Objectives, Proceedings of 2006 International journal of Computer Systems and Engineering., 2006. [13] Benoit Dageville and Karl Dias, Oracle’s Self Tuning Architecture and Solutions, Bulletin of IEEE, 2006. [15] Gerhar Weikum, Axel Moenkerngerg et. al., Self-tuning Database Technology and Information Services :From
wishful thing to viable Engineering, Parallel and Distributed Information System 1993. [16] Satish, S.K.; Saraswatipura, M.K.; Shastry, S.C, DB2 Performance Enhancements using Materialized Query Table for LUW Systems, 2007. ICONS '07. Second International Conference, April 2007. [17] Chaudhuri, S.; Weikum G, Foundations of Automated Database Tuning, Data Engineering, April 2006. [18]
Gennadi Rabinovitch, David Wiese, Non-linear Optimization of Performance functions Autonomic Database Performance Tuning, IEEE Conference, 2007
39