Proceedings of 2010 IEEE Student Conference on Research and Development (SCOReD 2010), 13 - 14 Dec 2010, Putrajaya, Malaysia
Modeling of Heat and Moisture Transfer in Building Using RLF Method
Raad Z. Hamad, Khairul Salleh Mohamed Sahari, Farrukh Nagi
Haider A. F. Mohamed University of Nottingham Malaysia Campus Department of Electrical & Electronic Engineering Jalan Broga, 43500 Semenyih, Selangor Darul Ehsan, Malaysia E-mail:
[email protected]
University of Tenaga Nasional Department of Mechanical Engineering Km7 Jalan Kajang-Puchong, 43009 Kajang, Malaysia Email:
[email protected]
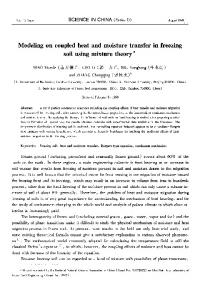
In addition to these fundamental methodological developments, more rigorous, accurate, and highly resolved methods have been continue to be developed for many of the significant heat transfer paths. The empirical of thermal building simulation techniques were developed as a higher resolution alternative to the response heat balance methods [8). The empirical methods like RLF method was derived from residential heat balance (RHB), [9, 10] they build RLF method by applying several thousand residential heat balance (RHB) cooling load results, and using these result to create RLF by Statistical regression technique to fmd values for the load factors. The procedure method of (RLF) is presented by ASRAE [II). There are many reasons to adopt this method to build model like more fitness to applied on computer process, calculate cooling and heating load depending on inside and outside temperature and cooling and heating load can be calculated room by room and that's proper for variable air volume (VAV) system. Where there are two types of scheme for multiple zone system are available, a constant air volume (CAV) and variable air volume (VAV) which is recently become very popular. This is because of the significant energy savings as compared to the other (CAV) multiple zone central system. Furthermore the (VAV) can condition part of building which is occupied only.
Abstract-This study is concerned with effectiveness of building internal temperature and relative humidity by ventilation and infiltration flow rate. Building model is inevitable to study the feasibility of building ventilation, and how to affect on indoor air quality. The empirical method which used in building model is a residential
load
factor
(RLF).
RLF
formed
to
calculate
cooling/heating load depend upon indoor/outdoor temperature. The transparency, functionality of indoor/outdoor temperatures and simplicity of RLF make it suitable for use in this model. Furthermore the parameters of model can be calculated room by
(VAV). Today a VAV system is universally accepted as means of achieving energy room and that's proper for variable air volume
efficient and comfortable building environment. The model what we get verified with different method, by manual or software program calculation.
Keywords-Building Nonlinear control
model; 1.
HVA C;
RLF;
Energy
control;
INTRODUCTION
The pioneering simulation work of Stephenson and Mitalas [1] on the response factor method significantly advanced the modeling of transient heat transfer through the opaque fabric and the heat transfer between internal surfaces and the room air. The heat balance approaches were introduced in the 1970s [2] to enable a more rigorous treatment of building loads. Rather than utilizing weighting factors to characterize the thermal response of the room air to solar insolation, internal gains, and heat transfer through the fabric, this methodology solves heat balances for the room air and at the surfaces of fabric components. The building model simulation system has been in a constant state of evolution and renewal since its first prototype was developed over two decades ago [3). Numerical discretization and simultaneous solution techniques were developed as a higher-resolution alternative to the response factor methods [3]. Essentially, this approach extends the concept of the heat balance methodology to all relevant building and plant components. More complex and rigorous methods for modeling HVAC systems were introduced in the 1980s. Transient models and more fundamental approaches were developed [4] as alternatives to the traditional approach which performed mass and energy balances on pre-configured templates of common HVAC systems. The delivery of training and the production of learning materials [5] are also receiving increasing attention. Additionally, many validation exercises have been conducted [6] and test procedures developed [7] to assess, improve, and demonstrate the integrity of simulation tools.
978-1-4244-8648-9/10/$26.00 ©2010 IEEE
II.
MODELING ApPROACH
The proposed model was structured in four groups which represented four building domain: conditioned space, opaque surfaces structure, transparent fenestration surfaces and slab floors as shown in figure (1). The first group, conditioned space sub-model, is related to the thermal capacitance of indoor air space and building furniture, where air space and furniture are considered at same temperature. The second group, opaque surfaces structure sub-model, is related to the radiation exchanges between envelope and its neighborhood and to the heat and mass transfers through the opaque surfaces structure material. Where the opaque surfaces structure are comprise of walls, doors, roofs and ceilings. The third group, transparent fenestration surfaces sub-model, is related to the direct and indirect radiation exchanges between transparent envelope and its neighborhood and to the heat transfers through the transparent fenestration surfaces material. Where the transparent fenestration surfaces are comprise of windows, skylights and glazed doors. The fourth group, slab floors sub model, is related to the heat transfers through the slab floor layers due to heat release and store in it.
287
equations by applying small perturbation and difference equation techniques. opaque surfaces structure
III.
The proposed model developed to determine the optimal response for indoor temperature and humidity ratio. By taking temperature and moisture transmission based on empirical methods RLF. The main advantage of this hybrid model approach is to get relationship between indoor and outdoor variation data like temperature and humidity ratio. With the RLF approach, the subsystem method treats outdoor air temperature and humidity ratio as the independent variable in the analysis. The thermal mass of the building structure creates a load leveling or flywheel effect on the instantaneous load. There are two factors associated with the heat gain/losses to/from building structure as a result of outdoor temperature and solar radiation. These factors are related to opaque surface (walls, ceilings, roofs and doors) and transparent fenestration surfaces (windows, skylights and glazed doors).
transparent fenestration surfaces
Supply fan
Figure ( I ) Representation of Subsystem using control volume concept for prototypical buildings
The thermal conditions and air humidity can be directly controlled by the ventilation air flow. A.
Thermal Transmittance
The conditioned space temperature represents the principal part of thermal building output. To readily modeled the behavior of an overall HVAC system, under thermal analysis, by applying conservation of energy. Energy can enter and exit a subsystem control volume by heat transfer. Energy also enters and exits with flowing streams of matter which is dominant on HVAC process. The rate of energy stored is defmed as: dEs _ dt
.
.
= L.i Ein - L.i Eout
A.
B.
Opaque Surfaces
The heat balances of Opaque surface as following the law of conservation of energy can be written as: (3)
(1)
where L.i Qin and L.i Qout= heat gain and loss through walls, ceilings, and doors, (W) ,Mw1cpwl =heat capacitance of walls, ceilings, and doors,( ] IK). By applying RLF method on equation (3) to get transfer function as follow:
dEs
is the rate of change in the total storage energy of the dt system and L.i Bin - L.i Bout is the rate of net energy transfer. where
MODEL DEVELOPMENT
Moisture Transmittance
Moisture transfer processes are not only caused by internal generation processes and air migration from outside but also by the condition of the air being injected to the zone by an air conditioning system. To follow amount variation of moisture in air flow, must applied conservation of mass on subsystem control volume. For a control volume concept with multi dimensional flow at a multi-inlet and a multi-outlet system is.
TW1in(S) = [G1,1 where G1,1l =
G1,2 kl
G1,3]
[TTk:)] r (s )
1 G1,12 _ - ('5S+1)
(4)
__ k3_
' G1,13 - ('5S+1) L w.UjOFt jA l Mw CPwl kl = L J TS = O LA jAw·Uj Ft+LjAw·hi· ] w] U ] OFt+L]A w] h 'J J J J (function of thermal resistant and outside temperature), k2 = LjAwjUjOF b+LjAwjUjOFrDR -----"-------'----, (function of thermal resistant and LjAwjUjOFt+LjAwjhij
(2) The left side of this equation represents the time rate of change of mass contained within the control volume, mi denotes the mass flow rate at an inlet, and me is the mass flow rate at an outlet.
('5s+1)
,
solar radiation incident on the surfaces), (DC), k3 = LjAw.hi· J '----, (function of thermal resistant and J -' L'LjAwjUjOFt+ jAwjhij convection heat transfer), Aw = net surface area, (m2), CF = surface cooling factor,( W 1m2 ), U = construction U-factor, W ICM2. K), M =cooling design temperature difference, (K) OFt, OF b, OFr = opaque-surface cooling factors, DR = cooling daily range, (K). ____
C. Model Linearization
The building model can be represented by a large number of nonlinear, partial differential equations. Most of the equations are related to moisture flow and heat transfer involving partial derivatives of time and space. Solution of a set of these equations is very difficult and therefore some simplifying assumptions have to be made. For purpose of analysis, the AC system is divided into a number of sections, and for each lumped parameter section, the humidity ration and air temperature are assumed to vary only in the axial directions and linearly with space. Linearising the partial differential equations reduces these equations to ordinary linear differential
B.
__
Transparent Fenestration Surfaces
Heat gain through a fenestration is consisting of two parts. The first part is the simple heat transfer due to the difference temperature of internal and external sides and the second part is the heat transfer due to solar heat gains as shown in equation (5).
288
(10)
(5) Where C Fren = UNFRC(M - O.46 DR) + PXI x SHGC x lAC x FFs, Qren = fenestration cooling load, (W), Aren =
where QSlabout = heat loss through slab floors, (W), ft = heat loss coefficient per meter of perimeter, W/(m'K), P = perimeter or exposed edge of floor, (m), Tslabin = inside slab floor temperature or indoor temperature, (DC ), To = outdoor temperature, (DC). Where ASHREA [10] calculated the input of cooling load to slab floors as follows:
fenestration area (including frame),( m2 ), C Fren = surface cooling factor, (W 1m2), UNFRC = fenestration NFRC heating V-factor, W l(m2• K), NFRC = National Fenestration Rating Council,M = cooling design temperature difference, (K), DR = cooling daily range, (K), PXI = peak exterior irradiance, including shading modifications, ( W1m2 ), SHGC = fenestration rated or estimated NFRC solar heat gain coefficient, lAC = interior shading attenuation coefficient, FFs = fenestration solar load factor. PXI is calculated as follows:
PXI = TXEt (unshaded fenestration)
(6)
PXI = Tx[ Ed + (1 - Fshd)ED] (Shaded fenestration)
(7)
QSlabin = Aslab
Cfslab
(11)
where Aslab = area of slab,( m2) Cfslab = slab cooling factor, (W1m2). The slab floors subsystem inputs are slab floors area (Aslab) and outdoor temperature To, while output is inside slab floors temperature Tslabin (5) as shown below.
Tslabin (s ) = [G1, 7
where PXI = peak exterior irradiance, (W 1m2 ), Ev Ed, ED = peak total, diffuse, and direct irradiance, ( W 1m2 ), Tx = Transmission of exterior attachment (insect screen or shade screen), Fshd = fraction of fenestration shaded by permanent overhangs, fms, or environmental obstacles. The fenestration inputs are outdoor temperature To(s) , indoor temperature T r(s) and conditioned place location fDR , while output is inside glass temperature Tgin (5) as shown in transfer function below.
G1, 8]
[A¥:b ]
(12)
(1.9-1.4hsrf) Cslab ftP T G1,1 7 G (Tslab5+1) , 1,1 8 - (Tslab5+1)' slab - ftP hs rr = effective surface conductance.
where
D.
Conditioned Space
The condition space is everything surrounded by walls, windows, doors ceilings, roofs and slab floors that means condition space include air space, furniture, occupant, lighting and apparatus which emitting heating load as shown in figure (2). By means of conditioned space control volume we analyze temperature and humidity ratio effectiveness by applying conservation of energy and mass by using RLF method. To reduce the complexity of calculation, temperature and humidity ratio will be separated to calculate the variation each of them.
(8)
Rgft 1 where G1,1 4 = G = Rg (ft +1)(Tg 5+1) , (ftRg+1)(Tg S+1) ' 1,1 5 C ag Rg -Rg 1 Tg - -R9 G116 , - (ftRg+l )(Tg 5+1) ftRg+l l.jAfenj hij f DR = Lj Arenj UNFRCj x O.46 DR , fl = Lj Arenj UNFRCj , (WIk).
_
X
J) Thermal Transmission: Sensible heat gain can be evaluated by applying thermal balance equation on conditioned space to get components thermal load. The most critical components affecting the conditioning space are:-
_
(1) through opaque surfaces (walls, roofs, ceilings, and doors), (2) through transparent fenestration surfaces (windows, skylights, and glazed doors), (3) because of occupants, lighting, and appliance, (4) caused by infiltration, (5) caused by ventilation, (6) through slab floors and (7) caused by furnishing and air conditioning space capacitance. 2) Moisture Transmission: The rate of moisture change in conditioned space is the result of three predominant moisture sources: outdoor air (infiltration and ventilation), occupants, and miscellaneous sources, such as cooking, laundry, and bathing. We Applied conservation of mass on the components of conditioning space to get general formula as following.
C. Slab Floors
The slab floors of heat balances as following the law of conservation of energy can be written as: (9) where Li Qi n and Li Qout = heat gain and loss through slab floor, (W) and MwlcpWI =heat capacitance of slab,( ] IK). Wang [12] found that heat loss from an unheated concrete slab floor is mostly through the perimeter rather than through the floor and into the ground. Total heat loss is more nearly proportional to the length of the perimeter than to the area of the floor, and it can be estimated by the following equation for both unheated and heated slab floors:
rate of moisture change = rate of moisture transfer + rate of moisture generation
289
d mo is tu r e dt Li input moisture rate Le output moisture rate + Lgen. moisture generation rate
conditioned space into integration part is represented by figure (3). From figure (3) the input variables are (1) k2 = perturbations due to thermal resistance and solar radiation incident of building envelope, (2) To (s) = perturbations in outside temperature, eC), (3) IDR = location factor, (4) ASlb = slab floors area, (m2), (5)wo (s)= perturbations in outside air humidity ratio, (6) T r(s) = Indoor temperature, (DC), (7) Qi9,l = perturbations of internal latent heat gain, (w), (8) f3= function of the mass flow rate of ventilation supply air, (W/K) and (9) 14 = perturbations of internal sensible heat gain due to occupants. Output variables are (1) Tr(s) Room temperature or conditioned space temperature and (2) wr(s) Room humidity ratio or conditioned space humidity ratio.
=
(l3)
���3 mv.n.'�.. TO.l w
. � '::' ::rt . �
=
=
�
Inside hea t gain
o
IV.
Figure (2) Illustrate heat and humidity flow in/out of conditioned space A complete description of the plant behavior for the two main output components is given by combining space model equations with building model equations. The whole subsystems model equation of conditioned space is presented in Eqn. (14) which shown at the bottom of the page. kSlb 1 k l w where G1,9 G1,11 - f2('6S+1) , G1,10 f2Rg(�6S+1)' - f2(�6S+1) 1 G1,12 To G G -0 G -0, - f2(�6S+1)' 1,13 - h(T6S+1) ' 1,14 - , 1,15 G2,9 0 , G2,10 0 , G2,11 0 , G2,12 0 , G2,13 0 1 1 G2,14 =_ _ G2,1 = kwi =" L.. J· A Wj h.Ij , 5 hfgmexh(TrS+1) (TrS+1)' kSlb LJ· Aslb·hi· , f3 Cs X AL X IDF + mvenCPa , (Wjk), ) ) (function of the mass flow rate of ventilation supply air) Cs = air sensible heat factor, W/(L's'K), AL = building effective leakage area, cm2, IDF = infiltration driving force,Lj(s, cm2) 1 12 Lj Awjhij + Rg + Lj Aslbjhij + Cs X AL X IDF + _
=
=
=
=
ApPLICATION TO RESIDENTIAL BUILDING
The model transfer function for residential building is shown in figure (3). In order to be able to implement model transfer function, all the parameters of Eqns. (4), (8), (12) and (14) are determined. So that we have to describe the building structure that we are applied on this modeling approach. The geometry of the building figure (4) is identical to one in ASHRAE [10] used to investigate the parameters of the developed model. The building construction characteristics are documented in Table (1). V.
The building house which we used as a test house to verify the model, it is typical one-story house has a simple structure. ----- ...
,
=
=
SIMULATION RESULT AND DISCUSSION
=
=
mven CPa Wjk ,
T6
=
�:f,
(sec.)
, Caf
= heat capacitance of
indoor air and furniture, mven = mass flow rate of ventilation supply air, (kg/s) rll i f= infiltration air mass flow rate, (kgjs), mexh mven + min!, f4 ff + 1 36 + 2.2Acf + 22Noc ,W, ff = direct radiation, ,( W), Wo= humidity ratio of outdoor, (Kgw/Kgda), Qig,l = latent cooling load from internal gains, (W). To integrate of building structure (opaque surfaces, transparent fenestration surfaces and slab floor) and
n
=
=
en
en
Figure (3) Subsystem model transfer function relations
TWl.m (s) Tgin (s)
G1,10(S)
G1,11(S)
G2,1O(S)
G2,11(S)
G1,12(S) G2,12 (s)
G1,13(S)
G1,14(S)
G1,lS(S)
G2,13(S)
G2,14(S)
G2,lS(S)
]
TSlbin (s) 13 14 WoeS) Qi9,l
290
(14)
36 35
The general hose characteristics are overall area is 248.6 m2 while overall area less garage area is 195.3 m2, the gross windows and wall exposed area are 126.2 m2 while the net wall exterior area is 108.5 m2, the overall house volume less garage volume is 468.7 m3 and construction characteristics are documented in table (I). From the house characteristics we deduce that it has heavy thermal and moisture masses and this indicate to existing thermal and moisture lag which is depicted in figure (5) where figure (5) illustrate the house inside temperature and humidity responding due to outdoor temperature and humidity random variation. A.
-" t,.k 30
� ;: � 27 � 26 �
{!
E
0
25 24 23 22 21 20 "
Indoor
. .
TABLE 1. MATERlAL PROPERTIES OF MODEL BUILDING CONSTRUCTIONS Component
--
73
Tlml.(hour)
"0
Model validation
--'*1'"
calculated tllmp8flll�.
Figure (6) Indoor temperature variation due to outdoor temperature variation
Roof/ceiling
To validate the derived models, a comparison test was carried out by the indoor model conditions and other different calculation method. The building properties and weather data obtained for the Kuala Lumpur city have been used to calculate indoor condition. By means of natural ventilation applied on building model, where outside climate condition was only affected on the indoor condition. The behaving of indoor temperature and humidity ratio were obtained as shown in figures (6) and (7). The aim of simulation modeling is to represent as closely as possible the underlying physical laws and other principles of cooling load calculation by using software. According to house characteristics the indoor temperature and humidity ratio are calculated every one hour for 24 hours by using software (simulation in the building design professions) [13]. The data result of comparison between building simulation output and calculation result by software program, is shows partial agreement as shown in figure (6) and (7). Because we concern with model behavior we did two types of test, one nightly and the other daytime. Both of tests are applied natural ventilation mode, the outside house air supply due ventilation and infiltration are 41 Lis and 17 Lis respectively [II].
I'
-cucklor'lmperlltU'l
32
Exterior walls Doors Floor
Windows
Construction A.
Description Flat wood frame ceiling (insulated with R-5.3 fiberglass) beneath vented attic with medium asphalt shingle roof. Wood frame, exterior wood sheathing, interior gypsum board, R-2.3 fiberglass insulation. Wood, solid core. Slab on grade with heavy carpet over rubber pad; R-0.9 edge insulation to I m below grade Clear double-pane glass in wood frames. Half fixed, half operable with insect screens (except living room picture window, which is fixed). 0.6 m eave overhang on east and west with eave edge at same height as top of glazing for all windows. Allow for typical interior shading, half closed. Good
Factors U = 0.031 18 (W/ (m2.K)) aroo! = 0.85 U=51 W/(m2.K))
U=2.3W/(m2.K) Rcvr = 0.21 Cm2• K)/ W) Fp=85W/Cm2.K) 2.84 U Fixed: W/Cm2.K); SHGC = 0.67 Operable: U = 2.87 WI(m2K); SHGC 0.57; Tx= 0. 64 lACe!= 0.6 Aul= 1.4 cm21m2
Natural ventilation of day
Daytime natural ventilation test was applied in Kuala Lumpur city were last year maximum mean temperatures was 33 'c, where the mean humidity ratio for the same maximum temperatures was 0.0209 Kgw/Kg. (Kg water vapor/Kg dry air). According to house characteristics the indoor temperature and humidity ratio are calculated by using software simulation in the building design professions as 20 'c and 0.00805 Kgw/Kg. respectively [13]. The indoor temperature affected by many types of effectiveness some of them doing to rise temperature like indoor outdoor difference temperature, ventilation and filtration supply airflow rate, windows and wall exposed area and incident solar radiation intensity while the other effectiveness are doing to suppress rIsmg temperature like opaque envelop thermal capacitance, weight of air and furniture inside house and slab floors area. While humidity ratio is a function of ventilation, filtration, outside humidity ratio and internal latent load gains as proved in eqn. (14). Figure (8) demonstrate high rising gradient at initial state then reduced due to alteration of effectiveness with time. The simulation process perceIvmg that the output indoor temperature was greatly affected at input outside temperature while the other inputs were barely affected.
-----=1
-"""'N
Figure (4) The geometry of the building has been chosen to get model
B.
Natural ventilation of night
In this test we figured out the minimum mean temperatures of Kuala Lumpur city for last year was 18 (C). Whereas the minimum mean humidity ratio for the same minimum temperatures was 0.0085 Kgw/Kg.. According to house characteristics the indoor temperature and humidity ratio are
Sample No.
Figure (5) Indoor temperature and humid response to random outdoor variation
291
II.
From analyzing internal house condition (dry bulb temperature and relative humidity) for two processes line as shown in figure (10). Obviously both processes line are passing through comfort zone in the psychrometric chart [15]. So we infer there is interval period of time cannot use air conditioning, and this period depends on type of process. For natural ventilation of day based on process line in figure lOwe can figure out the time from figure 8. Therefore we need air conditioning after 1.5 hour when outside temperature gets maximum value. While natural ventilation of night depending on figure 9 and figure lOwe cannot use air-conditioning after 2 hours when outside temperature gets minimum value. Where mechanical intervention is necessary to control indoor air quality, by which can greatly extend time period cannot use air-conditioning or reduce time period of using air conditioning by controlling on variable-supply airflow rate for natural ventilation by using variable speed fan.
Figure (7) Indoor humidity ratio variation due to outdoor humidity variation Murll wntllU on response of d.y
�; =:===r::�:�b���+��. ; E .. -1 :: : :�:�� -I
--.-------.------,--�,__-_.__'-___,:-____.-____,--_.__-_,'O'022
r-
O.0206
'""t..
... . ...........,.. ......... ' 0.0 1 64.1 .................,............... 'O .O l li lC
� i
O.D 122 _::: _-= , �c;:_ ::-;"".... ,;:;;., c-:•• :;;: ."" lndoor I'MrMy rltlo 0.0108 E
·····
O.0I36
=
.... .... .... ......... ..... ...: .. ........... ...: .. ....... .... .. ) ............ ..... .... ... ...... .. . :................. ............ oudoort..,.,IIIIUfI 0.0094.E . . . 1---�·� �·�2:8 · 008 � .!--+---+---+-----;e--±--+--+.-��
Figure (8) Indoor temperature and humidity ratio response to natural of day
calculated by using software simulation in the building design professions as 27 ( C) and 0.018 Kgw/Kg. respectively [13].We plugged in the input data on model to get indoor temperature and humidity ratio as shown in figure (9). Although there was no incident solar radiation subjected to model, declining temperature was very sluggish. That's because of indoor outdoor temperature difference and thermal storage for opaque envelope, furniture, internal walls and slab floors all these factors influence a model's behave which illustrated in figure (9).
REFERENCES
C. psychrometric process line analyses
The psychrometric chart is widely used to illustrate and analyze the change in properties and the thermal characteristics of the air-conditioning process and cycles [14]. Figure (10) represent process line of natural ventilation of a night and a day. From figure (10) we observe that both of the two processes are intervening change in temperatures and humidity ratio. But both of the processes are equal of airflow rate induced by ventilation and filtration also the processes time duration and temperatures difference are almost equal. Hence the processes heating load gains at daytime grater than cooling load at nighttime. This is a rational illustration because existing of the solar radiation at daytime. ;;:_ 27 �. . . .. , . .. . ...... \' 25.5 1\"···········, ················· � 24 ."',,:...••,.................
fff-
· ·
r
· · ·
··
0116 � i ===� O. -----Indoor�fIIIio OO. l64 t ..
................+ . . ......... 0.0152.1 .................j.............. ;. ·············00. 14 :.::.
::: 22 .S ·······-s.,J-:::····..···· = ·········· " c t 19.5 .... .......... ;..... ...
�
[I)
D.G. Stephenson and G.P. Mitalas (1967), 'Cooling Load Calculations by Thermal Response Factor Method', ASHRAE Trans. 73 ( I ) 508-515.
[2)
T. Kusuda (1976), NBSLD: The Computer Program for Heating and Cooling Loads in Buildings, NBS Building Science Series No. 69, National Bureau of Standards, Washington USA.
[3)
J.A. Clarke (1977), Environmental Systems Performance, PhD Thesis, University of Strathclyde, Glasgow UK.
[4)
1. ed. Lebrun (1982), Proc. Int. Con! on System Simulation in Buildings,
[5)
S.O. Jensen, Ed. (1993), Validation of Building Energy Simulation Programs, Part I and II, Research Report PASSYS Subgroup Model Validation and Development, CEC, Brussels, EUR 15115 EN.
[6)
R. ludkoff and 1. Neymark (1995), International Energy Building Energy Simulation Test (BESTEST) and Diagnostic lEA Energy Conservation in Buildings and Community Programme Annex 21 Subtask C and lEA Solar Heating and Programme Task 12 Subtask B.
[7)
ASHRAE (1998), Standard Method of Test for the Evaluation of Building Energy Analysis Computer Programs: ASHRAE Standard 140P, Working Draft 98/2, American Society of Heating, Refrigerating, and Air-Conditioning Engineers, Atlanta USA.
[8)
K.J. Lomas, H. Eppel, C. Martin, and D. Bloomfield (1994), Emp irical Validation of Thermal Building Simulation Programs Using Test Room Data, Volume 1: Final Report, lEA Energy Conservation in Buildings and Community Systems Programme Annex 21 and lEA Solar Heating and Cooling Programme Task 12.
[9)
C. S. Barnaby, J.D. Spitler, and D. Xiao., 2004, 'Updating the ASHRAE/ACCA residential heating and cooling load calculation procedures and data' (RP-1199). ASHRAE Research Project.
- CIUdo«I�l.h ..
·
""' . ," 1---+---
.............O.0128ii a.o11s
i
;:
CONCLUSION
Commission of the European Communities, Lie'ge, Belgium.
Agency Method, Systems Cooling
-+---+-----;----+---0 + 0. 104 §
[10) C. S. Barnaby, J.D. Spitler, and D. Xiao. 2005, 'The residential heat balance method for heating and cooling load calculations (RP-1199). ASHRAE Transactions 111(1):308-319.
Figure (9) Indoor temperature and humidity ratio response to natural of night
[ I I ) ASHRAE, 2009, 'residential cooling and heating load calculations' handbook-fundamentals, chp. 17, American Society of Heating, Refrigerating, and Air-Conditioning Engineers.
�
J:. O.009 2
IS,
£�IIO.�
[12) F. S. Wang 1979. "Mathematical modeling and computer simulation of insulation systems in below grade applications". ASHRAEIDOE Conference on Thermal Performance of the Exterior Envelopes of Buildings, Orlando, FL
__ --.>---
[13) Cooling load calculation software available httpllwww.carmelsoft.com. Accessed March 24, 2010.
from
URL:
[14) T. Grondzik Walter, 2008 'Air Conditioning System Design Manual' second edition, Ashrae Special Publications NE, Atlanta
" T�ur··"Cl1W
[15) ASHRAE. 2004. ANS/IASHRAE Standard 55-2004, "Thermal Environmental Conditions for Human Occupancy". Atlanta: Inc.
Figure (10) cooling and heating load process for night and day natural ventilation
292