VOL. 3, NO. 4, JULY 2008
ARPN Journal of Agricultural and Biological Science
ISSN 1990-6145
©2006-2008 Asian Research Publishing Network (ARPN). All rights reserved.
www.arpnjournals.com
MODELING OF SOIL CATION EXCHANGE CAPACITY BASED ON SOIL ORGANIC CARBON Majid Rashidi1 and Mohsen Seilsepour2
1
Department of Agricultural Machinery, Faculty of Agriculture, Islamic Azad University, Takestan Branch, Iran 2 Varamin Soil and Water Research Department, Soil and Water Research Institute, Iran E-Mail:
[email protected] ,
[email protected]
ABSTRACT There are many instances in which it is desirable to determine relationships among soil physical and chemical properties. For example, soil cation exchange capacity (CEC) are often determined using laborious and time consuming laboratory tests, but it may be more suitable and economical to develop a method which uses some soil physical and chemical properties. In this study, five linear regression models for predicting soil CEC from some soil physical and chemical properties i.e. sand (SA), silt (SI), clay (CL), organic carbon (OC) content (% by weight) and pH (PH) of soil were suggested. Statistical results of the study indicated that organic carbon is the most important factor, which affects soil CEC, and in order to predict soil CEC the linear regression soil CEC model CEC = 7.93 + 8.72 OC with R2 = 0.74 can be recommended. Keywords: soil, cation exchange capacity, organic carbon, modeling, prediction.
INTRODUCTION Soil cation exchange capacity (CEC) is the total of the exchangeable cations that a soil can hold at a specified pH. Soil components known to contribute to soil CEC are clay and organic matter, and to a lesser extent, silt (Martel et al. 1978; Manrique et al. 1991). The exchange sites can be either permanent or pH-dependent. Mineral soils have an exchange capacity that is a combination of permanent and pH-dependent charge sites, while that of organic soils is predominantly pH-dependent. In any given soil, the number of exchange sites is dependent on the soil pH; type, size and amount of clay; and amount and source of the organic material (Kamprath and Welch 1962; Parfitt et al. 1995; Syers et al. 1970; Miller 1970). The relationship between clay content (% by weight) and CEC can be highly variable because different clay minerals have very different CEC values. In addition, the relative proportion of pH-dependant and permanent CEC varies among clay minerals (Miller 1970). Several researchers have attempted to predict CEC from clay and organic carbon contents alone, using multiple regression. Results show that greater than 50% of the variation in CEC could be explained by the variation in clay and organic carbon content for several New Jersey soils (Drake and Motto 1982), for sandy soils in Florida (Yuan et al. 1967), for some Philippine soils (Sahrawat 1983) and for four soils in Mexico (Bell and Keulen 1995). Only a small improvement was obtained by adding pH to the model for four Mexican soils (Bell and Keulen 1995). In B horizons of a toposequence, the amount of fine clay (particle size < 0.2 µm) was shown to explain a larger percent of the variation in CEC than the total clay content (Wilding and Rutledge 1966). In gleyed subsoil horizons of lowland soils in Quebec, surface area (of the soil) gave a better prediction of CEC than did total clay (Martel et al. 1978). Martel et al., (1978) also showed that the variations in mineralogical composition, although small, were sufficient to explain nearly 50% of the variation in CEC.
Similarly, Miller (1970) found that the type of clay alone could explain up to 50% of the variation in CEC. Many of the above predictive models are specific to a region or area and confined to only a few soil types. Many attempts have been made to predict CEC indirectly from some easily available soil physical and chemical properties. MacDonald (1998) developed two equations CEC = 2.0 (organic carbon) + 0.5 (clay) and CEC = 3.8 (organic carbon) + 0.5 (clay) for Quebec and Alberta soil state in Canada, respectively. Bell and Keulen (1995) studied Mexico soils and proposed an equation to predict soil CEC by some independent variables such as clay, organic carbon and pH. In their equation, 96% of soil CEC variations were explained by clay, organic carbon and pH. Also, Krogh et al. (2000) suggested an equation based on silt, clay, organic carbon and pH which explained 90% of soil CEC variation. Asadu and Akamigbo (1990) predicted soil CEC from organic matter and clay content grouped by taxonomic order (Inceptisols, Alfisols, Ultisols and Oxisols). Despite the considerable amount of research done, which shows the relationship between soil CEC and soil physical and chemical properties, very limited work has been conducted to model soil CEC based on some soil physical and chemical properties. Therefore, the specific objectives of this study were to determine soil CEC model, and to verify the model by comparing its results with those of the laboratory tests. MATERIALS AND METHODS Experimental procedure Seventy-five soil samples were taken at random from different fields of experimental site of Varamin, Iran. The site is located at latitude of 35°-19'N and longitude of 51°-39'E and is 1000 m above mean sea level, in arid climate in the center of Iran. The soil of the experimental site was a fine, mixed, thermic, Typic Haplocambids clayloam soil.
41
VOL. 3, NO. 4, JULY 2008
ISSN 1990-6145
ARPN Journal of Agricultural and Biological Science ©2006-2008 Asian Research Publishing Network (ARPN). All rights reserved.
www.arpnjournals.com In order to obtain required parameters for determining soil CEC model, particle size distribution i.e. sand, silt, clay and some chemical properties such as organic carbon content (% by weight) and pH of the soil samples were measured using laboratory tests as described by the Soil Survey Staff (1996). Physical and chemical properties of the seventy-five soil samples used to determine soil CEC model are shown in Table-1. Also, in order to verify soil CEC model by comparing its results
with those of the laboratory tests, fifteen soil samples were taken at random from different fields of the experimental site. Again, sand, silt, clay and organic carbon content (% by weight) and pH of these soil samples were measured using laboratory tests as described by the Soil Survey Staff (1996). Physical and chemical properties of the fifteen soil samples used to verify soil CEC model are shown in Table-2.
Table-1. Mean values, Standard Deviation (S.D.) and Coefficient of Variation (C.V.) of soil physical and chemical properties of the seventy-five soil samples used to determine soil CEC model. Parameter Sand (%) Silt (%) Clay (%) Organic carbon (%) pH CEC (cmol kg-1)
Minimum
Maximum
Mean
S.D.
C.V. (%)
14.0 30.0 9.00 0.15 7.00 7.00
44.0 56.0 50.0 1.90 8.10 23.0
33.1 45.3 22.0 0.68 7.50 13.9
6.31 4.13 6.65 0.32 0.27 3.25
19.1 9.12 30.2 47.1 3.60 23.4
Table-2. Mean values, Standard Deviation (S.D.) and Coefficient of Variation (C.V.) of soil physical and chemical properties of the fifteen soil samples used to verify soil CEC model. Parameter Sand (%) Silt (%) Clay (%) Organic carbon (%) pH CEC (cmol kg-1)
Minimum
Maximum
Mean
S.D.
C.V. (%)
10.0 40.0 18.0 0.36 7.00 8.00
34.0 56.0 50.0 2.00 8.00 25.0
24.1 48.2 28.2 0.83 7.31 15.2
5.87 4.40 7.90 0.39 0.33 3.72
24.4 9.13 28.0 47.0 4.51 24.5
Regression model A typical linear regression model is shown in Eq. (1): Y = k0 + k1X
(1)
Where: Y = Dependent variable, for example CEC of soil. X = Independent variable, for example sand, silt, clay and organic carbon content (% by weight) or pH of soil. k0, k1 = Regression coefficients. In order to predict soil CEC from the soil physical and chemical properties i.e. sand (SA), silt (SI), clay (CL) and organic carbon (OC) content (% by weight) and pH (PH), five linear regression models were suggested (Table-3).
Table-3. Linear regression models. Model No. 1 2 3 4 5
Model CEC = k0 + k1 SA CEC = k0 + k2 SI CEC = k0 + k3 CL CEC = k0 + k4 OC CEC = k0 + k5 PH
Statistical analysis A paired samples t-test and the mean difference confidence interval approach were used to compare the soil CEC values predicted using model with the soil CEC values measured by laboratory tests. The Bland-Altman approach (1999) was also used to plot the agreement between the soil CEC values measured by laboratory tests with the soil CEC values predicted using model. The statistical analyses were performed using Microsoft Excel (Version 2003).
42
VOL. 3, NO. 4, JULY 2008
ISSN 1990-6145
ARPN Journal of Agricultural and Biological Science ©2006-2008 Asian Research Publishing Network (ARPN). All rights reserved.
www.arpnjournals.com RESULTS The p-value of independent variable, Coefficient of Determination (R2) and Coefficient of Variation (C.V.) of all the models are shown in Table-4. Among the models, models No. 1, 2, 3 and 5 were judged unacceptable based on the statistical results. On the other hand, model No. 4 where organic carbon was considered
as independent variable was judged acceptable due to statistical results. The R2 value and C.V. of model No. 4 were 0.74 and 12.1%, respectively. Model No. 4 is given in Eq. (2). CEC = 7.93 + 8.72 OC
(2)
Table-4. The p-value of independent variable, Coefficient of Determination (R2) and Coefficient of Variation (C.V.) of all the linear regression models. Model
Independent variable
p-value
R2
C.V. (%)
CEC = k0 + k1 SA CEC = k0 + k2 SI CEC = k0 + k3 CL CEC = k0 + k4 OC CEC = k0 + k5 PH
Sand Silt Clay Organic carbon pH
3.41E-06 0.559616 1.20E-04 7.04E-23 3.82E-05
0.26 0.01 0.19 0.74 0.21
20.3 23.5 21.2 12.1 20.9
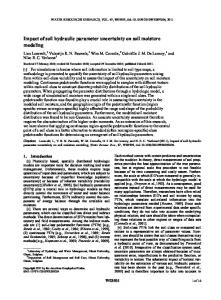
DISCUSSIONS A paired samples t-test and the mean difference confidence interval approach were used to compare the soil CEC values predicted using the linear regression model No. 4 with the soil CEC values measured by laboratory tests. The Bland-Altman approach (1999) was also used to plot the agreement between the soil CEC values measured by laboratory tests with the soil CEC values predicted using the linear regression model No. 4. The soil CEC values predicted by model No. 4 were compared with the soil CEC values determined by laboratory tests and are shown in Table-5. A plot of the soil CEC values determined by model No. 4 and laboratory tests with the line of equality (1.0: 1.0) is shown in Figure-1. The mean soil CEC difference between two methods was 0.09 cmol kg-1 (95% confidence interval: -1.67 and 1.85 cmol kg-1; P = 0.911). The standard
deviation of the soil CEC differences was 3.18 cmol kg-1. The paired samples t-test results showed that the soil CEC values predicted with model No. 4 were not significantly different than the soil CEC measured with laboratory tests (Table-6). The soil CEC differences between these two methods were normally distributed and 95% of the soil CEC differences were expected to lie between µ+1.96σ and µ–1.96σ, known as 95% limits of agreement (Bland and Altman 1999). The 95% limits of agreement for comparison of soil CEC determined with laboratory test and model No. 4 were calculated at -6.14 and 6.33 cmol kg-1 (Figure-2). Thus, soil CEC predicted by model No. 4 may be 6.14 cmol kg-1 lower or 6.33 cmol kg-1 higher than soil CEC measured by laboratory test. The average percentage differences for soil CEC prediction using model No. 4 and laboratory test was 18.2%.
Table-5. Physical and chemical properties of the soil samples used in evaluating soil CEC model No. 4. Soil physical and chemical properties Sample No. 1 2 3 4 5 6 7 8 9 10 11 12 13 14 15
Sand (%) 18 21 28 34 22 10 17 27 24 24 26 29 27 28 27
Silt (%) 45 53 48 48 48 40 47 43 55 52 48 49 47 44 48
Clay (%) 37 26 24 18 30 50 36 30 21 24 26 22 26 28 25
OC (%) 0.65 0.98 1.26 0.86 0.76 0.36 0.71 0.46 0.73 2.00 0.93 0.56 0.65 0.72 0.68
pH 7.8 7.9 7.0 7.3 7.2 7.4 7.0 7.1 8.0 7.0 7.3 7.2 7.1 7.3 7.0
CEC (cmol kg-1) Laboratory test 12.0 11.0 17.0 14.5 15.0 16.0 18.0 16.0 8.00 25.0 16.0 13.5 15.0 16.5 15.0
Model No. 4 13.6 16.5 18.9 15.4 14.6 11.1 14.1 11.9 14.3 25.4 16.0 13.6 13.6 14.2 13.9
43
VOL. 3, NO. 4, JULY 2008
ISSN 1990-6145
ARPN Journal of Agricultural and Biological Science ©2006-2008 Asian Research Publishing Network (ARPN). All rights reserved.
www.arpnjournals.com
Table-6. Paired samples t-test analyses on comparing soil CEC determination methods.
Determination methods
Average difference (cmol kg-1)
Standard deviation of difference (cmol kg-1)
p-value
95% confidence intervals for the difference in means (cmol kg-1)
Model No. 4 & laboratory test
0.09
3.18
0.911
-1.67, 1.85
30
Predicted CEC (cmol kg -1)
1.0: 1.0 25
20
15
10
5 5
10
15
20
25
30
Measured CEC (cmol kg-1)
Difference of measured and predicted CEC (cmol kg-1)
Figure-1. Measured CEC and predicted CEC using model No. 4 with the line of equality (1.0: 1.0).
15 10 6.33 5 0.09 0 - 6.14
-5 -10 -15 5
10
15
20
25
30
Average of measured and predicted CEC (cmol kg-1)
Figure-2. Bland-Altman plot for the comparison of measured CEC and predicted CEC using model No. 4; the outer lines indicate the 95% limits of agreement (-6.14, 6.33) and the center line shows the average difference (0.09).
44
VOL. 3, NO. 4, JULY 2008
ISSN 1990-6145
ARPN Journal of Agricultural and Biological Science ©2006-2008 Asian Research Publishing Network (ARPN). All rights reserved.
www.arpnjournals.com CONCLUSIONS Linear regression model based on soil organic carbon was used to predict soil CEC. The soil CEC values predicted using the model was compared to the soil CEC values measured by laboratory tests. The paired samples ttest results indicated that the difference between the soil CEC values predicted by the model and measured by laboratory tests were not statistically significant (P>0.05). Therefore, the linear regression soil CEC model can provide a simple, economic and brief methodology to estimate soil CEC. Statistical results of the study also indicate that organic carbon is the most important factor which affects soil CEC.
MacDonald K.B. 1998. Development of pedotransfer functions of southern Ontario soils. Report from greenhouse and processing crops research center. Harrow, Ontario. No: 01686-8-0436, pp. 1-23. Manrique L.A., Jones C.A. and Dyke P.T. 1991. Predicting cation-exchange capacity from soil physical and chemical properties. Soil Sci. Soc. Am. J. 55: 787794. Martel Y.A., Kimpe C.R.D. and Laverdiere M.R. 1978. Cation-exchange capacity of clay-rich soils in relation to organic matter, mineral composition and surface area. Soil Sci. Soc. Am. J. 42: 764-767.
ACKNOWLEDGMENTS The financial support provided by the Agricultural Research and Education Organization of Iran under research award number 100-15-76048 is gratefully acknowledged.
Miller W.F. 1970. Inter-regional predictability of cationexchange capacity by multiple regression. Plant Soil. 33: 721-725.
REFERENCES
Parfitt R.L., Giltrap D.J. and Whitton J.S. 1995. Contribution of organic matter and clay minerals to the cation exchange capacity of soils. Commun. Soil Sci. Plant Anal. 26: 1343-1355.
Asadu C.L.A. and Akamigbo F.O.R. 1990. Relative contribution of organic matter and clay fractions to cation exchange capacity of soils in southern Nigeria. Samaru J. Agric. Res. 7: 17-23. Bell M.A. and Keulen J.V. 1995. Soil pedotransfer functions for four Mexican soils. Soil Sci. Soc. Am. J. 59: 865-871. Bland J.M. and Altman D.G. 1999. Measuring agreement in method comparison studies. Stat. Methods Med. Res. 8: 135-160. Drake E.H. and Motto H.L. 1982. An analysis of the effect of clay and organic matter content on the cation exchange capacity of New Jersey soils. Soil Sci. 133: 281-288. Kamprath E.J. and Welch C.D. 1962. Retention and cation-exchange properties of organic matter in coastal plain soils. Soil Sci. Soc. Am. Proc. 26: 263-265. Krogh L., Breuning H. and Greve M.H. 2000. Cation exchange capacity pedotransfer function for Danish soils. Soil and Plant Sci. 50: 1-12.
Sahrawat K.L. 1983. An analysis of the contribution of organic matter and clay to cation exchange capacity of some Philippine soils. Commun. Soil Sci. Plant Anal. 14: 803-809. Soil Survey Staff. 1996. Soil survey laboratory methods manual. Soil Survey Investigations Rep. 42. Version 3.0. U.S. Gov. Print. Washington, DC. Syers J.K., Campbell A.S. and Walker T.W. 1970. Contribution of organic carbon and clay to cation exchange capacity in a chronosequence of sandy soils. Plant Soil. 33: 104-112. Yuan T.L., Gammon N. and Leighty R.G. 1967. Relative contribution of organic and clay fractions to cationexchange capacity of sandy soils from several soil groups. Soil Sci. 104: 123-128. Wilding L.P. and Rutledge E.M. 1966. Cation-exchange capacity as a function of organic matter, total clay, and various clay fractions in a soil toposequence. Soil Sci. Soc. Am. Proc. 30: 782-785.
45