Modeling of submerged simultaneous flow through combined weirs and gates devices Abdel-Azim M. Negm1*
In the first part of this paper, the effect of hydraulic and geometrical parameters on the simultaneous discharge were discussed and non-dimensional prediction discharge equation for the simultaneous flow was developed. In this study, a generalized discharge model is proposed based on using the known equations of weirs and gates. The proposed equation is calibrated using large series of experimental data for devices having opening of unequal contractions under both free and submerged flow conditions. The equation is based on the use of a factor that accounts for the interaction effect of the overflow-underflow and the use of the available weir and gate equations. The predictions of the proposed model agrees well with the observations with a deviation of less than ± 5 for about 90% of the data. Also, the artificial neural networks are used to develop a prediction model for the simultaneous discharges. The ANN model is trained, validated and tested using the collected experimental data. The correlation coefficient and mean relative error are used to evaluate the performance of each model. The predictions of each model are compared to the experimental results and to the previously developed model.
Introduction Both weirs and gates are used frequently for discharge measurements in open channels. Weirs and gates may be combined together in one device yielding a simultaneous flow over the weir and below the gate. The flow through combined devices may be free when both the flow over weir and below the gate are free and it is termed submerged when the flow below the gate is submerged (and the flow over the weir may or may not be submerged). The simultaneous discharge can be obtained by adding the overflow discharge to the underflow discharge and making use of an interaction factor (Negm, 1996 and Negm et al., 2000). A comprehensive review of the studies dealing the simultaneous flow over weirs and below gates can be found in (Negm, 2002 and Negm et al., 2002). The characteristics of free flow through combined devices with rectangular openings of unequal contractions have been investigated by (Negm, 1995). He provided the following discharge prediction model æ b öæ h ö Q / 2g d 2.5 = A o + A1 ç 1 ÷ç ÷ 1. è b øè d ø In which b1 is the width of the bottom opening (gate) where its depth is d, b is the width of the weir, h is the head over the weir, Q is the simultaneous discharge, g is the gravitational acceleration, Ao and A1 are regression coefficients that depend on the model ratio, b1/b only. Equation 1 was developed for the following limitations: 0.46 £ d/y £ 2.14, 0.39 £ b/d £ 1.62, 0.25 £ b1/b £ 4, 0.13 £ b/B £ 0.53 and 0.08 £ h/d £ 0.975. On the other hand, the characteristics of the simultaneous flow over weirs and below submerged gates with unequal contraction were presented (Negm, 2000). The following discharge prediction regression model was provided (R2=0.9824 and SEE=0.296)
1
Associate Professor, Dept. of Water & Water Structures Eng., Faculty of Engineering, Zagazig University, Zagazig, Egypt, E-mail:
[email protected]
Q 2g d
2.5
æH+hö æ b1 ö æbö = -0.7505 - 0.693(S) + 3.418ç ÷ + 0.922ç ÷+2.8949ç ÷ è d ø èdø èBø
2.
æhö æHö æb ö æyö - 1.7021ç ÷-4.7035ç ÷+0.5861ç 1 ÷+1.926ç ÷ èbø èdø èbø èdø In which S is the submergence ratio (S= tailwater depth / depth of gate opening), H is the head on the gate, B is the width of the flume and y is the obstruction distance, y=P-d, with P is the height of the weir. Equation 2 is valid within the following limitations: 1 £ y/d £ 4, 1 £ b/d £ 5, 0.5 £ b1/d £ 2, 0.164 £ b/B £ 0.656, 0.164 £ b1/B £ 0.656 0.25 £ b1/b £ 4, 1.25 £ S £ 5, 2.25 £ (H+h)/d £ 11.5. Combining the data used to develop equation 1 for free flow and that used to develop equation 2 for submerged flow, the present paper suggests the following general equation (R2=0.973 and SEE=0.324) for both free and submerged flow provided that S is assumed to be unity for free flow. Q = -4.668 - 0.467(S) 2g d 2.5 . 3. æbö æ b1 ö æhö æHö æbö æyö - 7.759ç ÷ + 4.891ç ÷ - 0.235çç ÷÷ + 0.233ç ÷ + .675ç ÷ - 4.839ç ÷ èPø èdø èdø èdø èdø è b1 ø The predictions of equations 1, 2 and 3 are comparable. They produce sometimes errors, which could not be accepted from accuracy point of view. When the non-dimensional discharges is converted into discharges, the accuracy is reduced and the correlation between measured and predicted discharge becomes significantly lower than 95% yielding a mean relative error of about 15%. This highlights the need of more practical, accurate and general prediction equation for the simultaneous flow to replace the regression models that were developed by the previous investigations. The main aim of the present paper is to propose a general model for predicting the combined flow over weirs and below gates for both free and submerged gates conditions utilizing the basic discharge equations of the weir and gates. Another aim is to use the artificial neural networks to predict the simultaneous discharge over weirs and below gates when they have unequal contractions. The results of both methods are compared.
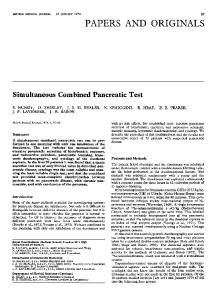
Theoretical analysis Figure 1 shows a definition sketch for the simultaneous flow over weirs and below submerged gates of unequal contractions. The discharge over the weir (Qw) can be calculated using the following equations adopted by (Kindsvater, Carter, 1957) for contracted weirs: 2 Qw = Cdwbe 2 g he1.5 4. 3 where he is the effective head on the weir, Cdw is the discharge coefficient of the weir, be is the effective width of weir. It should be mentioned that Cdw should be accurately estimated as a function of b/B and h/P. The discharge under the gate is calculated using the following equation adopted by (Rajaratnam, Subramanya, 1967). Q g = C dg db1 2g (H - h d ) 5. where Cdg is the discharge coefficient of the gate (as a function of d/H), b is the width of gate, H is the depth of water upstream the gate and hd is the depth of water just downstream the gate. For free discharge computations, hd is assumed zero in equation 5.
Assuming a factor F to account for the effect of interaction between the flow over weir and that below the gate, the simultaneous discharge could be obtained by adding equation 4. to equation 5. æ2 ö 6. Q = Fç C dw b e 2g h 1e.5 + C dg db1 2gH - h d ÷ è3 ø The interaction factor F is to be determined from experimental data. b h y
H ht
d
d
hd
b1 B Fig. 1 Definition sketch for simultaneous flow through combined systems consisted of contracted rectangular weir above contracted rectangular submerged gate with unequal contractions (Negm, 2000).
Experiments and data collection The experiments of the present study were conducted (Negm, 1995 and Negm, 2000) on a glass sided tilting flume of 9 m long working section. The flume is 30 cm wide and 30 cm deep. The water depths were measured by means of point gauges (of ±0.1 mm accuracy) mounted on instrument carriages. The discharge was measured by a pre-calibrated V-notch installed in a measuring tank. The measuring tank is located below the outlet of the flume at its downstream end and is connected directly to underground sump tank. The flume is equipped with a tail gate to control the tailwater depth. A centrifugal pump lifts the water from the underground sump to the flume inlet. The water that runs through the flume working section returns back to the sump tank via the measuring tank. Each of the tested models consisted of an upper part and a lower part. The upper part is a sharp crested rectangular contracted weir while the lower one is a contracted rectangular gate. The widths of the upper and the lower openings are unequal. The models were made from presbex sheets of thickness 12 mm beveled from all the edges (in contact with the flow) at 45o with sharp crests of thickness 1.5 mm. The sides of the models were provided with rubber sheets to ensure no leakage. The models were fixed to the flume at its middle section using two supports from the downstream side. The supports consists of presbex sheets of 2.5 cm wide, 10 cm long and 12 mm thick stacked to the flume side downstream of the model using silicon rubber. The flow rate ranged between 5 lit/sec and 25 lit/sec. The tests covered the same ranges as indicated below equation 1 and below equation 3. The following simple test procedure for submerged flow measurements was adopted: (a) The channel was adjusted to the horizontal position; (b) The weir model was fixed at the middle position from upstream of the flume; (c) The tailgate was adjusted to a particular position and then a certain discharge was allowed to pass; (d) When the flow stability was attained ( the upstream water level becomes constant) then the discharge, the upstream water level at a
distance of about 40 cm were measured, the water depth just downstream the gate and the tailwater depth were measured and (e) The procedure was repeated for each weir model using different discharges and at fixed tailwater depth, ht, but different downstream water depths, hd, for each model. The same procedure was followed for free flow when the effect of submergence is absent.
Calibration and verification of the prediction model The simultaneous discharges are calculated using equation 6 under the assumption of F =1 and compared with the measured simultaneous ones. It is found that significant errors are present due to the interaction between the two devices. The factor F is calculated for all observations and different approaches are used to evaluate its effect. Therefore, the interaction factor is plotted versus the different variables affecting the flow through the combined system. It is found that this factor is function of the flow and geometrical parameter of combined weir and gate devices. Plotting the values of F versus d/H and h/P indicated that F decreases with the increase of d/H and increases with the increase of h/P. Examining the variations of F with other variables, proved that F is a function of the dimensionless variables as given by equation 7. While for submerged flow, no clear trend is observed for F with any of the involved independent dimensionless variables. æb b b y d h ö F = f çç 1 , , , , , ÷÷ 7. p d B d d H è ø Therefore, for free flow, the following equation for F is found to produce satisfactory predictions. æb ö æbö æbö æ yö ædö æhö F = -0.318 + 0.039ç 1 ÷ + 10.061ç ÷ - 3.351ç ÷ + 1.858ç ÷ - 1.374ç ÷ - 0.206ç ÷ 8. èBø èdø èdø èHø èPø èdø Equation 8 has a determination coefficient of 0.963 and standard error of estimate of 0.017. For submerged flow, the use of an average value of F = 1.037 produces satisfactory prediction when used with equation 6. The simultaneous discharges are computed using equation 6 with F as defined by equation 8. The comparison between the actual measured discharges and the predicted ones using the present developed model is shown in Figure 2. Clearly, excellent agreement is obtained. The errors are examined. About 88% of the observation are within ± 5% error with percentage mean relative absolute error (MRAE%) of 1.5% for all data, 1.5% for free flow and 3.4% for submerged flow. It should be mentioned the interaction factor F was evaluated for other shapes of the openings combinations such as (i) V-notch above rectangular weir, (ii) rectangular weir above triangular gate and (iii) rectangular weir above rectangular gate of equal contractions in both cases of free and submerged flow (Negm et al., 2000). The expression of F for such cases are given by equation 9 æHö 9. F = a + bç ÷ èdø In which a and b are constants which depends on the flow condition and the shapes of the opening as shown in table 1.
Prediction using artificial neural networks Since the basics of the ANN and the training procedure were presented in the same proceedings by the same author in another work (Negm, 2002). Interested reader who are
looking for more information can consult any textbook in neural computing, e.g. (Schalkoff, 1997) or can refer to other previously published works in the related Journals (Grubert, 1995, Dibike, Abbott, 1999, Dibike, Minns, Abbott 1999 and Negm, 2002).
Predicted simultaneous discharge, L/sec
30.0
25.0
20.0
15.0
Sub. flow
10.0
Free flow 5.0 5.0
10.0
15.0
20.0
25.0
30.0
Measured simultaenous discharge, L/ssec Fig. 2 Prediction of equation 5 versus measurements for both free and submerged flow.
Table 1. Values of a and b of equation 9 Case Average F a b (i) 0.973 0.8987 0.0190 (i) 1.046 1.0839 -0.0095 (ii) * 0.969 0.7669 0.1591 (ii) * 1.039 0.9650 0.0030 (iii) 0.933 0.8330 0.0306 (iii) 1.052 1.0486 0.0008 *
Range of H/d 2.4-6.2 2.4-6.2 2.4-6.2 2.4-6.2 1.5-6.0 2.4-7.5
Flow below gate Free Submerged Free Submerged Free Submerged
It should be noted that the area of the inverted V-notch gate is (0.5 db1) instead of (db1) for rectangular gate where b1 stands for the bottom width of the gate.
Building, validating and testing the ANN model For the present application, it is desired to obtain an accurate prediction of the simultaneous discharge. ANN model is built for this purpose. The developed network consisted of three layers of size 7-6-1. The first layer to the represent the seven input dimensionless factors, namely, h/P, H/d, S, b/b1, b/d, b1/d and y/d. The output layer to represent the single target (discharge in L/s). The hidden layer consists of 6 neurons which was obtained by trials and errors by conducting many experiments using different number of neurons in each experiment starting by one upto 50 neurons. The best results were obtained at 6 neurons. An overtrained network or an undertrained one was obtained for higher or less number of neurons respectively. The best activation function that yields the highest performance of the network is the tansh. The network is initiated by random weights in the range ± 0.6. It is found that 500 iterations are enough for the network to produce general acceptable solution with
percentage mean relative absolute error of 1.03 for the test data set. A total number of about 290 examples is used in this application with 70% for training, 15% for validation and 15% for test. Once, a suboptimal solution is obtained, many computer experiments are performed with training starting at different positions each time (multiple starts) to check the stability of the network. The results of the network stability in terms of the correlation coefficient and the mean relative absolute error for 6 different experiments are evaluated. Results indicated that the best network doesn’t deviate by more than 2%. The best network model for the present application has a correlation coefficient of 0.986, mean relative error of 0.02 and root mean square error of 0.434. Figure 3 shows the comparison of the prediction of the developed ANN model with the measured data for both training and test data. Clearly good agreement is obtained. It should be noticed that about 93.4% of the observation are within ± 5% error with mean relative absolute error of 0.02. 30
ANN output, Q L/sec
25
20
15
Training data
10
Validation data Test data
5 5
10
15 20 Measured Q L/sec
25
30
Fig. 3 ANN output versus measured data for both training and test data sets.
ANN versus equation 6 Comparison between performance evaluation criteria for ANN model and equation 6 is presented in table 2 in terms of R2, mean relative absolute error (MRAE) and root mean square error (RMSE). Also, Figs. 4a and 4b present a comparison among predictions of ANN model, equation 6 and the measurements for submerged and for free flow respectively. Table 2 Performance evaluation criteria for equation 6 and ANN models Model Submerged flow data Free flow data R2 MRAE RMSE R2 MRAE RMSE Eq. 6 0.987 0.034 0.690 0.997 0.015 0.313 ANN 0.989 0.024 0.495 0.996 0.015 0.339 2 The values of R , MRAE% and RMSE for all data 0.990, 1.5% and 0.313 respectively for equation 6 while they are 0.993, 2.0% and 0.434 for ANN model.
30
(a) Submerged flow
25 20 15 10
Eq. 6 ANN
5 5
10 15 20 25 30 Measured discharge, Q L/sec
Predicted discharge, Q L/sec
Predicted discharge, Q L/sec
The values of the criteria indicated in table 2 show that the performance of both models is mostly similar. Figures 4a and 4b confirmed the above results as most of the measured and predicted values are very close the line of equality. 30
(b) Free flow
25 20 15 10
Eq. 6 ANN
5 5
10 15 20 25 30 Measured discharge, Q L/sec
Fig. 4 Comparison among predictions of equation 6, ANN model and measured discharges
Conclusions The following conclusions could be stated 1- The present and previously developed prediction regression models produce comparable prediction for the simultaneous discharge over weirs and below gates. 2- The use of the proposed model, equation 5, is much better than regression models in all aspects and considering all the evaluation criteria. 3- The results of the developed ANN model for predicting the simultaneous discharge compare well with those of equation 5 with slight better predictions.
References 1. Dibike Y.B. and Abbott M.B. 1999. Application of artificial neural networks to the simulation of a two dimensional flow. Journal of Hydraulic Research. 37 (4): 435-446 2. Dibike Y.B., Minns A.W., and Abbott M.B. 1999. Applications of artificial neural networks to the generation of wave equations from hydraulic data. Journal of Hydraulic Research. 37 (1): 81-97 and Discussion in 2000. 38 (4): 317-318 3. Grubert J.P. 1995. Application of neural networks in stratified flow: stability analysis. Journal of Hydraulic Engineering. 121 (7): 523-532 and Discussion in 1997. 123 (3): 253254 4. Kindsvater C.E. and Carter R.W. 1957. Discharge characteristics of thin plate weirs. Journal of Hyd. Div. Proc. ASCE. 83 (12):1-36. 5. Negm A.M. 1995. Characteristics of combined flow over weirs and under gate with unequal contractions. Proc. 2nd. Int. Conf. on Hydro-science and Engineering. ICHE-'95. March 2226. Tsighua University Press. Beijing. China. (Advances in Hydro-science and Engineering Vol. II. Part A, CHES & IRTCES, Editors): 285-292. 6. Negm A.M. 1996. Discharge prediction model for simultaneous underflow-overflow. Proc. 6th Int. Symp. on Flow Modelling and Turbulence Measurements. Florida. USA, Sep. 8-10. Balkema Publishers: 665-670.
7. Negm A.M. 2000. Characteristics of simultaneous overflow -submerged underflow: (unequal contractions). Engineering Bulletin. Faculty of Engineering. Ain Shams University. 35 (1): 137-154. 8. Negm A.M., Abdel-Aal G.M. and El-Saiad A.A. 2000. Generalized discharge equation for proposed simultaneous flow structures. Proc. Al-Azhar Eng. 6th Int. Conf. (AEIC). Cairo. Egypt. Sep. 1-4. 4: 247-257. 9. Negm A.M. 2002a. Prediction of hydraulic design parameters of expanding stilling basins using artificial neural networks. Egyptian Journal of Engineering Science and Technology (EJEST). 6 (1): 1-24. 10. Negm A.M. 2002b. Analysis and modeling of simultaneous flow through box culverts and over contracted broad-crested weirs. Proc. of 5th Int. Conf. on Hydro-science and Engineering. ICHE2002. Sept. 18-21. Warsw. Poland (CR-ROOM and Booklet of Abstracts). 11. Negm A.M. 2002c. Discussion of Analysis and formulation of flow through combined Vnotch-gate device. By Alhamid A.A.. Journal of Hydraulic Research, 40 (4). 12. Negm A.M., Al-Brahim A.M. and Alhamid A.A. 2002. Combined flow over weirs and under gates. Journal of Hydraulic research, 40 (4). 13. Neural Connections. 1998. SPSS Inc./Recognition Systems Inc. ANNs software and user manuals. 14. Rajaratnam N. and Subramanya K. 1967, Flow equation for the sluice gate. Journal of Irrigation and Drainage Div. Proc. ASCE. Sept.: 167-186. 15. Schalkoff R.J. 1997. Artificial neural networks. Computer Science Series. McGraw-Hill Co. Inc. New York. Notations The following symbols were used in this paper b width of gate or width of weir. b1 width of inverted V-notch gate. B width of channel. Cd coefficient of discharge (g for gate, w for weir). d height of gate opening. F defined factor=Qm/Qc. .g acceleration due to gravity. hd water depth just downstream the gate. he effective head on the weir. ht tailwater depth. h head on the weir. H water depth upstream the gate. Q discharge (w for weir and g for gate). P height of weir. R correlation coefficient. R2 coefficient of determination. MRAE = mean relative absolute error. SEE = standard error of estimate.