these refused connections were not counted as legitimate user sessions. 3. EVALUATION. Given the trace above, we extracted the total session time of each ...
Modeling Player Session Times of On-line Games Francis Chang Wu-chang Feng OGI@OHSU {francis,wuchang}@cse.ogi.edu ∗
ABSTRACT
Game
One of the most important aspects in determining the global traffic characteristics of on-line games is to model the traffic behavior of the client. While modeling the client ON-OFF times in web traffic has allowed researchers to generate accurate fractal models of aggregate web traffic, similar work has not yet been done for the domain of games. Previous work in client traffic behavior has shown that clients consume a nearly constant amount of resources when they are on. However, the distribution of the length of ON times for clients has not yet been established [1]. In this paper, we study the player session time distribution over a one-week trace of a popular on-line game server. Our results indicate that the session ON times of game clients steeply decays over time, with a knee at about 15-30 minutes. In addition, we show that the session time PDF can be fitted accurately with a Weibull distribution with parameters (β = 0.5, η = 20, and γ = 0), a result that diverges from previous studies of player session times [2].
Half-life Medal of Honor: Allied Assault Quake III Arena Battlefield 1942 Unreal Tournament Return to Castle Wolfenstein Unreal Tournament 2003 Soldier of Fortune 2: Double Helix America’s Army: Operations Neverwinter Nights
1.
INTRODUCTION
With the launches of Microsoft’s Xbox on-line game network and Sony’s Playstation 2 on-line game network, along with the development of emerging massively multi-player on-line games that allow for thousands of simultaneous players [3], it is clear that gaming traffic will soon grow to scales far beyond what is being observed today. While there has been a lot of work characterizing aggregate web traffic behavior as well as web client behavior, there has been very little work in doing the same for games. Because of the ∗
This work is supported by the National Science Foundation under Grant EIA-0130344 and the generous donations of Intel Corporation. Any opinions, findings, or recommendations expressed are those of the author(s) and do not necessarily reflect the views of NSF or Intel.
83121 7127 5027 4473 4240 3538 3052 2863 2303 1818
Table 1: Game popularity Thu Oct 31 12:00 2002 (Source: Gamespy)
tremendous increase in game traffic [4], it is important to understand the traffic demands that this emerging application imparts. While not indicative of all on-line games, the class of games known as “first-person shooters” has clearly dominated much of the observed gaming traffic. In this paper, we analyze the session behavior of game clients playing on a popular FPS game server and develop a source model for their ON times. We note that previous work has shown that when such clients are active, they impart almost a constant bit-rate load on the network. Section 2 describes a detailed game server trace we performed in order to analyze the session behavior of players in on-line games. Section 3 analyzes the session times of players in the trace and develops a source model that describes session times of players in the trace. Section 4 concludes with a discussion of the implications that these results have on traffic characterization of on-line games.
2. Permission to make digital or hard copies of all or part of this work for personal or classroom use is granted without fee provided that copies are not made or distributed for profit or commercial advantage and that copies bear this notice and the full citation on the first page. To copy otherwise, to republish, to post on servers or to redistribute to lists, requires prior specific permission and/or a fee. NetGames ’03 May 22-23, 2003, Redwood City, California USA Copyright 2003 ACM 1-58113-734-6/03/05 ...$5.00.
Players
BACKGROUND
In order to study a representative on-line game, we chose to characterize session behavior of a busy Counter-Strike server. Currently, Counter-Strike (a Half-Life modification) is the clearly the most dominant on-line game with the largest service footprint of any game at 35,000 servers and over 4.5 billion player minutes per month [5]. Table 1 shows a snapshot of the top on-line multi-player action games taken
Half-Life mod
Players
Counter-Strike Day of Defeat Team Fortress Classic Deathmatch The Specialists Firearms SvenCo-op Vampire Slayer Front Line Force Action Half-Life
74877 3303 3010 557 321 302 87 83 64 55
Table 2: Half-Life mod popularity Thu Oct 31 12:00 2002 (Source: Gamespy)
Start Time Stop Time Total Time Maps Played Player sessions
Apr 11 08:55:04 2002 Apr 18 14:56:21 2002 7 d, 6 h, 1 m, 17.03 s (626,477 sec) 339 16030
Table 3: mshmro trace information
in late October 2002. The table was generated via the GameSpy Arcade application [6], an on-line service used by players to find suitable game servers. GameSpy Arcade tracks and reports the number of players playing individual on-line games in real-time. As the table shows, Half-Life and its variants account for an order of magnitude more players than the next nearest game. The dominance of Half-Life goes back as far as 2000 [4], where measurements indicated that the application was generating a large percentage of all observed UDP traffic behind DNS and RealAudio traffic. Table 2 shows that of the people playing Half-Life variants, an overwhelming majority of them are playing Counter-Strike. Counter-Strike is architected as a client-server application with multiple clients communicating and coordinating with a central server that keeps track of the global state of the game. In the game, two teams continuously play backto-back rounds of several minutes in duration. Each team attempts to complete their objectives and foil those of the other team during the round. The round ends when one team manages to complete their mission, when one team eliminates the other team entirely, or when time runs out. When players are eliminated from a round, they become spectators until the next round. During this time, the player can shadow another player that has not been eliminated. The game itself is played on a variety of maps which rotate based on how the server is configured. Typically, maps are rotated every 30 minutes, allowing for over 10 rounds to be played per map. Depending on the hardware and configuration, a Counter-Strike server can support up to 32 simultaneous players. Previous work has shown that the network
load induced by clients when they are active is constant and is a result of the saturation of the narrowest last-mile link [1]. Given that network load for a client is relatively constant when connected, it is interesting to find out what the session times for players is in order to more accurately construct a source model for game traffic. To characterize session times for Counter-Strike, we used a trace from a popular CounterStrike (version 1.3) server located at cs.mshmro.com [7, 1]. It is important to note that the session time distributions are heavily dependent on the quality of the game server. Because of this, the server was set up to provide an experience that was as positive as possible. In particular, at the time of the trace, cs.mshmro.com had a high-speed connection to the Internet (OC-3 to Internet2, dual T3s to non-Internet2 sites) and a fast machine to run on (Dell Dimension 4300, Pentium 4, 1.8GHz, 512MB). In addition, maps were rotated every 30 minutes to prevent player boredom and modules for eliminating cheating and team killing [8, 9, 10, 11, 12] were added. While finding a server configuration that maximizes session times is not an exact science, our own personal experiences playing on the server indicated a configuration that encouraged long-term play. This was evidenced in the fact that the server quickly became heavily utilized 24/7 with connections arriving from all parts of the world irrespective of the time of day [4, 2, 13]. Table 3 summarizes the key characteristics of the trace. The trace covered over a week of continuous operation. Over 300 maps were played during this time frame and more than 16000 user sessions were established. Due to the popularity of the server, each user averaged almost 3 sessions for the week and more than 8000 connections were refused due to the lack of open slots on the server. Note that for our study, these refused connections were not counted as legitimate user sessions.
3.
EVALUATION
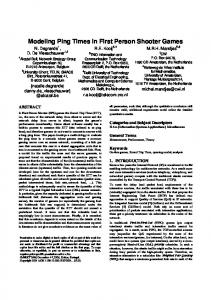
Given the trace above, we extracted the total session time of each player session contained in the trace. Figure 1(a) plots the session time histogram of the trace in unit increments of a minute. The figure shows, quite suprisingly, that a significant number of players play only for a short time before disconnecting and that the number of players that play for longer periods of time drops sharply as time increases. Note that in contrast to heavy-tailed distributions reported for most source models for Internet traffic, the session ON times for game players is decidedly not heavy-tailed. To further illustrate this, Figure 1(b) shows the cumulative density function for the session times of the one-week trace. As the figure shows, the probability of having a particular session time drops sharply with more than 99% of all sessions lasting less than 2 hours. In order to develop accurate source models for game traffic, it is useful to match a distribution to the probability density function of the session times. As the session times model “player” lifetimes, the PDF can be closely matched to a Weibull distribution, one of the most common distributions used to model lifetime distributions in reliability
1600
1
1400
0.9 0.8 0.7
1000 Probability
Number of players
1200
800 600
0.6 0.5 0.4 0.3
400
0.2
200 0
0.1
0
15
30
45
60 Minutes
75
90
105
0
120
0
30
60
(a) Histogram
90
120 150 Minutes
180
210
240
(b) CDF
Figure 1: Session time results for mshmro trace 0.2
0.15 PDF of mshmro player session times Weibull β=0.5, η=20, γ=0
0.15
Probability
Player failure rate
0.1
0.05
0.1
0.05
0
0
15
30
45
60 Minutes
75
90
105
120
Figure 2: Fitted Weibull distribution on session time PDF of mshmro trace engineering [14]. It is not surprising that this distribution fits, since quitting the game can be viewed as an attention “failure” on the part of the player. The generalized Weibull distribution has three parameters β, η, and γ and is shown below. f (T ) =
T −γ β β T −γ β−1 −( η ) ( η ) e η
In this form, β is a shape parameter or slope of the distribution, η is a scale parameter, and γ is a location parameter. As the location of the distribution is at the origin, γ is set to zero, giving us the two-parameter form for the Weibull PDF. f (T ) =
)β β T β−1 −( T ( ) e η η η
Using a probability plotting method [14], we estimated the shape (β) and scale (η) parameters of the session time PDF.
0
0
20
40
60
80
100
Minutes
Figure 3: Player failure rates for individual session times
As Figure 2 shows, a Weibull distribution with β = 0.5, η = 20, and γ = 0 closely fits the PDF of measured session times for the trace. Note that this result is in contrast to previous studies that have fitted an exponential distribution to session-times of multiplayer games [2]. Unlike the Weibull distribution which has independent scale and shape parameters, the shape of the exponential distribution is completely determined by λ, the failure rate. Due to the memory-less property of the exponential distribution, this rate is assumed to be constant. Figure 3 shows the failure rate for individual session durations over the trace. As the figure shows, the failure rate is not constant for shorter session times, thus making it difficult to accurately fit it to an exponential distribution. Inexplicably, the failure rate is higher for flows of shorter duration. While it is difficult to pinpoint the exact reason for
this, it could be attributed to the fact that Counter-Strike servers are notoriously heterogeneous. Counter-Strike happens to be one of the most heavily modified on-line games with support for a myriad of add-on features [8, 15]. Short flows could correspond to players browsing the server’s features, a characteristic not predominantly found in other games. In addition, this particular server was a friendly-fire server, a realistic setting in which team members are able to shoot each other. To protect the game from rampant teamkilling, a plugin was used to kick players for continuously killing their teammates. It may be possible that new players not cognizant of this plugin, were quickly kicked from the server. As part of future work, we hope to characterize session duration distributions across a larger cross-section of games in order to see how distributions vary between games and game genres.
[6] [7] [8] [9] [10]
[11] [12] [13]
4.
CONCLUSION
Unlike many source models used to predict Internet traffic, player session “ON” times follow a distribution that is not heavy-tailed. Session times, in fact, follow a simple Weibull distribution, a distribution that is commonly used to model lifetime distributions for reliability analysis. This work, along with previous studies showing a constant resource demand for active clients [1], allows for the construction of a partial source model for FPS-based on-line games. In order to more fully develop this source model, we are currently examining the inter-session arrival times of particular players. While previous work [2] and our own traces can elucidate inter-session arrivals for players to a particular server, such an analysis is inherently inaccurate since players often play on many different servers. We are attempting to extract such information via global player location services such as those provided by GameSpy [6] and by attempting to gain access to traces of centralized game authentication servers to develop a more accurate model for player “OFF” times. Such a model will allow for the construction of a complete source model for FPS games.
5.
REFERENCES
[1] W. Feng, F. Chang, W. Feng, and J. Walpole, “Provisioning On-line Games: A Traffic Analysis of a Busy Counter-Strike Server,” in Proc. of the Internet Measurement Workshop, November 2002. [2] T. Henderson and S. Bhatti, “Modelling User Behavior in Networked Games,” in ACM Multimedia, 2001, pp. 212–220. [3] GameSpy.com, “What’s This World Coming To? The Future of Massively Multiplayer Games,” http://www.gamespy.com/gdc2002/mmog. [4] S. McCreary and k. claffy, “Trends in Wide Area IP Traffic Patterns: A View from Ames Internet Exchange,” in Proceedings of 13th ITC Specialist Seminar on Measurement and Modeling of IP Traffic, September 2000, pp. 1–11. [5] AMDZone, “Valve Releases Hammer Port of Counter-Strike Server,” http://www.amdzone.com/
[14]
[15]
releaseview.cfm?ReleaseID=1050, 2003. GameSpy.com, “GameSpy: Gaming’s Home Page,” http://www.gamespy.com/, 2002. mshmro.com, ,” http://www.mshmro.com/. Half-Life Admin Mod Developers, “Half-Life Admin Mod Home,” http://www.adminmod.org/. Cheating-Death Developers, “Cheating-Death Home,” http://www.cheating-death.com/. CSCop Developers, “Project Info - CSCop for Counter-Strike,” http://sourceforge.net/projects/cscop. CSGuard Developers, “CSGuard Home,” http://www.olo.counter-strike.pl/. UDPSoft.com, “HLDS Ping Booster,” http://www.udpsoft.com/. T. Henderson, “Latency and User Behaviour on a Multiplayer Game Server,” in Networked Group Communication, 2001, pp. 1–13. ReliaSoft Corporation, “Life Data Analysis and Reliability Engineering Theory and Principles Reference from ReliaSoft,” http://www.weibull.com/lifedatawebcontents.htm, 2003. AMX Mod Developers, “AMX Mod Server Plugin,” http://amxmod.net/.


![[PDF] The Player of Games Popular Online - Google Sites](https://m.moam.info/img/260x300/pdf-the-player-of-games-popular-online-google-site_647846c8097c474b228d0391.jpg)