Computational & Mathematical Organization Theory 6, 361–379, 2000. c 2001 Kluwer Academic Publishers. Manufactured in The Netherlands. °
Modeling Relationships among Multiple Graphical Structures KARI CHOPRA AND WILLIAM A. WALLACE Department of Decision Sciences and Engineering Systems, Rensselaer Polytechnic Institute, Troy, New York 12180-3590, USA email:
[email protected] email:
[email protected]
Abstract Many researchers have investigated the social and cognitive processes underlying organizational behavior, with particular interest in understanding the interaction between the social and cognitive dimensions. Because of the widespread use of graphs as models of social and cognitive structures, these studies frequently encounter the problem of analyzing collections of graphical structures. Such analyses have used a variety of approaches to address specific aspects of such structures. However, no single unified approach has emerged that supports the several different types of analyses required. The purpose of this paper is to define such an approach, based on a mathematical model for capturing the relationships among multiple graphs, and to demonstrate its application to the investigation of social and cognitive structures in organizations. Keywords: social networks, graph theory, cognitive maps, influence diagrams
1.
Introduction
At the heart of organization theory is a desire to further our understanding of the social and cognitive phenomena driving organizational behavior. Research pertaining to this end has been conducted under the rubric of social network analysis, organizational cognition, and sociocognition. Such studies examine not only the underlying structures and processes, but also seek to develop a theory of the interplay between the social and cognitive dimensions. This has led to investigations of individual cognition of social structure, cognitive models at the supra-individual level, models of cognitive relations within social groups, and the correlation between cognition and social structure within a group. The use of graphical structures, including graphs, directed graphs, and networks, to model social and cognitive structures is widespread, and many researchers find themselves ultimately faced with the problem of analyzing collections of multiple graphs. This has resulted in a variety of disparate approaches, each tailored to a specific type of analysis. The contribution of the present paper is the development of a comprehensive modeling paradigm and accompanying methodology based on the concept of the metagraph, a graph which itself is composed of graphs. This model is capable of supporting a large number of analyses of social and cognitive structure, including comparing individual models, generating consensus models, modeling group cognitive structure, and correlating social structure with cognitive
362
CHOPRA AND WALLACE
structure. Furthermore, we provide an illustrative example and discuss how the model can be applied to the analysis of social and cognitive structures in organizations. The remainder of the paper is organized as follows. The second section presents the context for the present work. It discusses prior research in studies of social and cognitive structures in organizations, the use of graphs to model such structures, and the means by which the present work emerged out of prior research. The third section presents the metagraph model and methodology, while the fourth section contains an example illustrating the methodology. The fifth section discusses potential applications of the model to the study of social and cognitive structures. Finally, the conclusion provides a brief summary of the research.
2.
Background
In this section we review prior research on social structure and cognition in organizations, including consensus social structures, supra-individual cognitive models, modeling cognitive relations within a group, and linking cognitive structure with social structure. We then discuss the foundations of the present work and the fundamental premises on which it is based. Conventional social network models rely on data that is gathered by interviewing each member of the network about the ties in which he or she participates (Wasserman and Faust, 1994). An alternative is to model cognitive social structures (Krackhardt, 1987) that capture each member’s perception of the entire network. Thus one obtains a set of networks that may aggregated into a consensus model using a simple threshold rule. Alternatively, one can construct a consensus model by developing an appropriate probability distribution and obtaining estimates of the model parameters (Banks and Carley, 1994; Batchelder et al., 1997). Researchers in organization theory have frequently recognized the importance of cognitive models that extend beyond the individual, at the group, team, or organizational level (Walsh, 1995). Such models have been referred to by various names, including shared mental models (Kraiger and Wenzel, 1997) and collective cognitive maps (Axelrod, 1976). They have been linked to team performance (Carley, 1997; Kraiger and Wenzel, 1997), group decision making (Massey and Wallace, 1996; Rush and Wallace, 1997) and organizational learning (Lee et al., 1992). Analyses of shared cognitive models have focused on two areas: methods for comparing the models of individuals, and methods for constructing a shared model from a collection of individual models (Kraiger and Wenzel, 1997). Map comparisons have made use of similarity indices on the content (Carley, 1986; Dunn and Ginsberg, 1986) and structure (Dunn and Ginsberg, 1986; Zajonc and Worlfe, 1966) of two models, and of distance functions defined on the set of possible models (Carley, 1997; Langfield-Smith and Wirth, 1992; Rush and Wallace, 1997). Construction of a shared model is generally conducted by combining or aggregating individual models through various means, such as the intersection (Carley, 1986), union (Lee et al., 1992), arithmetic mean (Bougon et al., 1977; Ford and Hegarty, 1984), or central parameter of a probability distribution (Carley, 1997; Rush and Wallace, 1997).
MODELING RELATIONSHIPS AMONG MULTIPLE GRAPHICAL STRUCTURES
363
Many researchers have noted the relationship between cognitive and social structures. This has led to the development of models for capturing cognitive relations between actors, as well as empirical investigations of theories linking social structure to cognition. Models of cognitive relations within a group are rooted in the principle that cognitive as well as social relations exist between members of a group (Carley, in press) and can also be modeled as a network on a group of actors. Links between actors in the network represent a certain level of sharedness or similarity in their cognitive models, such as possessing common knowledge items (Contractor et al., 1998; Kameda et al., 1997) or similar structural properties (Dunn and Ginsberg, 1986). Studies linking cognition to social structure typically examine the effect on an individual’s cognitive model of the social relations in which the individual participates. It is hypothesized that one’s social position determines the type of information one receives, that expectations developed from the history of one’s social interactions can lead to systematic cognitive biases, and that cognitive processes directly involve one’s own perceptions of social locale (Pattison, 1994). In an extensive study of a group decision process, Carley (1986) posits a model of co-evolution in social and cognitive structures. Social structure exerts influence on cognitive structure by determining the information one receives and thus structuring patterns of knowledge, and cognitive structure influences social structure by causing one to seek out like-minded individuals and thus modify one’s interactions. The study showed a correlation between the interaction between two actors and the similarity of their cognitive models. It also found that tight social subgroups tended to be cognitively dominated by one individual, to lead to increased consensus over time, and to possess core cognitive models that were not shared by members outside the subgroup. Romney and Weller (1984), in a study of the accuracy of members of a group reporting on their own interactions, examined the relationship between reliability, defined as the correlation of each member’s knowledge with the aggregated group knowledge, and accuracy, defined as the correlation of the member’s knowledge with observed interaction data. They discovered a strong relationship between reliability and accuracy, and that the knowledge of reliable individuals is more highly correlated than that of less reliable individuals. Other studies have discovered a correlation between social centrality and degree of knowledge (Brewer, 1992), between cognitive centrality and social influence (Kameda et al., 1997), and between social position and cognitive similarity (Pattison, 1994; Walker, 1985). Throughout these studies, graphs have frequently been employed to model social and cognitive structures. A (directed) graph is mathematically defined by two sets: a nonempty finite vertex set, also known as a node set, and an edge (arc) set containing unordered (ordered) pairs of vertices (Behzad et al., 1979; Wasserman and Faust, 1994). Graphs may be visually represented using points to denote vertices and lines or arrows to denote edges or arcs between the points. Social networks, which model social structure in terms of interactions or ties between pairs of actors in a group, are graphs in which nodes correspond to actors and edges (or arcs) correspond to social ties between actors (Wasserman and Faust, 1994). They may be represented by undirected or directed graphs, depending on whether the social tie depicted is intrinsically symmetric or unidirectional. Graphs as measures of cognitive models have appeared in many different forms, including concept maps (Carley, 1986; Carley, 1997), cognitive maps (Axelrod, 1976; Bougon et al.,
364
CHOPRA AND WALLACE
1977; Ford and Hegarty, 1984; Langfield-Smith and Wirth, 1992; Lee et al., 1992), influence diagrams (Henrion et al., 1991; Massey and Wallace, 1996; Oliver and Smith, 1990; Rush and Wallace, 1997), and knowledge maps (Howard, 1989). In these models, nodes represent concepts or variables, and edges or arcs depict some type of relationship among them, such as causality, probabilistic dependence, or semantic closeness. Concept maps are undirected or directed graphs, cognitive maps are directed signed graphs that specifically model causal relations, and influence diagrams and knowledge maps are directed acyclic graphs modeling probabilistic dependencies between variables. Because of the widespread use of graphical models in studies of social and cognitive structures, many researchers find themselves faced with the problem of how to analyze collections of graphs (Banks and Carley, 1994; Batchelder et al., 1997; Bougon et al., 1977; Carley, 1997; Ford and Hegarty, 1984; Krackhardt, 1987; Langfield-Smith and Wirth, 1992; Lee et al., 1992; Rush and Wallace, 1997; Walsh, 1995). However, none of the existing approaches are designed to support the full range of analysis required: comparison of individual models (social or cognitive), construction of consensus models, modeling cognitive relations within a social group, and simultaneous analysis of social and cognitive structures. The purpose of this paper is to present a model and methodology that enables comprehensive analysis of multiple (social and/or cognitive) graphical structures. The model proceeds from two fundamental principles: modeling differences between graphs using a metric function, and operationalizing consensus as a graph that is central in some respect to the collection of graphs in question. A variety of metrics have been used to assess differences between graphs, such as the symmetric difference metric (Banks and Carley, 1994; Langfield-Smith and Wirth, 1992; Rush and Wallace, 1997), the weighted sum of differences in corresponding adjacency matrix entries (Hart, 1976), the square root of summed squared differences in corresponding adjacency matrix entries (Langfield-Smith and Wirth, 1992), the angle between the vectors corresponding to each adjacency matrix (Langfield-Smith and Wirth, 1992), the number of operations required to transform one graph into another in a graph grammar system (Gernert, 1981; Goddard and Swart, 1996), the order of the smallest distinguishing subgraph (Sobik and Sommerfeld, 1982), and the order of the smallest common supergraph (Buckley and Harary, 1990). Similarly, the notion of consensus as some form of central element has appeared in many forms, such as the mean (Bougon et al., 1977; Ford and Hegarty, 1984), the median (Barth´elemy and Monjardet, 1981; McMorris, 1990; Phillips and Warnow, 1996), and the center parameter of a probability model (Banks and Carley, 1994; Rush and Wallace, 1997). Even majority rule involves notions of a central element, since it is essentially a [0, 1]-threshold function employing the midpoint as its threshold (Krackhardt, 1987). The present work builds upon the method of metric inference for social networks introduced by Banks and Carley (1994), and later extended to the domain of influence diagrams (Rush and Wallace, 1997). This method posits a probability distribution on the space of graphs based on the definition of a metric, or distance function, on the set of graphs. The form of the model is analogous to the normal distribution. It contains a parameter representing a central graph and a dispersion parameter, and graphs are distributed according to their distance from the central graph. The symmetric difference metric, which calculates
MODELING RELATIONSHIPS AMONG MULTIPLE GRAPHICAL STRUCTURES
365
distance between graphs by counting the number of discrepancies in the edges or arcs of the graphs, was used in this work. As a result, calculation of the maximum likelihood estimator of the central graph is quite straightforward, and can be performed via a simple majority rule algorithm. It is noted that selecting a different metric function or different form for the probability distribution may result in more complicated solutions (Banks and Carley, 1994). The method supports standard statistical analyses, including goodness-of-fit tests, confidence regions, and hypothesis tests. It was tested against Krackhardt’s (1987) cognitive social structure data, and the authors found that the proposed distribution did not always provide a good fit to the data (Banks and Carley, 1994). Moreover, when used to generate consensus models from collections of influence diagrams, it was found that the symmetric difference metric had the effect of canceling out arcs in opposite directions; i.e., if the majority of the group placed an arc between two concepts, but the group was divided as to the direction of the arc, then the consensus model would completely omit the arc. It was proposed that this may not be contextually appropriate when applying the method to influence diagrams, since one loses information about the fact that some form of dependence exists between two variables (Mendon¸ca et al., 1998). Consequently, for the present work it was desirable to develop a method that was not tied to the use of a particular probability distribution or metric function, but could be expanded to consider different graph metrics and different means of identifying a central element. We introduce the concept of a metagraph, a graph whose vertex set is also composed of graphs, as the vehicle of analysis. Relationships between graphs in the metagraph are defined by a graph metric function, and consensus graphs are identified by applying graph-theoretic centrality techniques to the metagraph. We first detail the components of the metagraph methodology and then discuss its application to the analysis of social and cognitive structures in organizations. 3.
Methodology
The metagraph methodology consists of four components: the metagraph itself, a graphical structure that serves as the basis of analysis; graph metrics, distance functions that quantify differences between graphs; central elements, graph-theoretic methods used to determine consensus models, and confidence sets, statistical techniques for assessing the level of uncertainty in the consensus model. Each of these components is described in the following sections. 3.1.
Metagraph
A metagraph is simply a means for modeling relations between graphs. Thus we begin by presenting definitions for graphs and relations, from which we derive a formal definition of a metagraph. We then describe how the metagraph can be used to model collections of social or cognitive structures. A graph G is defined by a finite, nonempty set V = V (G), called the vertex set or node set of G, and a set E = E(G) of pairs of elements of V . If the elements of E are unordered pairs of vertices, then the graph G is undirected, and the set E is called the edge set of G. If
366
CHOPRA AND WALLACE
the elements of E are ordered pairs of vertices, then the graph G is directed, the elements of E are called arcs, and the set E is called the arc set of G. This definition is adapted from standard definitions in the graph theory literature (Behzad et al., 1979). We develop several ideas that may apply generally to either undirected graphs or digraphs. Thus, for the sake of brevity we use the term graph to apply generally to both types of graphs, and the term edge to refer to a member of the edge set or arc set. Where necessary, the directionality of the graph is explicitly specified. A relation R = R(Z ) on a set Z is defined as a subset of Z × Z . Any relation on a set Z is equivalent to a graph G where V (G) = Z and E(G) = R(Z ) (Gardiner, 1981). Given the above definitions for a graph and a relation, we can now define a metagraph in terms of these definitions. Let G be a set of graphs, and R = R(G) a relation defined on the set of graphs. Then the metagraph U is defined by V (U ) = G and E(U ) = R(G). In order to use the metagraph as a model of the relationships among social or cognitive structures, one must first define the vertex set of the metagraph; i.e., the types of graphs to be included in the metagraph. If the analysis aims to identify a consensus model, then one should define the vertex set to contain all graphs considered as possible candidates for the consensus model. For example, if one is analyzing a collection of social networks on a set of actors, then one may define the vertex set as all possible networks on the given set of actors. If one is analyzing a set of cognitive models, the vertex set may be defined as all possible models on the union of their concepts. Each individual model then corresponds to a graph defined on this union containing exactly the same edges as the original model; concepts not used in a model appear as isolated vertices in the corresponding graph. Alternatively, if the analysis aims to study the cognitive relations within a set of cognitive models, or if one wishes to determine the best consensus model from the given set, one may restrict the vertex set to contain just those models within the given set. The second step to defining a metagraph is to define a relation on the set of graphs. For this we rely on graph metrics, functions that compute the distance between a pair of graphs. By placing weights on the edges of the metagraph, we can model any graph metric by inserting an edge between each pair of graphs and assigning it a weight equal to the distance between the graphs. Moreover, we can use the metric to generate an unweighted metagraph by selecting a distance threshold and inserting an edge between two graphs if their distance falls below this threshold. The value chosen could be guided by theoretical concerns, or it could be determined empirically either by computing a statistic of the given sample of graphs or by observing how the structure of the metagraph changes as the threshold changes. 3.2.
Graph Metrics
Graph metrics are functions that calculate distances between pairs of graphs. They can be classified according to the type of graph to which they apply. In this work, we focus on three structural types of graphs: undirected graphs (e.g., concept maps or nondirectional social relations), directed graphs (e.g., cognitive maps or directional social relations), and directed acyclic graphs (e.g., influence diagrams or knowledge maps). We also utilize metrics that assume a common vertex set among the graphs. If the graphs have different vertex sets, one can simply redefine them by setting the vertex set of each equal to the union of their
MODELING RELATIONSHIPS AMONG MULTIPLE GRAPHICAL STRUCTURES
367
vertices, while leaving the edge set of each graph constant. Vertices that do not originally appear in a graph will then be present as isolated vertices. The present research defines graph metrics in terms of the matrices that correspond to the graph, building on prior work using the symmetric difference metric (Banks and Carley, 1994; Rush and Wallace, 1997). These metrics have the advantages of preserving the labels associated with the nodes of a graph, as well as being flexible and general enough to apply to a variety of domains. The use of matrix-based metrics in the present work implies the underlying assumption that substantive differences between graphical models of information are represented by the presence or absence of links between concepts. By expanding upon the symmetric difference metric to consider the reachability matrix of a graph as well as its adjacency matrix, we can capture both direct and indirect relationships between pairs of concepts. However, alternate indicators of substantive meaning, such as the prominence of each concept in the graph and correlations among links, are not captured by such metrics. The definition of metrics that model such differences, while not within the scope of the present effort, is identified as an open topic for further research. Before proceeding to define the metrics to be used in the present research, we first present formal definitions of the matrices upon which they are based. Given a graph G with vertex set V = {v1 , v2 , . . . , vn }, the adjacency matrix A is an n × n matrix where ai j = 1 if hvi , v j i ∈ E, and aij = 0 otherwise. The reachability matrix R is an n × n matrix where rij = 1 if there exists a path from vi to v j in G, and rij = 0 otherwise (Buckley and Harary, 1990). The present research combines these two matrices to obtain a single representation of both direct and indirect linkages in the graph. We introduce a new matrix, the linkage matrix L, as an n × n matrix given by L = 1/2(A + R). Thus, the value lij will equal unity if vi is adjacent to v j in G, one-half if v j is reachable but not adjacent from vi , and zero if v j is not reachable from vi . If the graph G is undirected, then the matrices A, R, and L are symmetric, whereas if G is a directed graph, these matrices are not necessarily symmetric. If G is a directed acyclic graph, then these matrices are necessarily antisymmetric. In fact, the product of symmetric entries in each matrix must be zero in order to satisfy the acyclic constraint; i.e., aij · aji = 0, rij · rji = 0, and lij · lji = 0. To facilitate the definition of metrics for acyclic directed graphs, we also define modifications of the above matrices that capitalize on the antisymmetry of these matrices. We can use this property to define upper triangular matrices that capture all information about the relations between a pair of nodes in a single matrix value, rather than distributed across two matrix values. Let us define a function u(X) that accepts a square matrix as its input and returns the corresponding upper triangular matrix by setting all lower triangular values to zero. Then we define the following matrices for acyclic directed graphs: the triangular adjacency matrix A0 = u(A − AT ), the triangular reachability matrix R0 = u(R − RT ), and the triangular linkage matrix L0 = u(L − LT ). Positive values of aij0 , rij0 , and lij0 indicate that the given relation extends from vertex vi to v j , while negative values indicate that the relation extends from vertex v j to vi . Another useful concept in discussing metrics on acyclic directed graphs is the dyad. A dyad is defined in social network theory as an unordered pair of nodes in a graph and the arcs that exist between them (Wasserman and Faust, 1994). The notation for a dyad is Dij = (aij , aji ). For an acyclic directed graph, a dyad may assume one of three values:
368
CHOPRA AND WALLACE
Dij = (0, 0), Dij = (1, 0), or Dij = (0, 1). The value Dij = (1, 1) is not permitted because it creates a cycle. It is readily apparent that the dyad is closely related to the triangular adjacency matrix; each upper entry aij0 of this matrix fully describes the dyad Dij , and is equal to the difference of the coordinates of the dyad. We present below several metric functions for undirected, directed, and directed acyclic graphs. The discussion makes use of the following notation when considering multiple graphs at once. Given two graphs G 1 and G 2 , the adjacency matrices of these two graphs are denoted by A1 and A2 , respectively, and individual entries of the adjacency matrices are denoted as aij1 and aij2 , respectively. The notation is analogous for the reachability and linkage matrices, as well as for dyads. 3.2.1. Metrics for Undirected Graphs. The first metric is the symmetric difference used in prior work on metric techniques for estimating a central graph (Banks and Carley, 1994; Rush and Wallace, 1997). This function simply counts the number of discrepancies in the edges of two graphs. Its functional form for undirected graphs is given by the following (Banks and Carley, 1994): d1 (G 1 , G 2 ) =
1 tr[(A1 − A2 )2 ], 2
(1)
where the trace operator tr sums the diagonal entries of a matrix. An alternative formulation that achieves the same result, adapted from Langfield-Smith and Wirth (1992), is defined as: d1 (G 1 , G 2 ) =
¯ 1 X X ¯¯ 1 aij − aij2 ¯. 2 i j
(2)
The second type of metric to be used for undirected graphs employs the same type of difference measure, but it is applied to the linkage matrix instead of the adjacency matrix. This allows the metric to model not only differences in direct links between concepts, but in indirect links as well. Because the linkage matrix is not a 0-1 matrix but also contains values equal to 0.5, the second functional form given above is more appropriate for modeling the differences between graphs. Thus the second metric is defined as follows: d2 (G 1 , G 2 ) =
¯ 1 X X ¯¯ 1 lij − lij2 ¯. 2 i j
(3)
3.2.2. Metrics for Directed Graphs. The symmetric difference metric has previously been applied to directed graphs (Banks and Carley, 1994; Mendon¸ca et al., 1998; Rush and Wallace, 1997), and thus will also be utilized by the present research. However, when applied to directed graphs the metric function takes on a slightly different form than that given previously; this modified function is given below (Banks and Carley, 1994): d3 (G 1 , G 2 ) = tr[(A1 − A2 )T (A1 − A2 )].
(4)
MODELING RELATIONSHIPS AMONG MULTIPLE GRAPHICAL STRUCTURES
369
This metric can be equivalently expressed as (Langfield-Smith and Wirth, 1992): d3 (G 1 , G 2 ) =
XX¯ ¯ ¯a 1 − a 2 ¯. ij ij i
(5)
j
As for undirected graphs, we can extend the above metric to consider indirect as well as direct relationships between nodes of the graphs. Thus we use the same functional form, but apply it to the linkage matrix instead of the adjacency matrix. This yields the following metric: d4 (G 1 , G 2 ) =
XX¯ ¯ ¯l 1 − l 2 ¯. ij ij i
(6)
j
3.2.3. Metrics for Directed Acyclic Graphs. Note that either of the above metrics for directed graphs might also be applied to directed acyclic graphs. However, depending on the substantive meaning of the graphs, these metrics may not be the most contextually appropriate. Consider the effect of applying the symmetric difference metric d3 to a pair of directed acyclic graphs. When applied to a 0-1 matrix, the symmetric difference assesses a cost of one unit whenever a value of the matrix is changed. Therefore, given two nodes of a graph, this metric considers the two arcs between them separately, rather than considering the dyad as a unit. Suppose that we are given three graphs G 1 , G 2 , and G 3 . These graphs are identical except for the value of one dyad; this is equivalent to asserting that the graphs’ triangular adjacency matrices differ in exactly one value, aij0 . The arc hi, ji is present in G 1 , reversed in G 2 , and omitted in G 3 , resulting in the values a 0 1ij = 1, a 0 2ij = −1, and a 0 3ij = 0. Then we have d3 (G 1 , G 2 ) = 2, while d3 (G 1 , G 3 ) = d3 (G 2 , G 3 ) = 1. The effect of the metric is to assign a double penalty to arc reversal, causing the deletion of an arc to result in a graph judged more similar to the original than simply reversing the direction of an existing arc. However, this double penalty effect for arc reversal is not necessarily desirable. A more contextually appropriate measure might be to consider the dyad as a whole, rather than considering the individual arcs of the dyad separately. Let us define the following difference measure on the triangular adjacency matrix, such that it is similar to the symmetric difference metric but adjusts for the case where a 0 1ij = 1 and a 0 2ij = −1 (or vice versa). This function simply compares the values in the two graphs of an individual dyad and returns a zero if they are identical, a one otherwise: ¡ 1 2¢ δ a 0 ij , a 0 ij =
(
1, ¯ 01 ¯ ¯a − a 0 2 ¯, ij ij
if a 0 1ij · a 0 2ij , = −1; otherwise.
(7)
The corresponding metric defined on the graphs themselves then consists of the sum of the individual differences between dyads: d5 (G 1 , G 2 ) =
X X ¡ 1 2¢ δ a 0 ij , a 0 ij . i
j
(8)
370
CHOPRA AND WALLACE
An alternate functional form that computes the identical result is given as follows: d5 (G 1 , G 2 ) =
° 1 1 X X ¯¯ 0 1 2¯ 2° a ij − a 0 ij ¯ + °a 0 ij |−|a 0 ij °. 2 i j
(9)
The metric given above can be expanded to examine indirect links between concepts by applying it to the linkage matrices of the graphs rather than the adjacency matrices. As before, we rely on the same difference measure of a single dyad value. However, we apply it to the values of the triangular linkage matrices instead of the triangular adjacency matrices. Thus we have the following: ( ¡ 01 02 ¢ 1, if l 0 1ij · l 0 2ij , = −1; ¯ ¯ (10) γ l ij , l ij = ¯l 0 1 − l 0 2 ¯, otherwise. ij
ij
This difference measure will produce identical results for values of lij0 equal to 0, 1, or −1. For values of lij0 equal to 0.5, we have the following results: γ (0.5, 0) = γ (0.5, 1) = 0.5; γ (0.5, −0.5) = 1; γ (0.5, −1) = 1.5. The results are analogous for values of lij0 equal to −0.5. Thus the measure assesses a half penalty for changing between no link and an indirect link, or between an indirect link and a direct link; a full penalty for reversing the direction of an indirect link; and a penalty and a half for combining a change between an indirect link and a direct link with a reversal of direction. The corresponding metric function for the graphs themselves is given below: X X ¡ 1 2¢ γ l 0 ij , l 0 ij . (11) d6 (G 1 , G 2 ) = i
j
The second functional form given above for d5 does not produce the same results as d6 when applied to the linkage matrix. The metric assesses a penalty of 0.5 if the actual value of an entry changes by 0.5; otherwise it assesses a penalty of 1, as opposed to assessing a penalty of 1.5 for changing both the direction and the direct/indirect nature of a link. Applying this function to the triangular linkage matrix therefore results in a new metric as follows: d7 (G 1 , G 2 ) =
3.3.
° 1 1 X X ¯¯ 0 1 2¯ 2° l ij − l 0 ij ¯ + °l 0 ij |−|l 0 ij °. 2 i j
(12)
Central Elements
According to our fundamental premises, we can identify a consensus model from a collection of graphs by finding an element that is central in some sense to the given group of graphs. In the present work, we draw upon the graph theory literature to identify appropriate types of central elements, or graph centers, and apply them to the metagraph. While there are a variety of central elements defined in the graph theory literature, we have selected three as being contextually appropriate to the problem of constructing consensus: the center, the median, and the betweenness center. We first present formal definitions of these central
371
MODELING RELATIONSHIPS AMONG MULTIPLE GRAPHICAL STRUCTURES
elements in terms of a single graph. We then discuss how they are applied to the metagraph and describe their substantive interpretation. The center C(G) focuses on minimizing the maximum distance between any two vertices in the graph. It is defined as follows (Buckley and Harary, 1990): ¯ io h n ¯ max d(u, w) . C(G) = v ∈ V (G) ¯ max d(v, w) = min w∈V (G)
u∈V (G)
(13)
w∈V (G)
The median M(G) minimizes the total (or equivalently, average) distance between any two vertices in the graph. It is defined as (Buckley and Harary, 1990): ¯ #) " ¯ X X ¯ d(v, w) = min d(u, w) . M(G) = v ∈ V (G) ¯ ¯ w∈V (G) u∈V (G) w∈V (G) (
(14)
The betweenness center of a graph yields those vertices that frequently appear between other pairs of vertices, where a vertex w is said to be between vertices u and v if it lies on a shortest path from u to v. The definition given in the literature focuses on the proportion of paths occupied by a vertex; in the context of a communications network, this measures the degree of control one actor exerts over communications between a pair of actors (Buckley and Harary, 1990; Freeman, 1977). However, when working with a metagraph we are dealing with abstract relations for which the concept of proportion of control has no significant substantive meaning. We are more interested in simply observing which vertices frequently appear between pairs of others. We define the u − w betweenness value buw (v) of a vertex v as a binary value that is unity if v is between u and w and zero if it is not. The betweenness center BC(G) maximizes the sum of the betweenness values over the entire graph: ¯ ¯ ¯ BC(G) = v ∈ V (G) ¯ ¯ (
X {u,w}⊆V (G)
" buw (v) = max
x∈V (G)
X
#) buw (x)
.
(15)
{u,w}⊆V (G)
These centers can also be extended to accommodate weights assigned to the vertices of the graph (Buckley and Harary, 1990). Letting ω(v) denote the weight assigned to a vertex v, we can define the weighted center WC(G), the weighted median WM(G), and the weighted betweenness center WBC(G) as follows: ¯ n ¯ WC(G) = v ∈ V (G) ¯ max ω(w)d(v, w) w∈V (G) io h max ω(w)d(u, w) ; = min u∈V (G) w∈V (G) ¯ ( ¯ X ¯ WM(G) = v ∈ V (G) ¯ ω(w)d(v, w) ¯ w∈V (G) #) " X ω(w)d(u, w) ; = min u∈V (G)
w∈V (G)
(16)
(17)
372
CHOPRA AND WALLACE
¯ ¯ ¯ WBC(G) = v ∈ V (G) ¯ ¯ " (
= max
x∈V (G)
X
ω(u)ω(w)buw (v)
{u,w}⊆V (G)
X
ω(u)ω(w)buw (x)
#) .
(18)
{u,w}⊆V (G)
When identifying a consensus graph, we want to consider all of the graphs in the metagraph as possible candidates for the summary graph. However, we want to ensure that only the graphs in the given collection are used to evaluate whether a particular candidate is a good summary graph. We accomplish this by assigning a weight of zero to every graph in the metagraph that is not included in the given collection of graphs. This causes terms involving these graphs to drop out of equations [16]–[18]. While these graphs remain viable candidates for the consensus graph, they do not exert any influence over its structure. The graphs contained within the given collection can either be unweighted (assigned weights equal to unity), or they can be weighted to reflect factors such as source credibility. The substantive interpretation of each of the graph centers can be understood as follows. The center minimizes the worst case difference between the consensus graph and the given collection of graphs, thus focusing on preventing too high a level of dissent with any one graph from the given set. The median minimizes the average difference between the consensus graph and the given set of graphs, thus maximizing the average level of agreement between the given graphs and the consensus graph. The betweenness center yields a central graph that most frequently appears as a middle ground between two graphs in the given collection, thus maximizing the level of pairwise agreement between graphs in the given set. The selection of a particular type of central element for identifying a consensus graph depends on the goals of the researcher and the context of the problem. The researcher may choose a specific type of central element, or may combine and compare the results of more than one type of central element. An important point to consider is that the solution of a graph centrality problem is not always unique; i.e., the center, median, or betweenness center of a metagraph may contain more than one graph. In such cases, the graphs contained in a particular central element can be considered as equally viable alternatives for the consensus graph. If desired, one could pool together information from multiple types of central elements. If a graph appears in more than one central element, it can be considered a stronger candidate for the consensus graph. 3.4.
Confidence Sets
In many cases it is desirable to consider a given collection of graphs as a sample of a random variable, where each graph represents one measurement or observation of that variable. Then the consensus graph is a statistic of the sample of graphs. However, because the random variable of interest is a graph rather than a real number, its probability distribution may be unknown or analytically intractable, thus preventing the use of conventional statistical analyses based upon a parametric probability model. In such cases one can generate a confidence set on the consensus graph using the technique of nonparametric bootstrapping
MODELING RELATIONSHIPS AMONG MULTIPLE GRAPHICAL STRUCTURES
373
(Banks and Carley, 1994; Rush and Wallace, 1997). This is a computationally intensive technique that develops an empirical distribution of the statistic of interest (the consensus graph) by generating a large number of resamples from the original sample. We have extended the technique to accommodate weights on the graphs in the sample, as shown below. Let 100(1 − α)% denote the desired confidence level; B the number of bootstrap , Gn replications (typically B = 1000); n the number of graphs in the sample; G 1 , G 2 , . . .P the graphs in the sample; ω1 , ω2 , . . . , ωn the weights on the graphs in the sample, Ä = ωi the sum of the weights in the sample, pi = ωi /Ä the empirical probability of each graph in the sample, and 1 a resampling increment such that 1 ≤ ωi for all i = 1, . . . , n and Ä/1 is a whole number (or as near as possible). The bootstrap method for generating a confidence set is then implemented according to the following procedure, adapted from Banks and Carley (1994). 1. Compute the central element from the original sample of graphs G 1 , . . . , G n . 2. Generate a resample from the original sample as follows (note that for an unweighted sample, by letting 1 = 1 the following is equivalent to sampling with replacement from the original sample of graphs): a) Initialize the resample to contain the entire original sample, but with a weight of zero on each graph. b) Obtain a sample G k from the empirical distribution specified by pi , i = 1 . . . n. Increment the weight of G k in the resample by 1. c) Perform the preceding step Ä/1 times, so that the final sum weight of the resample is equal to the sum weight of the original sample. 3. Compute the central element of the resample. Record the graph(s) G j that appear(s) in the resample. 4. Perform steps 2-3 B times. For each graph G j that appears as a central element of a appears. resample, maintain a frequency count c j of how many times itP 5. Assign each central graph G j a frequency probability f j = c j / c j and rank the graphs in order of decreasing probability. P 6. Construct the confidence set by selecting the first m graphs such that j=1...m f j ≥ 1−α. Graphs contained in the confidence set can be interpreted as competing alternatives for the consensus graph, with the associated frequency probability as a quantitative measure of the support for a particular graph. Once constructed, the confidence set can be displayed graphically as in a histogram, and can identify a set of alternative consensus graphs for P a decision maker. In addition, one can compute the entropy E = − f j ln f j of the confidence set to provide a quantitative measure of the overall level of uncertainty. 4.
Example
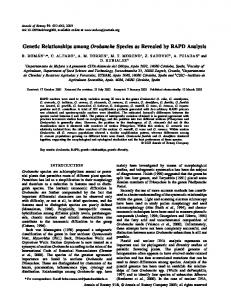
We illustrate the methodology with a brief example. Suppose we wish to construct a sociallybased consensus knowledge map for a small group working within an organization, drawing upon information we obtain from a social network of their professional interactions. We
374
Figure 1.
CHOPRA AND WALLACE
Social structure and cognitive models of a group.
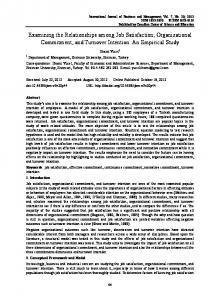
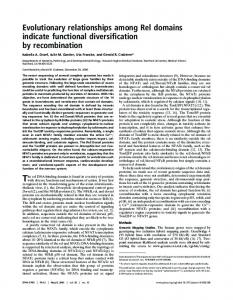
model the group as shown in figure 1, which displays both the social structure of the group and the knowledge map possessed by each member. We assign weights to the group members according to the number of social ties in which they participate. These weights are then applied to the members’ knowledge maps in constructing the consensus map. To determine the consensus map, we first define an appropriate metagraph. In this example, each member has articulated a knowledge map on a common set of concepts, so we define the vertex set of the metagraph to contain all possible knowledge maps on those concepts. To define the edges of the metagraph, we select the metric d5 defined for acyclic directed graphs, which counts the discrepancies in dyads between two graphs. We identify a consensus map(s) by computing central elements of the metagraph using the weights derived from the social network. A portion of the corresponding metagraph and the resulting central elements are shown in figure 2. Central elements are outlined in bold shapes: diamonds denote the center, squares denote the median, and circles denote the betweenness center. By combining the social network, metagraph, and central elements, we obtain a model that simultaneously captures the social structure, cognitive structure, and areas of consensus within the group. Note that one map appears in all three types of central elements, lending further support to this map as the best consensus map. Note also that the knowledge map of the most heavily weighted member of the group appears in two types of central elements. This demonstrates the effect of assigning weights to the knowledge maps, causing the consensus model to gravitate toward the maps with the highest weights. We generate confidence sets for the central elements via bootstrapping. The results are displayed graphically in figure 3. Graphs in the confidence set are displayed on the horizontal axis, while the vertical axis indicates the frequency with which each graph appeared in the central element over all bootstrapping trials. If we focus on the top tier of each confidence set, we can narrow the candidates down to just one or two models for each type of central element. Moreover, the knowledge map that originally appeared in all three central elements also appears in the top tier of both the center and the median. Thus this map seems to provide the best overall consensus map.
MODELING RELATIONSHIPS AMONG MULTIPLE GRAPHICAL STRUCTURES
Figure 2.
5.
375
Constructing consensus models: determining central elements of the metagraph.
Applications
Earlier we identified a variety of problems encountered in studies of social and cognitive structure in organizations and noted the need for a comprehensive model that supports the variety of analyses required to address these problems. Now that we have presented the methodology and illustrated it with an example, we briefly discuss how it may be applied to analyses of social and cognitive structure in organizations. Comparing graphical structures. The graph metric functions presented herein provide a direct means for comparing pairs of graphs. Moreover, these can be extended to measure differences over more than two graphs by computing a desired statistic of the pairwise distances, or by examining network-level properties, such as cohesion or centrality, of the metagraph containing just the graphs in the collection. Generating consensus models. Given a collection of graphical models, either social or cognitive, a consensus model (or set of alternatives) can be identified using the process illustrated in the example. The key decisions to be made are defining the set of candidate consensus graphs (the vertex set of the metagraph), selecting an appropriate graph metric to model relationships between graphs (the edge set of the metagraph), and choosing a type of central element to generate a consensus graph.
376
Figure 3.
CHOPRA AND WALLACE
Confidence sets for central elements of metagraph.
MODELING RELATIONSHIPS AMONG MULTIPLE GRAPHICAL STRUCTURES
377
Modeling cognitive relations within a social group. The metagraph provides a means for modeling cognitive relations in a structure identical in form to a social network. One can construct a binary relation on the collection of members’ graphs by selecting an appropriate graph metric and inserting a link in the metagraph if the distance between two members’ graphs falls below a desired threshold. One could then apply standard social network analyses to the metagraph to identify such features as cognitive positions, roles, cohesion, and centrality. Correlating social structure and cognitive structure. Given a social network and a metagraph model of a cognitive relation on a social group, we can perform analyses that examine correlations between the two structures. Does shared social position correlate with shared cognitive position (or with high cognitive similarity, i.e. small cognitive distance)? Do members of a social block also share the same cognitive block? Do socially central members of the group also tend to be cognitively central? These analyses can be supported by applying existing social network techniques to both the cognitive and social structures of a group.
6.
Conclusion
In this paper we have examined research linking the social and cognitive dimensions of organizations, noting the frequent use of graphical structures as models of social and cognitive structures. We proposed that these efforts could be greatly aided by the development of a methodology for analyzing collections of multiple graphical structures. This methodology should be flexible and comprehensive enough to support the range of analyses required. We have proposed a methodology based on the concept of the metagraph, a graph which itself is composed of graphs, and demonstrated its application to the analysis of social and cognitive structures in organizations.
References Axelrod, R. (Ed.) (1976), Structure of Decision: The Cognitive Maps of Political Elites, Princeton University Press, Princeton, NJ. Banks, D. and K. Carley (1994), “Metric Inference for Social Networks,” Journal of Classification, 11, 121–149. Barth´elemy, J.P. and B. Monjardet (1981), “The Median Procedure in Cluster Analysis and Social Choice Theory,” Mathematical Social Sciences, 1, 235–267. Batchelder, W.H., E. Kumbasar and J.P. Boyd (1997), “Consensus Analysis of Three-Way Social Network Data,” Journal of Mathematical Sociology, 22(1), 29–58. Behzad, M., G. Chartrand and L. Lesniak (1979), Graphs and Digraphs, Wadsworth International Group, Belmont, CA. Bougon, M., K. Weick and D. Binkhorst (1977), “Cognition in Organizations: An Analysis of the Utrecht Jazz Orchestra,” Administrative Science Quarterly, 22, 606–639. Brewer, D.D. (1992), “A Note on the Relationship Between Centrality and Cultural Knowledge in a Professional Network,” Connections, 15, 21–28. Buckley, F. and F. Harary (1990), Distance in Graphs, Addison-Wesley, Redwood City, CA. Carley, K. (1986), “An Approach for Relating Social Structure to Cognitive Structure,” Journal of Mathematical Sociology, 12(2), 137–189. Carley, K.M. (1997), “Extracting Team Mental Models Through Textual Analysis,” Journal of Organizational Behavior, 18, 533–558.
378
CHOPRA AND WALLACE
Carley, K.M. (1999), “On the Evolution of Social and Organizational Networks,” in S.B. Andrews and D. Knoke (Eds.) Special Issue of Research in the Sociology of Organizations on “Networks in and Around Organizations,” Vol. 16, JAI press, Inc. Stanford, CT, pp. 3–30. Contractor, N.S., D. Zink and M. Chan (1998), “IKNOW: A Tool to Assist and Study the Creation, Maintenance, and Dissolution of Knowledge Networks,” in T. Ishida (Ed.) Community Computing and Support Systems, Vol. 1519, Springer-Verlag, Berlin. Dunn, W.N. and A. Ginsberg (1986), “A Sociocognitive Network Approach to Organizational Analysis,” Human Relations, 39(11), 955–975. Ford, J.D. and W.H. Hegarty (1984), “Decision Makers’ Beliefs About the Causes and Effects of Structure: An Exploratory Study,” Academy of Management Journal, 27(2), 271–291. Freeman, L.C. (1977), “A Set of Measures of Centrality Based on Betweenness,” Sociometry, 40(1), 35–41. Gardiner, C.F. (1981), Modern Algebra, Ellis Horwood Limited, Chichester. Gernert, D. (1981), “Distance or Similarity Measures Which Respect the Internal Structure of the Objects,” Methods of Operations Research, 43, 329–335. Goddard, W. and H.C. Swart (1996), “Distances Between Graphs Under Edge Operations,” Discrete Mathematics, 161(1-3), 121–132. Hart, J.A. (1976), “Comparative Cognition: Politics of International Control of the Oceans,” in R. Axelrod (Ed.) Structure of Decision: The Cognitive Maps of Political Elites, Princeton University Press, Princeton, NJ. Henrion, M., J.S. Breese and E.J. Horvitz (1991), “Decision Analysis and Expert Systems,” AI Magazine, 12(4), 64–91. Howard, R.A. (1989), “Knowledge Maps,” Management Science, 35(8), 903–922. Kameda, T., Y. Ohtsubo and M. Takezawa (1997), “Centrality in Sociogcognitive Networks and Social Influence: An Illustration in a Group Decision-Making Context,” Journal of Personality and Social Psychology, 73(2), 296–309. Krackhardt, D. (1987), “Cognitive Social Structures,” Social Networks, 9, 109–134. Kraiger, K. and L.H. Wenzel (1997), “Conceptual Development and Empirical Evaluation of Measures of Shared Mental Models as Indicators of Team Effectiveness,” in M.T. Brannick, E. Salas and C. Prince (Eds.), Team Performance Assessment and Measurement: Theory, Methods, and Applications, Lawrence Erlbaum Associates, Mahwah, NJ, USA. Langfield-Smith, K. and A. Wirth (1992), “Measuring Differences Between Cognitive Maps,” Journal of the Operational Research Society, 43(12), 1135–1150. Lee, S., J.F. Courtney, Jr. and R.M. O’Keefe (1992), “A System for Organizational Learning Using Cognitive Maps,” Omega, 20(1), 23–36. Massey, A.P. and W.A. Wallace (1996), “Understanding and Facilitating Group Problem Structuring and Formulation: Mental Representations, Interaction, and Representation Aids,” Decision Support Systems, 17, 253–274. McMorris, F.R. (1990), “The Median Procedure for n-Trees as a Maximum Likelihood Method,” Journal of Classification, 7, 77–80. Mendon¸ca, D., R. Rush and W.A. Wallace (1998), “Knowledge Elicitation from Distributed Experts,” Rensselaer Polytechnic Institute, Department of Decision Sciences and Engineering Systems, Troy, NY, manuscript submitted for publication. Oliver, R.M. and J.Q. Smith (Eds.) (1990), Influence Diagrams, Belief Nets and Decision Analysis, John Wiley & Sons, Chichester. Pattison, P. (1994), “Social Cognition in Context: Some Applications of Social Network Analysis,” in S. Wasserman and J. Galaskiewicz (Eds.) Advances in Social Network Analysis, Sage Publications, Thousand Oaks, CA. Phillips, C. and T.J. Warnow (1996), “The Asymmetric Median Tree—A New Model for Building Consensus Trees,” Discrete Applied Mathematics, 71, 311–335. Romney, A.K. and S.C. Weller (1984), “Predicting Informant Accuracy From Patterns of Recall Among Individuals,” Social Networks, 6, 59–77. Rush, R. and W.A. Wallace (1997), “Elicitation of Knowledge From Multiple Experts Using Network Inference,” IEEE Transactions on Knowledge and Data Engineering, 9(5), 688–696. Sobik, F. and E. Sommerfeld (1982), “A Graph Theoretic Approach for Representation and Classification of Structured Objects,” Paper presented at the 1982 European Conference on Artificial Intelligence, Orsay, France. Walker, G. (1985), “Network Position and Cognition in a Computer Software Firm,” Administrative Science
MODELING RELATIONSHIPS AMONG MULTIPLE GRAPHICAL STRUCTURES
379
Quarterly, 30(1), 103–130. Walsh, J.P. (1995), “Managerial and Organizational Cognition: Notes From a Trip Down Memory Lane,” Organization Science, 6(3), 280–321. Wasserman, S. and K. Faust (1994), Social Network Analysis, Cambridge University Press, Cambridge. Zajonc, R.B. and D.M. Worlfe (1966), “Cognitive Consequences of a Person’s Position in a Formal Organization,” Human Relations, 19(2), 139–150. Kari Chopra earned a B.A. in Mathematics in 1994 from Western Kentucky University in Bowling Green, Kentucky. She received an M.S. in Operations Research and Statistics in 1997 from Rensselaer Polytechnic Institute in Troy, New York. She is currently a doctoral candidate in the Department of Decision Sciences and Engineering Systems at Rensselaer Polytechnic Institute. Her research interests include intelligent systems, group decision support systems, and knowledge management. William A. Wallace is Professor, Decision Sciences and Engineering Systems, Rensselaer Polytechnic Institute. As a researcher and a consultant in Managemnt Science and Information Systems, Professor Wallace has over 25 years experience in and research on the development of decision support systems for industry and government. He is presently engaged in the application of artificial intelligence to problems in incident management and emergency response, issues in trust and ethical decision making, and in studying the impact of visualization technologies on problem solving and decision making. Professor Wallace has, since 1990, authored and edited 6 books and over 70 articles and papers-out of a total of over 200 archival publications. He has held academic positions at CarnegieMellon University and the State University of New York at Albany, was a research scientist at the International Institute of Environment and Society, Science Center, West Berlin, Germany and a project engineer at Illinois Institute of Technology Research Institute; was Visiting Professor, Polyproject: Risk and Safety of Technical Systems, Swiss Federal Institute of Technology, Zurich, and is a Navy veteran. He was selected as a Visiting U.S. Faculty, Management Information Systems, Decision Support Systems, National Center for Industrial Science and Technology Management Development, Dalian, People’s Republic of China. Professor Wallace recently was an Expert, Division of Civil and Mechanical Systems, National Science Foundation, and Consultant, Board on Infrastructure and the Constructed Environment, National Research Council, National Academies. National and international media including USA Today, Associated Press, Christian Science Monitor and Business Week has reported on his research. His awards include the Horwood Critique Prize for the Outstanding Paper of the Urban and Regional Information Systems Association Conference, and the International Emergency Management and Engineering Conference Award, for Outstanding Long-Term Dedication to the Field of Emergency Management. His educational background includes a B.Ch.E. from Illinois Institute of Technology and a Master of Science and Doctorate in Management Science from Rensselaer Polytechnic Institute.