MODELING & SIMULATION OF PYROLYSIS: INFLUENCE OF PARTICLE SIZE AND TEMPERATURE B.V. BABU and A.S. CHAURASIA Department of Chemical Engineering, Birla Institute of Technology & Science, Pilani-333031 (Rajasthan), India. Email:
[email protected]
ABSTRACT: In the present study, a mathematical model to describe the pyrolysis of a single solid particle of biomass is used to study the influence of particle size and temperature in the pyrolysis of biomass. The pyrolysis rate has been simulated by a kinetic scheme involving three reactions (primary and secondary): two parallel reactions and a third for secondary interactions between volatile and gaseous products and the char. Finite difference method using pure implicit scheme is used for solving heat transfer equation and Runge-Kutta 4th order method for chemical kinetics equations. The model equation is solved for cylindrical pellets, spheres, and slab geometries of equivalent radius ranging from 0.00025 m to 0.013 m, and temperature ranging from 303 K to 2700 K. Some very interesting trends are found, especially with respect to the effect of temperature on final pyrolysis time. The final pyrolysis time first decreases at lower values of temperature and then increases as temperature is further increased, providing an optimum value of temperature at which final pyrolysis time is minimum. This interesting phenomenon, which was not reported by investigators earlier, is well explained by means of the pyrolysis kinetics. Key Words: Pyrolysis, Modeling, Heat transfer, Simulation, Particle size Nomenclature b B G1 C1 G2 C2 CB C G1
= geometry factor (slab=1, cylinder=2, sphere=3) = virgin biomass = gases and volatiles 1
C C1
= concentration of C1 , kg/m3
C G2
= concentration of G 2 , kg/m3
C C2
= concentration of C 2 , kg/m3
Cp
= specific heat, J/kg K
= char 1 = gases and volatiles 2 = char 2 = concentration of B , kg/m3 = concentration of G1 , kg/m3
h H k kg
= convective heat transfer coefficient, W/m2 K = modified Biot number = thermal conductivity, W/m K
k1 , k 2 , k 3 l n1 , n2 , n3 Pr Q r R Re l t T T0 Tf x ∆H ∆τ ∆x
= rate constants, s-1
ρ α τ θ ε σ
= thermal conductivity of gas, W/m K = axial length of cylinder, m = orders of reactions, dimensionless = Prandtl number = heat of reaction number, m3/kg = radial distance, m = radius for cylinder and sphere; half thickness for slab, m = Reynolds number = time, s = temperature, K = initial temperature, K = final temperature, K = dimensionless radial distance = heat of reaction, J/kg = axial grid length, dimensionless = radial grid distance, dimensionless = density, kg/m3 = thermal diffusivity, m2/s = dimensionless time = normalized temperature = emissivity coefficient = Stefan Boltzmann constant
INTRODUCTION The pyrolysis process consists of the thermal degradation of biomass feedstock, in the absence of oxygen/air, leading to the formation of solid (charcoal), liquid (tar and other organics) and gaseous products (H2, CO2, CO). The study of pyrolysis is gaining increasing importance, as it is not only an independent process, but it is also a first step in the gasification or combustion process. The overall process of pyrolysis can be classified into primary and secondary stages. The heat changes due to the chemical reactions and phase changes contribute to a temperature gradient as a function of time, which is nonlinear. Inside the pyrolyzing particle, heat is transmitted by the following mechanisms: (a) conduction inside solid particle, (b) convection inside the particle pore, (c) convection and radiation from the surface of the pellet. For simplicity it is assumed
that heat is transmitted inside the solid by conduction only. The heat transfer coefficient represents the overall effect of the above mechanisms. Hence, the influence of particle size and temperature in pyrolysis and the corresponding optimum parameters are important in the design of these reactors. Though the temperature effect has been studied earlier, studies on high temperatures covering the entire range of pyrolysis reactions are not available in literature.
BRIEF REVIEW OF THE LITERATURE According to Srivastava and Jalan (1994), the pyrolysis process has a great future in the world.
The various modeling studies appearing in the literature present different
versions or enrich the model suggested by Bamford et al. (1946). According to this model, the equation for heat conduction in a pyrolyzing solid is combined with those for heat generation, assuming first order kinetics. However, the heat transfer equation does not consider the effect of change of density as a function of time. Fan et al. (1977) developed a model for pyrolysis process, which includes heat and mass transfer in the particle. The reaction is considered to be first order with respect to initial particle concentration, and also product concentrations cannot be analyzed from the above model as the secondary reactions were not considered. Miyanami et al. (1977) incorporated the effect of heat of reaction in the above model. The model developed by Bamford et al. (1946), was used by Tinney (1965), Roberts and Clough (1963), Tang and Neil (1964), Shafizadeh (1978) and was modified by Kung (1972) in order to incorporate the effects of internal convection and variable transport properties. However, no specific kinetic mechanism was suggested to predict the concentration of the various components produced during pyrolysis. Kansa et al. (1977) included the momentum equation for the motion of pyrolysis gases within the solid. A suitable kinetic mechanism has not been utilized and the solution to the heat and momentum balance equation is based on arbitrary boundary conditions. Studies have been carried out on pyrolysis of biomass and other substances by Srivastava
et al. (1996), Di Blasi (1998), Demirbaş (2002), Boutin et al. (2002), Mastral et al. (2002), Bryden et al. (2002), and others. Many of the above studies have not included
the secondary reactions in pyrolysis kinetics.
Kansa et al. (1977) pointed out that
secondary reactions are essential to match fully the experimental observations. Keeping the above drawbacks of the existing models in view, Babu and Chaurasia (2002a) presented the kinetic model, which considered the secondary reactions in pyrolysis kinetics. This kinetic model was utilized by Babu and Chaurasia (2002b) and the model was developed for pyrolysis of a single biomass particle, which includes kinetics and heat transfer effects in the particle. The temperature profiles obtained by Babu and Chaurasia’s model (2002b) were compared with (1) those predicted by Pyle and Zaror (1984) in which they utilized Bamford’s model, (2) their experimental data, and (3) the temperature profile predicted by Jalan and Srivastava (1999), for different operating conditions. The simulated results obtained by Babu and Chaurasia’s model (2002b) was in excellent agreement with the experimental data much better than the agreement with the models proposed by Jalan and Srivastava (1999) and Bamford (1946).
METHODOLOGY & SCOPE OF STUDY 1. MODELING (a) Chemical Kinetics Model The pyrolysis reactions can be described by means of following scheme as proposed by Babu and Chaurasia (2002a). Though for brevity the details could be avoided, for clarity and continuity, the pyrolysis reactions and the heat transfer model are presented below: Virgin biomass B ( n1 order decay) Reaction 1
Reaction 2 Reaction 3
(Volatile + Gases)1 + (Char)1 ( n2 order decay)
(Volatile + Gases)2 + (Char)2
( n3 order decay)
This model indicates that the biomass decomposes to volatiles, gases and char. The volatiles and gases may further react with char to produce different types of volatiles, gases, and char where the compositions are different. Therefore, the primary pyrolysis
products participate in secondary interactions (Reaction 3), resulting in modified final product distribution. The kinetic equations for the mechanism shown above are as follows: dC B n n = − k 1C B 1 − k 2 C B 1 dt
dCG 1 dt dCC 1 dt
dt
n
n3
(2)
n
n
n3
(3)
= k 2 C B 1 − k 3C G 1 2 C C1 n
n3
(4)
n
n3
(5)
= k 3C G 1 2 C C1
dt dCC 2
n
= k 1C B 1 − k 3 C G 1 2 C C 1
dCG 2
(1)
= k 3C G 1 2 C C1
Adding equations (1), (3) and (5) gives,
dCC 1 dCC2 dC B n + + = − k 1C B 1 dt dt dt
(6)
which is equal to dρ/dt. Hence, dρ n = − k1C B 1 dt
(7)
The values of rate constants k1, k2 and k3 are taken from Koufopanos et al. (1991). (b) Heat Transfer Model Consider a cylinder of radius R, length l and radial thickness dr. Assume length of cylinder to be so large that heat transfer takes place in radial direction only. It is assumed that heat flows in one dimension and that heat transfer inside the particle occurs by conduction only. Based on the above assumptions, the equation representing the energy balance is given by
b − 1 dT d d 2T dρ + (− ∆H ) − ( C p ρT ) = k + 2 dt dr dt r dr
(8)
The final form of equation (8) in dimensionless form is given by,
dθ b − 1 dθ d 2θ QR 2 k1 (C B ) n1 = + + dτ x dx dx 2 α
(9)
The initial and boundary conditions in dimensionless forms are: Initial condition:
τ = 0; θ ( x,0) = 1
(10)
Boundary conditions:
τ > 0; x = 0,
dθ =0 dx
(11)
τ > 0; x = 1,
dθ = −θ H dx
(12)
The following dimensionless groups are introduced to obtain equation (9).
α=
k ρCp
(13)
x=
r R
(14)
τ=
θ=
αt
(15)
R2
Tf − T
(16)
T f − T0
[
(
R 2 3 H = h + ε σ T 3 + T 2T f + T f T + T f k Q=
(− ∆H ) + C pT
ρ C p (T f − T0 )
)]
(17)
(18)
2. METHOD OF SOLUTION
The equation (9) along with initial and boundary conditions given by equations (10)-(12) are solved by finite difference method using pure implicit scheme. The temperature profiles obtained from the heat transfer model based on initial conditions serve as an input to the chemical kinetics model. The equations (1)-(5) are solved by Runge-Kutta fourth order method. The values of various parameters employed in the present study are listed in Tables 1 and 2. 3. SCOPE OF STUDY
In the present work, the effect of particle size, orders of reactions and temperature on pyrolysis of biomass particle have been studied and optimum parameters have been found, utilizing the model developed by Babu and Chaurasia (2002b). The wide ranges of temperature (303-2700 K) and pellet diameters (0.0005-0.026 m) are considered. The work carried out in the present study is important and useful for optimal design of the biomass gasifiers, reactors, etc. It is very useful in the design of industrial pyrolysis units also.
ANALYSIS & KEY RESULTS
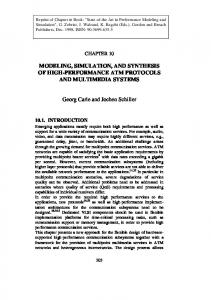
The simultaneous kinetic and heat transfer model developed by Babu and Chaurasia (2002b) was compared with the experimental data reported by Pyle and Zaror (1984), Bamford’s model used by Pyle and Zaror (1984) and the model developed by Jalan and Srivastava (1999). Typical temperature profiles are shown in Figs. 1-3. Fig. 1 shows the temperature profile as a function of time at the centre (i.e. x=0) of the cylindrical pellet of radius 0.003 m. This was compared with profiles obtained by Jalan and Srivastava (1999) and the experimental data obtained by Pyle and Zaror (1984) at the centre of the cylindrical pellet. It was found that the model developed was in excellent agreement with the experimental data better than the agreement with the Jalan and Srivastava’s model (1999). Figs. 2 and 3 show the temperature profiles as a function of dimensional radial distance for the final temperature of 643 K and 753 K respectively. The temperature profiles obtained were in much better agreement with the experimental
data of Pyle and Zaror (1984) when compared to the other two models. The values used in Figs. (1)-(3) are given in Tables 3-5 also for quantitative comparison of Babu and Chaurasia’s model (2002b) with the earlier models and the literature data. In all the cases it was found that the average percentage error and standard deviation from experimental data were significantly less in the model developed by Babu and Chaurasia (2002b) as compared to the other models. Fig. 4 shows the temperature profile as a function of radial distance for cylindrical pellet of various radii at 900 K at the time of completion of pyrolysis for orders of reactions of n1=1, n2=n3=1.5 . It is found that as the particle radius increases, the time for completion
of pyrolysis also increases. Time required for completion of pyrolysis of particle of radius 0.00025 m is least (53 s), while it is maximum for particle radius of 0.013 m (717 s).
For smaller particle of radii 0.00025 m and 0.001 m, there is no change in
temperature along the radial position, while for the other particle radii it is minimum at the centre and maximum at wall. Fig. 5 shows the temperature profile as function of radial distance for final temperature of 1200 K. It is seen that as the temperature increases, the pyrolysis completes faster. The trends obtained are same as that of Fig. 4 and can be explained similarly. Fig. 6 shows the temperature profile as a function of radial distance at 900 K at the time of completion of pyrolysis for orders of reactions of n1=0, n2=n3=1.5. The trends obtained are same as discussed earlier. When comparison
is made between Figs. 4 and 6, it is found that the time of completion of pyrolysis is less for orders of reactions of n1=0, n2=n3=1.5 as compared to n1=1, n2=n3=1.5 for all particle radii. This is due to the fact that for orders of reactions of n1=0, n2=n3=1.5, the model equations (1)-(3) become independent of the initial biomass concentration as discussed by Babu and Chaurasia (2002a). Based on the observation made in Figs. 4 and 5 above that as the temperature increases the pyrolysis completes faster, the model is simulated for wide range of temperatures ranging from 300 K to 2700 K and particle radii ranging from 0.00025 m to 0.013 m and the results are presented in Figs. 7, 8 and 9 for particle radii of 0.005m and 0.00025 m for cylinder and for particle radius of 0.005 m for sphere. Interestingly, it is found that as the temperature increases, time of completion of pyrolysis decreases up to certain extent giving the optimum pyrolysis time and then goes on increasing with further increase in
temperature. For the particle radius of 0.005m, the optimum time of completion of pyrolysis is found to be 88 s for final furnace temperature of 1645 K as shown in Fig. 7. This can be well explained by the pyrolysis kinetics with the help of data presented in Tables 6 and 7 for optimum final furnace temperature of 1645 K and 2100 K respectively. As the final furnace temperature is increased from 1645 to 2100 K, the decrease in concentration of biomass is more for 2100 K up to certain time (74 s). The maximum concentration of char 1 is obtained in 38 s for final furnace temperature of 2100 K as compared to 46 s for 1645 K. So after 38 s the concentration of char 1 decreases, and hence the consumption of biomass also decreases for final furnace temperature of 2100 K. It is also observed that after 74 s, the decrease in concentration of biomass is less for 2100 K as compared to 1645 K, because the char 1 left is less for 2100 K as compared to 1645 K. So the time of completion of pyrolysis to reach the desired final concentration of biomass (i.e. zero) increases though the final furnace temperature is more. Similar explanation could be given for the results shown in Figs. 8 and 9 also. The optimum values of the parameters are given in Table-8. From the Table8, it is observed that the final pyrolysis time and final pyrolysis temperature are less for sphere as compared to cylinder for the same radius of 0.005 m. Fig. 10 shows the temperature profiles for different geometries (slab, cylinder and sphere) as the function of radial distance at the time of completion of pyrolysis. The radii of cylinder and sphere are taken as half the thickness of slab. It is found that pyrolysis is faster in case of sphere (pyrolysis time=153 s) and slowest for slab (pyrolysis time=296 s), while the trend in temperature profiles obtained for all the three geometries being same.
Geometrically the sphere has got a more heat absorbing capacity as
compared to cylinder and slab and it is the least for slab. Mathematically it is reflected in the value of parameter b (b=1, 2 and 3 for slab, cylinder and sphere respectively) in the model equation (9) and hence the observed trends in temperature profile.
CONTRIBUTION TO THEORY, PRACTICE, POLICY & TECHNOLOGY
As discussed above, it is seen from Figs. 1-3 that the temperature profiles obtained by Babu and Chaurasia’s model (2002b) are in much better agreement with the experimental
data of Pyle and Zaror (1984) when compared to Jalan and Srivastava’s model (1999) and Bamford’s model (1946). Thus, the experimental results of Pyle and Zaror (1984) were in accordance with the predictions of the theory based on the data presented here. The knowledge of temperature profiles is very important and essential in the design of pyrolysis reactor and biomass gasifiers. Because, due to the exothermic and endothermic nature of the pyrolysis reactions, as a designer one should know, in priori, the extent of amount of supply and/or removal of heat. Due to high operating temperatures, there is a danger of hot spot formation and subsequently resulting in reactor runaway in the exothermic catalytic reactions. The modeling and simulation results of the present study and their close agreement with the reported experimental data substantiates the importance and contribution to theory, practice and technology, keeping the dangers mentioned above in view. Biomass gasification and pyrolysis are the most important areas in renewable energy on which the government in general, and MNES (Ministry of Non-Conventional Energy Sources) in particular are very much focused and lot of policy decisions have been made to encourage the use of these energies. From this perspective, the results of present study would be definitely useful in policy decision-making.
SUMMARY
The pyrolysis rate has been simulated by two parallel primary reactions and a third secondary reaction between the volatile and gaseous products and char. The secondary reactions are responsible for carbon enrichment of the final residual. The study is carried out for wide range of temperature from 303-2700 K and of particle diameter from 0.0005-0.026 m. As the particle size increases, the time required for completion of pyrolysis at a certain pyrolysis temperature and the effect of secondary reactions increase. It is observed that, for particle sizes below 1mm, the process is controlled by the primary pyrolysis reactions and, possibly, by the external heat transfer. For particles greater than 1mm, heat transfer, primary pyrolysis and secondary pyrolysis control the pyrolysis process. The pyrolysis is fast for zeroth order as compared to first order of reaction 1, as the rates are independent of initial biomass concentration for zeroth order.
Some interesting trends have been obtained, especially with respect to effect of final furnace temperature on completion of pyrolysis time. The results obtained using a wide range of operating conditions in the present study show that the final pyrolysis time initially decreases and then increases as the final temperature is increased, giving an optimum final pyrolysis time corresponding to final temperature. The above interesting trends are observed for different orders of reactions and for different geometries. These interesting trends that were not reported earlier could be well explained from the kinetics by systematically generating huge data upon simulating the model equations. The work carried out in the present study is important and useful for optimal design of the biomass gasifiers, reactors, etc. It is very useful in the design of industrial pyrolysis units.
700
Temperature (K)
600
500 LEGEND Pyle & Zaror (Experimental) Present model Jalan & Srivastava's model
400
300
0
50
100
150
200
250
Time (s) Fig. 1. Temperature profile as a function of time at the centre of the cylindrical pellet. (R=0.003 m, T0=303 K, Tf=643 K, x=0)
Temperature (K)
600
500
LEGEND Pyle & Zaror (Experimental) Present model Jalan & Srivastava's model Bamford's model
400
300 0.0
0.2
0.4
0.6
0.8
1.0
Radial distance (-) Fig. 2. Temperature profile as function of radial distance (R=0.011 m, T0=303 K, Tf=643 K, t=4 min).
700
Temperature (K)
600
500 LEGEND Pyle & Zaror (Experimental) Present model Jalan & Srivastava's model Bamford's model
400
300 0.0
0.2
0.4
0.6
0.8
1.0
Radial distance (-) Fig. 3. Temperature profile as function of radial distance (R=0.011 m, T0=303 K, Tf=753 K, t=3 min).
920
53 s 71 s
Temperature (K)
880
193 s 840 403 s 800
717 s
LEGEND 0.005 m 0.009 m 0.013 m 0.001 m 0.00025 m
760
720 0.0
0.2
0.4
0.6
0.8
1.0
Radial distance (-) Fig. 4. Temperature profile as a function of radial distance for various particle radii at 900 K at the time of completion of pyrolysis (n1=1,n2=n3=1.5,T0=303 K, Tf=900 K).
37 s
1200 43 s
Temperature (K)
1120 108 s 1040 248 s 960 880
LEGEND 0.005 m 0.009 m 0.013 m 0.001 m 0.00025 m
471 s
800 0.0
0.2
0.4
0.6
0.8
1.0
Radial distance (-) Fig. 5. Temperature profile as a function of radial distance for various particle radii at 1200 K at the time of completion of pyrolysis (n1=1,n2=n3=1.5,T0=303 K, Tf=1200 K).
900
7s
Temperature (K)
850 15 s 800 750 LEGEND 0.005 m 0.009 m 0.013 m 0.001 m 0.00025 m
70 s 700 162 s 650
290 s
0.0
0.2
0.4
0.6
0.8
1.0
Radial distance (-) Fig. 6. Temperature profile as a function of radial distance for various particle radii at 900 K at the time of completion of pyrolysis (n1=0,n2=n3=1.5,T0=303 K, Tf=900 K).
300
Time (s)
250
200
150
100
50 500
1000
1500
2000
2500
Temperature (K) Fig. 7. Time of completion of pyrolysis as a function of temperature for particle radius of 0.005 m. (n1=1, n 2=n3=1.5,T0=303)
100 90
Time (s)
80 70 60 50 40 30 800
1000
1200
1400
1600
1800
Temperature (K) Fig. 8. Time of completion of pyrolysis as a function of temperature for particle radius of 0.00025 m. (n1=1, n2=n3=1.5,T0=303)
240
Time (s)
200
160
120
80
800
1200
1600
2000
2400
Temperature (K) Fig. 9. Time of completion of pyrolysis as a function of temperature for spherical particle of radius 0.005 m (n1=1, n2=n3=1.5,T0=303).
885 153 s
Temperature (K)
870 855
193 s
840 825 LEGEND slab Cylinder Sphere
810 296 s 795 0.0
0.2
0.4
0.6
0.8
1.0
Radial distance (-) Fig. 10. Temperature profile as a function of radial distance for different geometries at the time of completion of pyrolysis (n1=1,n2=n3=1.5,R=0.005 m, T0=303 K, Tf=900 K).
Table-1. Values of Parameters used in the numerical solution of the model Property Convective heat transfer coefficient Wood specific heat
Value h = 8.4 W/m K C p = 1112.0 + 4.85(T − 273), J/kg K
Source P&Z K
Char specific heat
C p = 1003.2 + 2.09(T − 273), J/kg K
K
Wood thermal conductivity Char thermal conductivity Heat of reaction Initial density of wood
k = 0.13 + 0.0003(T − 273), W/m K k = 0.08 − 0.0001(T − 273), W/m K ∆H = −255000 J/kg ρ 0 = 650 kg/m3
K K K K
Initial thermal diffusivity of wood
α = 1.79 × 10 −7 m2/s
2
J&S
P&Z: Pyle & Zaror (1984); K: Koufopanos et al. (1991); J&S: Jalan & Srivastava (1999)
Table-2. Nominal values of Parameters employed in the present study Parameters
Geometry factor Initial concentration of B
Values b =2, dimensionless C B 0 =650 kg/m3
Initial concentration of G1
C G1 =0 kg/m3
Initial concentration of C1
C C1 =0 kg/m3
Initial concentration of G 2
C G2 =0 kg/m3
Initial concentration of C 2
C C2 =0 kg/m3
Order of reaction 1 Order of reaction 2 Order of reaction 3 Particle radius range Initial temperature
n1 =0, dimensionless n2 =1.5, dimensionless n3 =1.5, dimensionless R =(0.00025-0.011) m T0 =303 K
Final temperature range
T f =(303-1000) K
Emissivity coefficient Stefan Boltzmann constant
ε =0.95, dimensionless σ = 5.67 × 10 −8 W/m2 K4
0
0
0
0
Table-3. Comparison of present model results with those of earlier models for various stages of pyrolysis (time) at the centre of cylindrical pellet (R = 0.003 m, T0 = 303 K, Tf = 643 K) Time (s)
Pyle and Zaror (1984) (Experimental) 0 303 20 397 40 493 60 541 80 581 100 609 150 641 200 648 Average Percentage Error Standard deviation
Temperature Babu and Chaurasia’s Model (2002b) 303 400 493 552 588 610 634 640 0.75 0.0106
Jalan and Srivastava’s Model (1999) 303 387 478 533 574 602 630 639 1.56 0.0189
Table-4. Comparison of present model results with those of earlier models for pyrolysis time = 4 min (R = 0.011 m, T0 = 303 K, Tf = 643 K) x
Pyle and Zaror (1984) (Experimental)
0 483 0.3 493 0.5 510 0.7 525 0.9 580 Average Percentage Error Standard deviation
Temperature Babu and Jalan and Chaurasia’s Srivastava’s Model (2002b) Model (1999) 482 469 493 480 512 499 537 524 568 556 0.94 2.40 0.0156 0.0305
Bamford’s Model (1946)
473 485 495 520 550 2.55 0.0329
Table-5. Comparison of present model results with those of earlier models for pyrolysis time = 3min (R = 0.011 m, T0 = 303 K, Tf =753 K) x
Pyle and Zaror (1984) (Experimental)
0 500 0.3 520 0.5 570 0.7 600 0.9 658 Average Percentage Error Standard deviation
Temperature Babu and Jalan and Chaurasia’s Srivastava’s Model (2002b) Model (1999) 496 487 515 506 548 539 594 584 649 639 1.60 3.26 0.0220 0.0384
Bamford’s Model (1946)
480 500 540 570 620 4.78 0.0540
Table-6. Simulated results with the optimum temperature (1645 K) for pyrolysis of cylindrical pellet of radius 0.005 m (n1=1; n2=n3=1.5)
t
T
CB
C G1
C C1
C G2
C C2
1.0 15.0 30.0 38.0 39.0 46.0 47.0 48.0 73.0 74.0 75.0 76.0 88.0
303.041416 421.921449 620.145975 657.662178 662.221267 703.340007 711.305786 720.086499 1220.206339 1234.605217 1248.412790 1261.670650 1387.710904
650.000000 649.965228 535.048255 385.407963 366.467356 230.944809 210.836541 190.575671 0.038576 0.026305 0.018079 0.012521 0.000253
0.000000 0.000003 14.281696 44.324157 46.767841 57.246921 58.023858 58.567103 2.747890 2.364912 2.043245 1.771999 0.414538
0.000000 0.034769 99.831749 179.732538 184.470246 184.793708 180.265779 174.558063 21.643747 21.253188 20.926480 20.651856 19.287125
0.000000 0.000000 0.419150 20.267671 26.147278 88.507281 100.436911 113.149581 312.784893 313.177797 313.506098 313.781812 315.149042
0.000000 0.000000 0.419150 20.267671 26.147278 88.507281 100.436911 113.149581 312.784893 313.177797 313.506098 313.781812 315.149042
Table-7. Simulated results with temperature = 2100 K for pyrolysis of cylindrical pellet of radius 0.005 m (n1=1; n2=n3=1.5)
t
T
CB
C G1
C C1
C G2
C C2
1.0 15.0 30.0 38.0 39.0 46.0 47.0 48.0 73.0 74.0 75.0 76.0 88.0 89.0 152.0
303.073899 462.544327 650.049746 695.304910 703.247479 800.150481 825.229412 855.242754 1636.091153 1652.552961 1668.394619 1683.645462 1828.787031 1838.269943 2072.129027
650.000000 649.857429 504.244613 36.019862 311.758513 120.676965 93.974519 69.844726 0.030624 0.025688 0.021661 0.018355 0.003332 0.002941 0.000007
0.000000 0.000469 45.436203 104.855115 111.097880 141.162004 142.913731 144.101093 153.513662 153.515172 153.516367 153.517318 153.521042 153.521113 153.521442
0.000000 0.142102 96.004217 131.66940 129.60329 65.012529 50.361562 36.229038 0.003811 0.003240 0.002772 0.002386 0.000549 0.000496 0.000009
0.000000 0.000000 2.157483 38.727808 48.770158 161.574251 181.375094 199.912571 248.225952 248.227950 248.229600 248.230971 248.237539 248.237725 248.239271
0.000000 0.000000 2.157483 38.727808 48.770158 161.574251 181.375094 199.912571 248.225952 248.227950 248.229600 248.230971 248.237539 248.237725 248.239271
Table-8. Optimum Parametric values for different particle radii and geometries at the centre (n1=1; n2=n3=1.5) Optimum Parameters Particle radii (m) Final pyrolysis time (s) Final temperature of furnace (K) Final pyrolysis temperature (K) Final concentration of initial biomass (kg/m3) Final concentration of Char 1 (kg/m3) Final concentration of Volatile 1 (kg/m3) Final concentration of Char 2 (kg/m3) Final concentration of Volatile 2 (kg/m3)
Cylinder 0.00025 0.005 35.0 88.0 1100 1645 1099.99 1387.751 0 0 0.00715 19.3174 366.985 0.41275 141.504 315.135 141.504 315.135
Sphere 0.005 78 1455 1350.09 0 64.3383 0.0299 292.816 292.816
REFERENCES V.K. SRIVASTAVA and R.K. JALAN (1994), “Predictions of Concentration in the Pyrolysis of Biomass Materials-I”, Energy Conversion and Management, Vol. 35, No. 12, PP 1031-1040. C.H.BAMFORD, J. CRANK and D.H. MALAN (1946), “The Combustion of Wood”, Proceedings Cambridge Philosophical Society, Vol. 42, PP 166-182. L.T. FAN, L.S. FAN, K. MIYANAMI, T.Y. CHEN and W.P. WALAWENDER (1977), “A Mathematical Model for Pyrolysis of a Solid Particle-Effects of the Lewis Number”, The Canadian Journal of Chemical Engineering, Vol. 55, PP 47-53. K. MIYANAMI, L.S. FAN, L.T. FAN and W.P. WALAWENDER (1977), “A Mathematical Model for Pyrolysis of a Solid Particle-Effects of the Heat of Reaction”, The Canadian Journal of Chemical Engineering, Vol. 55, PP 317-325. E.R. TINNEY (1965), “The Combustion of Wooden Dowels in Heated Air”, 10th International Symposium on Combustion, PP 925-930, The Combustion Institute, Pittsburgh. A.F. ROBERTS and G. CLOUGH (1963), “Thermal Degradation of Wood in an Inert Atmosphere”, 9th International Symposium on Combustion, PP 158-167, The Combustion Institute, Pittsburgh. W.K. TANG and W.K. NEIL (1964), “Effect of Flame Retardants on Pyrolysis and Combustion of α-cellulose”, Journal of Polymer Science, Part C 6, PP 65-81. F. SHAFIZADEH (1978), “Combustion, Combustibility and Heat Release of Forest Fuels”, AIChE Symposium Series, Vol. 74, PP 76-82. H.C. KUNG (1972), “A Mathematical Model of Wood Pyrolysis”, Combustion and Flame, Vol. 18, PP 185-195. E.J. KANSA, H.E. PERLEE and R.F. CHAIKEN (1977), “Mathematical Model of Wood Pyrolysis Including Internal Forced Convection”, Combustion and Flame, Vol. 29, PP 311-324. V.K. SRIVASTAVA, SUSHIL and R.K. JALAN (1996), “Prediction of Concentration in the Pyrolysis of Biomass Materials-II”, Energy Conversion and Management, Vol. 37, No. 4, PP 473-483. C. DI BLASI (1998), “Physico-Chemical Processes Occurring Inside a Degrading TwoDimensional Anisotropic Porous Medium”, International Journal of Heat and Mass Transfer, Vol. 41, PP 4139-4150. A. DEMIRBAŞ (2002), “Gaseous Products from Biomass by Pyrolysis and Gasification: Effects of Catalyst on Hydrogen Yield”, Energy Conversion and Management, Vol. 43, PP 897-909. O. BOUTIN, M. FERRER and J. LÉDÉ (2002), “Flash Pyrolysis of Cellulose Pellets Submitted to a Concentrated Radiation: Experiments and Modelling”, Chemical Engineering Science, Vol. 57, PP 15-25. F.J. MASTRAL, E. ESPERANZA, P. GARCIA and M. JUSTE (2002), “Pyrolysis of High Density Polythene in a Fluidized Bed Reactor. Influence of the temperature and Residence Time”, Journal of Analytical and Applied Pyrolysis, Vol. 63, PP 1-15. K.M. BRYDEN, K.W. RAGLAND and C.J. RUTLAND (2002), “Modeling Thermally Thick Pyrolysis of Wood”, Biomass and Bioenergy, Vol. 22, PP 41-53. B.V. BABU and A.S. CHAURASIA (2002a), “Modeling, Simulation, and Estimation of Optimum Parameters in Pyrolysis of Biomass”, Communicated to Energy Conversion and Management.
B.V. BABU and A.S. CHAURASIA (2002b), “Modeling for Pyrolysis of Solid Particle: Kinetics and Heat Transfer Effects”, Communicated to Energy Conversion and Management. D.L. PYLE and C.A. ZAROR (1984), “Heat Transfer and Kinetics in the Low Temperature Pyrolysis of Solids”, Chemical Engineering Science, Vol. 39, PP 147-158. C.A. KOUFOPANOS, N. PAPAYANNAKOS, G. MASCHIO and A. LUCCHESI (1991), “Modelling of the Pyrolysis of Biomass Particles. Studies on Kinetics, Thermal and Heat Transfer Effects”, The Canadian Journal of Chemical Engineering, Vol. 69, PP 907-915. R.K. JALAN and V.K. SRIVASTAVA (1999), “Studies on Pyrolysis of a Single Biomass Cylindrical Pellet- Kinetic and Heat Transfer Effects”, Energy Conversion and Management, Vol. 40, PP 467-494.