Journal of Food Research; Vol. 2, No. 2; 2013 ISSN 1927-0887 E-ISSN 1927-0895 Published by Canadian Center of Science and Education
Modeling Single-Screw Extrusion Processing Parameters and Resulting Extrudate Properties of DDGS-Based Nile Tilapia (Oreochromis niloticus) Feeds Ferouz Y. Ayadi1, Parisa Fallahi1, Kurt A. Rosentrater2 & Kasiviswanathan Muthukumarappan1 1
Department of Agricultural and Biosystems Engineering, South Dakota State University, USA
2
Department of Agricultural and Biosystems Engineering, Iowa State University, Ames, IA, USA
Correspondence: Kurt A. Rosentrater, Department of Agricultural and Biosystems Engineering, Iowa State University, Ames, IA 50011, USA. Tel: 1-515-294-4019. E-mail:
[email protected] Received: November 22, 2012 doi:10.5539/jfr.v2n2p11
Accepted: January 19, 2013
Online Published: February 27, 2013
URL: http://dx.doi.org/10.5539/jfr.v2n2p11
Abstract A single-screw laboratory extruder was used to conduct an L18 (22 36) Taguchi fractional factorial study of aquafeed processing. The ingredients were based on a formulation for nutritionally-balanced Nile tilapia diets containing distillers dried grains with solubles (DDGS) and soybean meal as the main protein sources, in addition to constant amounts of corn flour, whey, and fishmeal. The effects of three levels of DDGS (20, 30 and 40%), soybean meal (30, 40 and 50%), ingredient moisture content (20, 30 and 40% db), screw speed (100, 150 and 200 rpm), die dimension (L/D ratios of 5, 9 and 13), barrel temperature (80-100-100°C, 80-120-120°C and 80-140-140°C) and two levels of screw configuration (compression ratios of 2:1 and 3:1) on extrudate physical properties (moisture content, water activity, bulk density, unit density, expansion ratio, pellet durability index, water absorption and solubility indices, water stability, color) and extruder processing parameters (resulting temperatures, die pressure, extruder torque, mass flow rate, apparent viscosity, and specific mechanical energy) were determined. Data from raw materials, processing conditions, and extrudate properties were used to develop surface response curves and equations. However, predominantly low R2 values (< 0.5) only permitted linear relationships between some independent parameters and response variables. Regarding main effects, die pressure significantly decreased with higher DDGS levels, moisture content, temperature, lower die L/D, and higher screw compression. Expansion ratio decreased significantly with higher moisture content and lower die L/D. Significant differences in color were caused by changes in DDGS levels and moisture content. In summary, DDGS, moisture content, die dimension, and extrusion conditions had the biggest impact on most of the extrudate physical properties and processing conditions. Different combinations of these independent factors can be used to achieve desired extrudate physical properties and processing conditions. Keywords: alternative protein, aquaculture, extrusion, modeling, physical properties Abbreviations: DDGS: Distillers dried grains with solubles 1. Introduction Depletion of wild fisheries, combined with rising demands for seafood products for human foods, has led to increased aquaculture production during the last several decades. Depending upon the species and maturity, fish have high dietary protein demands of up to 55% (NRC, 1993). Fish meal is one of the main protein sources used in aquatic feeds; because of good amino acid balance, high palatability, and growth performance, continually increasing demand for the limited supply of wild fish has steadily increased fish meal prices. For example prices for fish meal for July 2010 were above $1370 per ton, compared to $600 per ton for July 2005 (USDA, 2010). For certain fish species, feed costs alone can represent up to 70% of the total production cost for an aquaculture operation (Webster & Lim, 2002; Metts et al., 2007). Protein accounts for the major feed cost. Studies have shown that less expensive alternative protein sources can, at least partially, replace fish meal, satisfy protein demands, and result in good growth performance. These alternatives include various animal and plant sources. Ayadi et al. (2010) provided a comprehensive review of many of these feed ingredients. For instance, meat and bone meal has been used in salmonids feeds (Bureau et al., 2000). Poultry by-product meal has been used in commercial diets for sunshine bass and hybrid striped bass (Rawles et al., 2009; Rawles et al., 2010). Soybean 11
www.ccsenet.org/jfr
Journal of Food Research
Vol. 2, No. 2; 2013
meal (SBM) is one of the most studied and widely used plant protein sources in commercial aquatic feeds for many species, such as tilapia, hybrid striped bass, rainbow trout, Atlantic salmon (Salmo salar) and sunshine bass (Morone chrysops × M. saxatilis) (Steffens, 1994; Thompson et al., 2008; Furuya et al., 2004; Rawles et al., 2009). Distillers dried grains with solubles (DDGS) is another ingredient. It is the major nonfermentable coproduct of fuel ethanol production, and is mostly made from corn grain. Compared to other protein sources, such as SBM, DDGS is very competitive on a cost per unit protein basis, highly palatable to fish (Lim et al., 2009), and does not contain anti-nutritional factors that are present in most pulses. In numerous studies, DDGS has been examined as a potential protein ingredient in fish feed for species such as Nile tilapia, channel catfish, and rainbow trout (Webster et al., 1993; Wu et al., 1996; Cheng & Hardy, 2004; Lim et al., 2007). Nile tilapia (Oreochromis niloticus) originated in Africa, and is one of the most important cultured fish species worldwide. Global tilapia production has increased exponentially within the last 30 years. For example, in 1998, 0.7 million metric tonnes (t) of Nile tilapia were produced, compared to 2.3 million t in 2008, of which Asia has become the major producer (FAO, 2010). For the US market, tilapia production increased from 15,521 t in 1998 to 81,130 t in 2008 (FAO, 2010). It is the fifth most popular seafood consumed in the US (ATA, 2010). Tilapia has relatively fast growth, undemanding feed conditions, and physical hardiness (Fitzsimmons, 2006). Even though Nile tilapia has been classified as herbivorous, it has been reported that Nile Tilapia can also feed on insects, algae, and potentially other fish (Njiru et al., 2004). Protein requirements depend on maturity; they can be up to 45% for Nile tilapia fry (El-Sayed & Teshima, 1992; Hafedh, 1999), whereas bigger fish can require down to 30% protein or less (Hafedh, 1999; Bahnasawy, 2009). Dietary components are only one aspect of fish feeding, however. The other is feed production. High quality aquatic feeds are commonly produced by extrusion processing, which can produce floating or sinking feeds and improve nutrient digestibility (Pezzato, 1999). Extrusion processing has become very popular in the feed and food industries due to high versatility, productivity, and product quality. Previous research by our group has focused on several processing aspects of DDGS-based feeds. Single-screw and twin-screw extrusion have been used to produce feeds for tilapia, channel catfish, yellow perch, and rainbow trout. The effects of various levels of DDGS inclusion, ingredient moisture content, protein content screw speed, barrel temperature, and die dimension, on resulting extruder processing conditions and extrudate properties have been examined (Chevanan et al., 2007a, 2007b, 2007c, 2008, 2009, 2010; Kannadhason et al., 2009a, 2009b, 2010; Rosentrater et al., 2009a, 2009b; Ayadi et al., 2011a, 2011b, 2011c). Additionally, we have used these extruded feeds in feeding trials to test their efficacy (Schaeffer et al., 2009, 2010). Most of these studies, however, were empirical and deterministic in nature. Follow-up modeling studies on extrusion can help to predict output parameters (e.g. extrudate properties) based on extruder processing settings and/or formulations of the raw blends. Extrusion cooking involves many complex processes that can be difficult to control due to interactions between mass, energy, and momentum transfer phenomena. Physicochemical changes impact extrudate properties, and can be difficult to predict (Wang et al., 2001). Some research has been conducted on modeling of extrusion processes and resulting product quality. For example, Meng et al. (2010) used second-order polynomial regression to model twin-screw extruder system parameters (feed moisture content, screw speed, and barrel temperature) and physical properties of chickpea flour-based snacks. A similar modeling study was accomplished by Ding et al. (2005) for rice-based expanded snacks. Chevanan et al. (2007c) developed neural network and regression models of single-screw extrusion of aquaculture feeds containing DDGS; data collected from different trials were combined to predict extrudate properties and extrusion processing parameters based on die dimensions, ingredient moisture content, barrel temperature, and screw speed. Wang et al. (2001) modeled twin-screw extrusion to control extrudate quality attributes. Multiple regression models were developed by Ganjal et al. (2004) to relate the radial expansion of extrudates to die nozzle dimensions and back pressure at the die for acetylated starch in a twin-screw extruder. Ali et al. (1996) developed a regression model to study the effects of temperature and screw speed on the radial, axial, and overall expansion, as well as bulk density of extruded corn grits in a single-screw extruder. In this study, the goal was to model the effects of various levels of DDGS, soybean meal, ingredient moisture content, screw speed, screw compression ratio, die dimension, and barrel temperature on resulting extrudate physical properties (e.g., moisture content, water activity, bulk density, unit density, expansion ratio, pellet durability index, water absorption and water solubility indices, water stability, and color) and on resulting extruder processing conditions (barrel temperature, die pressure, extruder torque, mass flow rate, apparent viscosity, and specific mechanical energy).
12
www.ccsenet.org/jfr
Journal of Food Research
Vol. 2, No. 2; 2013
2. Materials and Methods 2.1 Feed Blend Preparation DDGS was provided by Dakota Ethanol, LLC (Wentworth, SD) and soybean meal was obtained from Dakotaland Feeds, LLC (Huron, SD). Low temperature menhaden fish meal was purchased from Consumers Supply Distributing Co. (Huron, SD); corn flour was from Cargill Dry Corn Ingredients, Inc. (Paris, IL); dried whey was from Midor Ltd. (Elroy, WI). Six ingredient blends (Table 1) were adjusted to a target protein content of ~ 30% db, a target fat content of ~ 17% db, and three different moisture contents of 20, 30, and 40% db. With increasing DDGS levels (20, 30, 40% db), and thus decreasing soybean meal levels (50, 40, 30%), but constant levels of fish meal (approximately), corn flour, and whey, these ingredients were used to prepare nutritionally-balanced diets for Nile tilapia (Schaeffer et al., 2010; Chevanan et al., 2007b). DDGS and soybean meal were ground with a laboratory mill (Model 4, Thomas Scientific, Swedesboro, NJ) to a flour with an average particle size of approximately 500 micrometer (μm). The whey was sieved in manually (Sieve No. 14, ASTM E-11, Daigger, Vernon Hills, IL) to prevent coagulation within the blends. The components were then blended in a rotary mixer for 10 min (Kushlan Products, Inc., Goldendale, WA). After all ingredients were thoroughly combined, each blend was adjusted to the desired moisture content of 20, 30, and 40%, respectively, by adding adequate amounts of water, and then thoroughly mixed using a laboratory-scale mixer (Professional 6, KitchenAid, St. Joseph, MI). Table 1. Ingredient components (for each diet) used in the study Dry weight of ingredients (g/kg) Diet1
Diet2
Diet3
DDGS
20
30
40
Soybean meal
50
40
30
Corn flour
15
15
15
Whey
5
5
5
Fishmeal
10
10
10
TOTAL
100
100
100
2.2 Experimental Design and Extrusion Processing A L18 (22 36) Taguchi fractional factorial design (Table 2) was used for the study. The treatment combinations consisted of 18 uniquetrials, which consisted of different combinations of 2 levels of screw compression ratio (2:1, 3:1), 2 levels of fishmeal (9.99% and 9.98%), 3 levels of DDGS (20, 30 and 40%), 3 levels of soybean meal (30, 40 and 50%), 3 levels of raw blend moisture content (20, 30 and 40% db), 3 levels of screw speed (100, 150 and 200 rpm), 3 levels of die dimension (L/D ratios of 5, 9 and 13), and 3 levels of barrel temperature profile (80-100-100, 80-120-120 and 80-140-140°C). A single-screw extruder (Model PL 2000, Brabender Plasti-Corder, South Hackensack, NJ), with a barrel length of 317.5 mm, was used to extrude each blend. Three different dies were used, with length to diameter (L/D) ratios of 5, 9 and 13. The center of the die assembly was conical, and tapered from an initial diameter of 6.0 mm to an exit diameter of 2.0, 3.2 or 6.0 mm, respectively, at the discharge opening. A 7.5 HP (5.5 kW) motor was connected to the extruder drive shaft. During extrusion, the screw speed was adjusted to 100, 150 and 200 rpm, respectively. For all runs, the temperature of the feed zone was controlled and maintained at 80ºC, that of the transition zone at 100, 120, or 140ºC, respectively, and that of the die zone at 100, 120, or 140ºC, respectively. The raw blends were manually funneled into the extruder in constant quantities to avoid jamming at the opening of the barrel and to provide a continuous feed. All processing data were collected every 60 s, and the average of eight (n = 8) recordings were used for statistical analyses, except for mass flow rate where three samples (n = 3) were used. 2.3 Raw Ingredient Properties Each raw blend was analyzed for moisture content, water activity, and color (Hunter L, a, b values). Methods used will be discussed subsequently. 13
www.ccsenet.org/jfr
Journal of Food Research
Vol. 2, No. 2; 2013
Table 2. Experimental design used in the study Ingredient Properties
Extruder Properties
Treatment Fishmeal DDGS SBM MCraw Screw Speed Screw compression ratio Die L/D Temperature profile (g/kg)
(g/kg) (g/kg) (g/kg) (rpm)
(°C)
1
9.98
20
30
20
100
2:1
5
80-100-100
2
9.98
40
40
30
150
2:1
9
80-120-120
3
9.98
30
50
40
200
2:1
13
80-140-140
4
9.98
30
40
20
200
3:1
9
80-100-100
5
9.98
20
50
30
100
3:1
13
80-120-120
6
9.98
40
30
40
150
3:1
5
80-140-140
7
9.99
20
40
40
150
2:1
13
80-100-100
8
9.99
40
50
40
100
2:1
9
80-100-100
9
9.99
30
30
20
150
2:1
13
80-120-120
10
9.99
40
50
20
200
2:1
5
80-120-120
11
9.99
30
30
30
100
2:1
9
80-140-140
12
9.99
20
40
30
200
2:1
5
80-140-140
13
9.99
30
50
30
150
3:1
5
80-100-100
14
9.99
40
30
30
200
3:1
13
80-100-100
15
9.99
30
40
40
100
3:1
5
80-120-120
16
9.99
20
30
40
200
3:1
9
80-120-120
17
9.99
40
40
20
100
3:1
13
80-140-140
18
9.99
20
50
20
150
3:1
9
80-140-140
* The experimental design consisted of an L18 Taguchi fractional factorial design with 18 total treatment combinations. MCraw is raw blend moisture content, die L/D is length to diameter ratio of the die, SBM is soybean meal 2.4 Extrusion Processing Parameters 2.4.1 Temperature Profile, Die Pressure and Torque The absolute pressure at the die zone and the actual temperature profile at the feed, metering, and die zones were simultaneously monitored every minute for eight (n=8) recordings using a combined thermocouple/pressure transducer (GP50, New York Ltd., Grand Island, NY). Likewise, the net torque exerted on the screw drive shaft was recorded with a torque transducer (Measurement Specialists, Huntsville, AL) at a sensing range of 0-390 N.m every minute for eight (n=8) recordings. 2.4.2 Mass Flow Rate (MFR) Extrudate samples exiting the die were collected at 30 s intervals, dried, and weighed using an electronic balance (PB 5001, Mettler Toledo, Switzerland) to quantify the mass flow rate. 2.4.3 Apparent Viscosity (ηapp) The extruder was approximated as a coaxial cylinder-shaped viscometer, where the screw and barrel were considered as an inner and an outer cylinder, respectively (Rogers, 1970; Lu et al., 1992; Rosentrater et al., 2005; Chevanan et al., 2007a). The apparent viscosity of the dough was calculated using: Css Csr
app
(1)
where ηapp is the apparent viscosity of the dough (Pa•s), τ is the net torque exerted on the screw shaft (N•m), ω is the screw speed (rpm), Css is an empirical correction factor for the shear rate which relates to the screw configuration, and Csr is an empirical correction factor for the shear rate which relates to the barrel size, where: 14
www.ccsenet.org/jfr
Journal of Food Research
Css
1 2 Ls rcorr 2
Csr
rCorr
r
2 eff1
Vol. 2, No. 2; 2013
(2) (3)
2r b2 2 r b2 r corr
reff1 reff 2 reff2 2 / 3
(4)
where rcorr is the radius correction factor due to the frustum geometry of the screw (m), rb is the barrel radius (m), LS is the screw length in the axial direction (m), and reff is the effective radius of the screw obtained from the sum of the screw root and half of the flight height (m). Specific values for these parameters have been discussed elsewhere (Rosentrater et al., 2005). 2.4.4 Specific Mechanical Energy (SME) Specific mechanical energy (J/g) was calculated using equation (5), following Harper (1981): SME
60
(5)
m feed
where τ is the net torque exerted on the screw shaft (N.m), ω is the screw speed (rpm), and mfeed is the mass flow rate of the input dry feed (g/min), calculated using the following equation: 1 MC f m feed MFR 1 MC e
(6)
where MCf is the moisture content of the raw feed blend (% wb) and MCe is the moisture content of the extrudate at the die (% wb). 2.4.5 Extrudate Physical Properties After the prepared blends were cooked in the extruder and dried for 72 h at room temperature (25±1ºC), they were then analyzed for moisture content (% db), water activity, bulk density (kg/m3), unit density (kg/m3), expansion ratio, pellet durability index (%), water absorption and water solubility indices (%), water stability (min), and color. For all treatment runs, three samples (n=3) were used to determine the physical properties. 2.4.6 Moisture Content (MC) According to AACC method 44-19 (2000), the moisture content of the raw material and extrudate samples for each blend were determined using a laboratory oven (Thelco Precision, Jovan, Wincester, VA) at 135ºC for 2 h. 2.4.7 Water Activity (aw) Water activity was measured for the raw material and extrudate samples from each treatment with a water activity meter (aw Sprint TH-500, Novasina, Pfäffikon, Switzerland). The sample bowl was filled with each sample and then placed into the measuring chamber of the pre-calibrated instrument. 2.4.8 Bulk Density (BD) Bulk density (BD) was determined as the ratio of the mass of extrudates in a given bulk volume. A standard bushel tester (Seedburo Equipment Company, Chicago, IL) was used following the method described by USDA (1999). 2.4.9 Unit Density (UD) The extrudates were cut to a length of 25.4 mm, weighed on an analytical balance (Adventurer™, Item No. AR 1140, Ohaus Corp. Pine Brook, NJ), and then measured with a digital caliper (Model No. CD-6’’C, Mitutoyo Corp., Tokyo, Japan) to determine their diameter. According to Rosentrater et al. (2005) the unit density (UD, kg/m3) was calculated as the ratio of the mass m (kg) to the volume V (m3) of each measured and weighed extrudate sample, assuming a cylindrical shape for each extrudate: UD = m / V
(7)
2.4.10 Expansion Ratio (ER) The diameter of the extrudates was measured with a digital caliper (Digimatic caliper, Model No: CD-6’’C, Mitutoyo Corp., Tokyo, Japan), and then the ratio at that diameter to the diameter of the die nozzle (2.0, 3.2, or 6.0 mm) was used to quantify the radial expansion ratio. 15
www.ccsenet.org/jfr
Journal of Food Research
Vol. 2, No. 2; 2013
2.4.11 Pellet Durability Index (PDI) Pellet durability index was determined following Method S269.4 (ASAE, 2004). Approximately 100 g of extrudates from each blend were manually sieved (ASTM E-11, Daigger, Vernon Hills, IL) for about 10 s to remove initial fines, and then tumbled in a pellet durability tester (Model PDT-110, Seedburo Equipment Company, Chicago, IL) for 10 min. Afterwards, the samples were again hand sieved for about 10 s, and then weighed on an electronic balance (Explorer Pro, Model. EP4102, Ohaus, Pine Brook, NJ). PDI was calculated as: PDI (%) = Ma / Mb 100
(8)
where Ma is the mass (g) after tumbling and Mb is the sample mass (g) before tumbling. 2.4.12 Water Absorption and Water Solubility Index Water absorption index (WAI) and water solubility index (WSI) were measured according to the method of Anderson et al. (1969) and Jones et al. (2000). Extrudate sample of each treatment combination were ground with a cyclone mill (Cyclone Sample Mill, Model 3010-830, UDY Corporation, Fort Collins, CO) to an average particle size of about 500 μm. Approximately 2.5 g of the extrudate powder was suspended in 30 mL of water in a tarred 50 mL centrifuge tube. The tube was placed in a laboratory oven (Thelco Precision, Jovan, Wincester, VA) at 30°C and stirred periodically every 10 min for 30 min. Afterwards, the water-extrudate suspension was centrifuged for 15 min at 3000 rpm in a laboratory-scale centrifuge (Durafuge 100, Precision, Winchester, VA). The supernatant was decanted into tarred aluminum dishes and dried for 2 h at 135°C in the laboratory oven. The ratio of the remaining gel mass in the centrifuge tube to the original sample mass (approximately 2.5 g) was used to determine the water absorption index: WAI = Wg / Ws
(9)
where Wg is gel weight (g) and Ws is the original sample weight (g). WSI was calculated as the ratio of the dry solids (remaining from evaporation of the supernatant from the WAI test) to the original sample mass, following AACC Method 44-19 (2000). WSI (%) = (Wds / Ws ) 100 where Wds is the dry weight of the supernatant (g) and Ws is original weight of the sample (g).
(10)
2.4.13 Water Stability Water stability is defined as the amount of time that it takes for an extrudate to begin to break apart after it has been placed in water. For extrudates of each blend, a 1-g sample was placed in 200 mL of distilled water and gently stirred using a magnet stirrer (PMC No. 524C, Barnstead International, Dubuque, IA) until the extrudates began to visibly dissolve, and the time was then recorded. 2.4.14 Color A spectrophotometer (LabScan XE, HunterLab, Reston, VA) was used to determine color, where L quantified brightness/darkness, a redness/greenness, and b yellowness/blueness of the samples. 2.5 Statistical Analysis Each blend was extruded once. For each treatment combination, three replicates (n=3) were determined for all physical properties. All collected data were analyzed with Microsoft Excel v.2007 and SAS v.9 (SAS Institute, Cary, NC). The Proc GLM (general linear models) procedure was used to identify the main effects (i.e., individual effects due to each independent variable) and the treatment (simultaneous) combination effects using a Type I error rate (α) of 0.05. Then, post-hoc LSD tests were used to determine where the specific differences occurred. TableCurve 3D v.4.0.01 (SYSTAT Software, Inc., San Joes, CA) was also used for response surface modeling. 3. Results
3.1 Extrusion Processing Parameters 3.1.1 Die Pressure The barrel of the extruder essentially acts as a pressure cooker, where steam and pressure are released at the die opening (Harper, 1981). The design of the die can impact pressure release as well as result in additional pressure. Die pressure and temperature highly affect expansion and mass flow of extrudate. At lower temperatures and lower pressures, less water evaporates which results in less expansion. Hence, moisture content and screw speed are important factors that affect die pressure and extrudate expansion as well.
16
www.ccsenet.org/jfr
Journal of Food Research
Vol. 2, No. 2; 2013
With changes in screw speed, no significant differences were detected for the die pressure for the main effects (Table 4). This may be related to the high standard deviations. Generally, all standard deviations for the recorded parameters for processing conditions (SME, torque, viscosity) were relatively high. The highest value for die pressure was recorded at 1603.00 MPa (Run 4), while the lowest value was at 42.50 MPa (Run 15) (Table 5). As expected, the die pressure decreased with higher moisture content. This is in agreement with other extrusion studies (Lin et al., 2002; Meng et al., 2010; Singh et al., 2007). At high moisture water can act as a lubricant, and will reduce friction of the extruded dough, which in turn decreases die pressure (Lin et al., 2002). This is reflected in the values for the aw, which increased with higher blend moisture content. The data for raw blend awvaried between 0.62-0.66, 0.74-0.77, and 0.78-0.80 for 20, 30, and 40% moisture content, respectively (Table 3). Raising the processing temperature from 100 to 140°C resulted in a significant decrease in die pressure of 43.2% (Table 4). Similar results were reported by other investigators (Fletcher et al., 1985; Kirby et al., 1988; Singh et al., 2007). Furthermore, the die pressure showed a significant decrease with a larger die diameter. The die pressure dropped by 46.0% by decreasing the die L/D from 13 to 5 (Table 4). This is in agreement with other observations (Sokhey et al., 1997), and was expected due to an increasing die area, and thus less resistance to flow. Increasing the DDGS level from 20 to 40% yielded a drop in pressure by 31.4%. Likewise, a similar trend was observed by Chevanan et al. (2010). Changes due to increasing DDGS, MC, temperature, and die diameter resulted in significantly lower die pressure values. Examining the treatment combination effects (Table 5) reveals that many treatments were significantly different from each other, which resulted from simultaneous changes of the combined independent variables. Table 3. Physical properties of the raw feed blends* Property aw (-) L (-) a (-) b (-)
1
2
3
4
5
0.64g 0.74e 0.80a 0.66f 0.77d (0.00) (0.00) (0.00) (0.00) (0.00) 62.43a 55.05de 54.04ef 56.76cd 51.57g (0.82) (1.37) (1.33) (0.93) (1.11) 3.63g 5.63b 5.57b 4.54ef 5.38bc (0.18) (0.10) (0.35) (0.31) (0.33) 18.59g 20.71abc 20.49bcd 19.15efg 18.82fg (0.47) (0.45) (0.72) (0.91) (0.97)
6
7
8
9
Treatment 10
11
12
13
14
15
16
17
18
0.78c 0.80ab 0.80ab 0.62h 0.62h 0.74e 0.74e 0.74e 0.74e 0.79b 0.80ab 0.62h 0.62h (0.00) (0.00) (0.00) (0.00) (0.00) (0.00) (0.01) (0.00) (0.00) (0.00) (0.00) (0.00) (0.02) 53.18fg 53.99ef 52.94fg 59.16b 58.23bc 57.30c 59.11b 57.30c 55.05de 54.04ef 53.99ef 58.23bc 62.43a (0.84) (0.61) (0.46) (2.08) (1.19) (0.55) (0.92) (0.55) (1.37) (1.33) (0.61) (1.19) (0.82) 6.24a 4.98d 6.45a 4.34f 5.13cd 4.86de 4.38f 4.86de 5.63b 5.57b 4.98d 5.13cd 3.63g (0.18) (0.21) (0.19) (0.16) (0.07) (0.13) (0.07) (0.13) (0.10) (0.35) (0.21) (0.07) (0.18) 21.28ab 19.74de 21.43a 19.24efg 20.01cde 19.91cde 19.63def 19.91cde 20.71abc 20.49bcd 19.74de 20.01cde 18.59g (0.42) (0.33) (0.32) (0.59) (0.36) (0.32) (0.22) (0.32) (0.45) (0.72) (0.33) (0.36) (0.47)
* Means followed by similar letters for a given dependent variable are not significantly different among treatments at P < 0.05, LSD. Values in parentheses are standard deviation. aw is water activity, L is brightness, a is redness/greenness, b is yellowness/blueness. 3.1.2 Torque Torque quantifies the force that is required to rotate the extruder screw. Thus, it is affected by the viscosity of the dough, moisture content, temperature, and screw speed (Akdogan, 1996). High torque requires more energy and can lead to wear of the extruder. Optimal torque values can save energy and reduce stress on the equipment. Regarding the main treatment effects (Table 4), no clear pattern of changes in torque could be observed for several independent variables, which again might be related to the high standard deviations. The highest torque value was recorded for run 13 at 51.73 N.m, whereas the lowest was recorded for run 8 at 8.26 N.m (Table 5). Some significant differences in torque were detected with interactive changes across the treatment combinations (Table 5). The torque decreased with higher levels of DDGS, and with higher moisture content. Conversely, torque increased with higher levels of SBM. Changes in screw speed yielded no significant differences in torque for the main effects, which was related to the high standard deviations. But the dough did exhibit shear thinning behavior: the apparent viscosity decreased significantly by 42.2% when increasing the screw speed from 100 to 200 rpm (Table 4). The different screw configurations also had a significant effect on torque. This was as expected, due to the changes in flight height of the screw which increased compression and thus torque for the 2:1 compression ratio screw versus the 3:1 compression ratio. And, as die L/D increased, the torque increased due to greater resistance to flow, which resulted in a higher pressure. 3.1.3 Mass Flow Rate A common way to examine the productivity of an extruder is to measure its output. Previous studies have shown that the amount of extrudate produced per unit time is impacted by screw speed, die geometry, shear rate, diet formulation (such as DDGS level), moisture content, and the viscosity of the dough melt (Chevanan et al., 2008; Kannadhason et al., 2010). In this study, except for screw speed, none of the independent variables had significant effects on MFR for the main effects, which again was related to the high standard deviations observed in the data. 17
www.ccsenet.org/jfr
Journal of Food Research
Vol. 2, No. 2; 2013
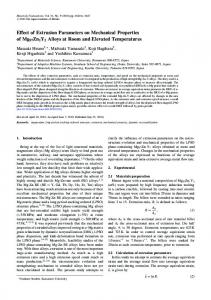
For the main effects, with increasing screw speed from 100 to 150 rpm, MFR increased significantly by 109.8% (Table 4). The highest MFR was detected for run 3 at 225.60 g/min, while the lowest was for run 8 at 67.13 g/min (Table 5). Treatment combination effects were also studied and response surface generated for MFR, SS, and DDGS level (Figure 1). As shown in Figure 1, the higher screw speed and lower levels of DDGS substitution resulted in decreased flow rate. Overall, changing in DDGS levels in diet did not have considerable impact on extrudate output. Table 4. Main effects of DDGS, SBM, moisture content of raw material, screw speed, screw compression ratio, die L/D, and extruder temperature profile on raw blends, measured processing properties, and extrudate physical properties* Raw Materials Processing conditions LRaw aRaw bRaw awRaw P at Die Torque MFR SME ηapp Variable DDGS (% db) 20
(Mpa)
(N m)
(g/min)
(Pa s)
(J/g)
0.73a (0.07) 0.73a (0.07) 0.72a (0.08)
57.25a (4.48) 56.43a (2.17) 55.45a (2.38)
4.50c (0.72) 4.96b (0.53) 5.70c (0.53)
19.19c (0.70) 19.86b (0.76) 20.69a (0.65)
932.04a (484.21) 790.56ab (580.72) 639.02b (302.58)
29.14a 115.32a 1880.83a 860.90a (11.98) (31.43) (1094.42) (367.52) 30.41a 129.67a 1637.52a 716.52ab (17.13) (56.00) (783.61) (423.89) 18.43b 111.58a 1067.25b 513.44b (11.10) (51.14) (648.75) (210.87)
0.72a (0.07) 0.73a (0.07) 0.72a (0.08)
56.85a (3.44) 56.20a (2.24) 56.09a (3.86)
4.95a (0.88) 5.04a (0.52) 5.17a (0.89)
19.91a (0.98) 19.96a (0.71) 19.88a (1.10)
713.02a (523.26) 787.58a (576.56) 861.02a (299.51)
22.08b 102.92a 1405.04b (10.16) (34.69) (898.54) 24.54b 132.61a 1365.37b (13.36) (49.13) (624.69) 31.36a 121.04a 1815.18a (17.89) (53.30) (1124.53)
606.10a (220.73) 673.92a (360.37) 810.84a (471.29)
0.63c (0.02) 0.75b (0.01) 0.79a (0.01)
59.54a (2.46) 55.90b (2.61) 53.70c (0.91)
4.40c (0.65) 5.12b (0.49) 5.63a (0.62)
19.27c (0.76) 19.95b (0.80) 20.53a (0.80)
1220.75a (346.90) 602.00b (312.52) 538.88b (446.25)
28.17a 106.14a 1686.17a (10.49) (35.13) (721.03) 32.29a 133.67a 1948.87a (16.94) (44.99) (1125.72) 17.52b 116.76a 950.55b (11.55) (57.15) (504.72)
624.98b (186.87) 929.56a (505.40) 536.33b (208.11)
SS (rpm) 100
-
-
-
-
150
-
-
-
-
200
-
-
-
-
718.88a (474.17) 884.60a (481.08) 758.15a (485.30)
23.18a 76.31c 1922.54a (14.08) (7.68) (1129.17) 27.97a 120.18b 1551.38b (15.72) (41.49) (812.55) 26.83a 160.08a 1111.67c (13.81) (37.87) (563.07)
612.02a (344.64) 710.81a (397.06) 768.04a (366.22)
-
-
-
-
-
-
-
-
950.83a (521.87) 705.40b (441.37)
32.05a 135.01a 1964.79a 769.13a (14.26) (66.32) (1085.34) (269.57) 22.97b 110.78a 1310.41b 660.87a (13.88) (32.09) (744.16) (408.05)
-
-
-
-
13
-
-
-
-
544.81c (508.60) 807.42b (466.37) 1009.40a (346.56)
22.06b (17.97) 25.43ab (13.41) 30.50a (10.44)
1345.70b (1115.82) 1397.26b (654.04) 1842.63a (873.81)
729.19a (531.36) 601.21a (223.36) 760.47a (276.47)
T (oC) 100
-
-
-
-
120
-
-
-
-
140
-
-
-
-
1002.50a (463.65) 789.63b (486.22) 569.50c (399.99)
31.77a 121.83a 1774.88a (15.90) (40.82) (860.92) 22.90b 111.63a 1431.02ab (13.93) (44.18) (1105.86) 23.31b 123.10a 1379.70b (12.28) (56.84) (728.32)
796.78a (399.40) 627.75a (326.42) 666.34a (375.58)
30 40 SBM (% db) 30 40 50 MCRaw (% db) 20 30 40
Screw comp. 2:1 3:1 Die L/D 5 9
18
103.08a (34.12) 127.83a (47.60) 125.66a (55.72)
www.ccsenet.org/jfr
Journal of Food Research
Vol. 2, No. 2; 2013
Extrudate Properties
MCExt
Variable DDGS (% db) 20 30 40 SBM (% db) 30 40 50 MCRaw (% db) 20 30 40 SS (rpm) 100 150 200 Screw comp. 2:1 3:1 Die L/D 5 9 13 T (oC) 100 120 140
awExt
BD
UD 3
(% db)
(kg/m )
ER
PDI
3
(kg/m )
WAI
WSI
(%)
WS
LExt
aExt
bExt
(min)
9.74a (1.82) 8.88b (0.85) 9.00ab (0.83)
0.41a (0.04) 0.41a (0.04) 0.39a (0.04)
217.52a 9.74a (27.80) (1.82) 218.29a 8.88b (29.38) (0.85) 221.61a 9.00ab (18.46) (0.83)
0.90a (0.08) 0.8a (0.18) 0.89a (0.16)
94.00a (4.04) 94.94a (4.71) 94.85a (4.36)
3.37a (0.26) 3.24ab (0.35) 3.05b (0.31)
19.20a (0.96) 19.61a (1.60) 18.20b (0.79)
9.31a (1.57) 9.22a (1.44) 9.10a (0.78)
0.41a (0.04) 0.40a (0.04) 0.40a (0.04)
214.33a (16.14) 228.11a (31.62) 214.97a (24.46)
9.31a (1.57) 9.22a (1.44) 9.10a (0.78)
0.86b (0.16) 0.86b (0.17) 0.95a (0.07)
94.53a (4.73) 95.20a (3.07) 94.07a (5.06)
3.28a (0.39) 3.35a (0.25) 3.02b (0.26)
19.50a 21.22ab (1.77) (9.94) 18.55b 17.34b (0.92) (6.74) 18.95ab 24.78a (0.88) (5.71)
42.22a 4.68ab 13.93a (3.65) (1.01) (2.52) 42.33a 4.94a 14.32a (3.90) (1.06) (2.24) 43.71a 4.26b 13.50a (5.48) (0.49) (1.64)
8.79b (1.23) 8.89b (0.99) 9.93a (1.36)
0.41a (0.05) 0.40a (0.04) 0.40a (0.03)
231.54a (26.40) 228.40a (16.86) 197.47b (15.96)
8.79b (1.23) 8.89b (0.99) 9.93a (1.36)
0.99a (0.06) 0.92b (0.09) 0.77c (0.17)
91.96b (5.00) 94.34b (3.66) 97.49a (1.84)
3.17a (0.27) 3.31a (0.38) 3.18a (0.34)
18.85ab 17.44b (0.97) (6.67) 19.51a 18.42b (1.73) (7.91) 18.65b 27.47a (0.93) (5.87)
45.39a 5.06a 15.54a (3.25) (1.09) (1.16) 44.62a 4.61ab 14.47b (3.53) (0.70) (1.42) 38.27b 4.22b 11.73c (2.17) (0.76) (1.70)
8.36b (0.81) 9.50a (1.09) 9.76a (1.47)
0.41a 221.90ab 8.36b (0.04) (11.70) (0.81) 0.40a 206.41b 9.5a (0.04) (19.77) (1.09) 0.40a 229.10a 9.76a (0.05) (34.27) (1.47)
0.84b (0.16) 0.89b (0.16) 0.95a (0.10)
94.78a (3.98) 94.16a (4.47) 94.85a (4.68)
3.37a (0.39) 3.09b 0.29 3.19ab (0.27)
19.29a (1.84) 19.17a (0.83) 18.55a (0.91)
22.33a (9.07) 20.08a 8.13 20.92a (7.43)
42.30a (3.52) 43.28a (4.84) 42.69a (4.86)
4.97a 14.22a (1.03) (1.51) 4.47a 13.62a (0.74) (2.13) 4.45a 13.90a (0.92) (2.72)
8.06b (0.56) 9.78a (1.16)
0.46a (0.01) 0.37b (0.02)
8.06b (0.56) 9.78a (1.16)
0.88a (0.15) 0.90a (0.14)
95.91a (3.85) 93.94a (4.44)
3.07b (0.24) 3.29a (0.35)
18.68a (0.83) 19.17a (1.46)
24.56a (6.26) 19.39b (8.48)
42.30a (4.47) 42.98a (4.39)
4.41 13.54a (0.67) (1.98) 4.74 14.10a (1.01) (2.23)
9.25a (1.13) 9.10a (1.49) 9.26a (1.29)
0.40a 233.02a 9.25a (0.04) (21.60) (1.13) 0.41a 224.97ab 9.10a (0.04) (22.20) (1.49) 0.40a 199.42b 9.26a (0.04) (19.37) (1.29)
0.82c (0.22) 0.90b (0.06) 0.96a (0.05)
91.35b (4.39) 96.23a (1.89) 96.21a (4.30)
3.04b 19.53a 24.98a (0.27) (0.59) (7.81) 3.24ab 18.92ab 19.94ab (0.39) (1.97) (8.38) 3.37a 18.56b 18.42a (0.25) (0.71) (7.07)
45.76a 4.28b 14.38a (4.58) (0.47) (1.41) 42.69b 4.57ab 13.56a (3.41) (0.89) (2.40) 39.82c 5.03a 13.80a (2.96) (1.15) (2.51)
9.03a (1.42) 9.64a (1.46) 8.94a (0.85)
0.40a (0.05) 0.41a (0.04) 0.40a (0.04)
1160.89a 0.95a (142.38) (0.06) 1185.14a 0.88b (155.36) (0.18) 1096.63b 0.85b (163.00) (0.16)
94.47a (4.86) 94.59a (5.05) 94.73a (2.99)
3.05b (0.26) 3.29a (0.26) 3.31a (0.41)
42.91a (5.09) 42.83a (2.98) 42.52a (5.02)
222.61a (29.52) 217.40a (23.07)
221.36a (30.00) 219.75a (19.24) 216.30a (26.49)
20.73a (7.76) 20.39a (10.19) 22.22a (6.33)
18.95ab 23.42 (1.09) (7.08) 18.59b 21.78a (0.88) (7.57) 19.47a 18.14a (1.69) (9.13)
44.09a (5.05) 42.27a (4.31) 41.91a (3.62)
3.94b 12.76b (0.49) (2.27) 4.77a 14.55a (0.73) (1.94) 5.17a 14.43a (1.01) (1.83)
4.68a 14.24a (0.74) (2.10) 4.42a 13.48a (0.86) (2.40) 4.79a 14.02a (1.13) (1.98)
* Means within a column (a given dependent variable) followed by similar letters for a given independent variable are not significantly different at P < 0.05, LSD. Values in parentheses are standard deviation. SBM is soybean meal; MCRaw is raw blend moisture content; SS is screw speed; Screw Comp. is screw compression ratio; die L/D is length-to-diameter ratio of the die; T (°C) is temperature profile (100 is 80-100-100°C, 120 is 80-120-120, 140 is 80-140-140°C); aw Raw is water activity of raw blend; LRaw is brightness/darkness of the raw blend; aRaw is redness/greenness of the raw blend; bRaw is yellowness/blueness of the raw blend; P is die pressure; MFR is mass flow rate; ηapp is dough apparent viscosity; SME is specific mechanical energy; MCExt is extrudate moisture content; awExt is extrudate water activity; BD is extrudate bulk density; UD is extrudate unit density; ER is extrudate expansion ratio; PDI is extrudate pellet durability index; WAI is water adsorption index; WSI is water solubility index; LExt is extrudate brightness/darkness; aExt is extrudate redness/greenness; bExt is extrudate yellowness/blueness.
19
www.ccsenet.org/jfr
Journal of Food Researcch
Vol. 2, No. 2; 2013
Table 5. Treatment T effeccts on the meassured extrusionn processing parameters* p Property P at Die (Mpa) Torque (Nm) MFR (g min-1) ηapp (Pa·s) SME (J g-1) T1 (°C) T2 (°C) T3 (°C)
1 2b 9.32 (2.06 6) 31.67b bcd (2.27 7) 74.90 0a (4.95 5) 2877.5 54b
Treatment 2 3 4 5 6 7 8 9 10 11 5.03ef 5.15e ef 11.05a 7.92c 7d 2.55ij 0.87kl 9.12b 4.10fg 9.90b 6.77 (0.97) (1.71 1) (1.52) (0.77) (0.08) (0.50) (1.63 3) (0.38) (0.28) (0.59) 26.81c-f 35.21 1b 44.05b 46.26a 8.59h 22.93ef 13.24 4gh 20.20fg 8.26h 24.94def (12.61) (9.46 6) (1.76) (4.62) (0.31) (4.76) (4.39 9) (9.08) (1.66) (3.53) 186.80b 225.6 60a 172.60bc 78.07g 88.00fg 105.73ef 85.67fg 72.07g 124.53de 67.13g (50.95) (7.88 8) (2.03) (0.64) 1) (2.04) (2.19) (9.10) (4.01 (5.16) (3.29) 1623.54cd 1599.6 64cd 1697.67cd 3565.88a a 424.44h 1510.01cde 76 62.06fgh 1388.15de 601.36 6gh 1835.30c
(205.9 99) 755.96 6bcd (10.7 71) 80.7 75 (1.39 9) 101.3 38 (0.91 1) 103.0 00 (2.20 0)
(763.30) 582.70c-f (36.24) 78.63 (3.34) 118.88 (0.35) 119.00 (0.76)
(429.8 84) (67.92) 784.55 5bcd 830.24bc (66.0 08) (18.24) 81.2 25 79.38 (2.55 5) (0.52) 139.1 13 102.75 (0.83 3) (4.50) 141.3 38 102.75 (0.74 4) (3.10)
(356.36) (85.74) (213.96) 1250.33a a 411.01def 615.51c-f (88.99) (75.12) (59.62) 78.80 79.25 80.75 (1.98) (0.71) (1.83) 121.00 140.25 99.75 (0.53) (0.46) (0.46) 123.13 143.50 99.50 (1.73) (1.41) (0.53)
12 1.53jk (0.87) 19.08fg (14.93) 159.67c (9.47) 866.54fg
13 14 15 5 16 3.77gh 4.11fg 0.29 9l 2.76hi (0.45) (0.66) (0.07 7) (0.76) 51.73a 29.66b-e 8.38 8h 19.76fg (16.60) (10.04) (0.79 9) (8.90) 1 130.60d 161.20c 75.53 3g 135.67d (4.86) (0.53) (2.23 3) (3.83) 2 2658.80b 1143.18ef 645.54 4gh 761.64fgh
( (88.28) (288.26) (199.3 37) (824.80) (678.28) (853.39) ( 297.70f 473.70c-f 350.50ef 408.10def1055.00ab1449.40a 2 80) (192.87) (809.03) (469.37) ( (3.35) (46.00) (14.8 79.75 80.25 80.0 00 80.00 82.13 82.13 (0.46) (0.71) (0.53 3) (0.76) (1.96) (2.10) 100.00 122.50 119.3 38 140.00 133.00 100.88 (0.00) (1.19) (0.92 2) (1.07) (8.64) (0.64) 100.00 121.50 119.7 75 140.00 142.00 99.88 (0.00) (1.31) (0.46 6) (0.00) (4.41) (0.35)
17 18 5.56e 7.91c (1.50) (1.60) 23.99def 33.14bc (5.08) (5.08) 76.53g 119.09de (14.45) (4.09) 1848.94c 1703.35cd
(386.99) (61.0 07) (343.18) (391.46) (261.15) 831.80bc 353.2 20ef 756.00bcd 606.90c-f 732.50b-e (252.57) (42.0 07) (138.74) (96.15) (175.40) 81.00 80.6 63 79.63 79.75 79.63 (2.51) (0.74 4) (0.52) (0.71) (0.52) 96.88 122.3 38 119.63 139.88 138.00 (3.87) (3.85 5) (0.74) (0.35) (1.07) 103.25 121.8 88 120.00 139.88 140.63 (2.05) (2.53 3) (0.00) (0.35) (1.85)
* Means foollowed by sim milar letters forr a given depenndent variable (row) are not significantly s diifferent at P < 0.05, LSD. Valuues in parenthheses are stand dard deviation.. P is die presssure, MFR is mass flow rate, ηapp is apparent viscosity, SME is specifi fic mechanical energy, T1 is extruder feed zone z temperatu ure, T2 is extruuder metering zone temperaturre, T3 is extrudder die zone teemperature.
Figure 1. Treatment T combbination effectts on mass flow w rate MFR (g/m min) = -1.19 – 00.19*DDGS (g g/kg) + 0.84*S SS (rpm);(R2 = 0.54, F = 29.5 58). 3.1.4 Appaarent Viscosityy All indepeendent variablees had significcant effects onn the apparent viscosity, as shown by the main m and treattment effects (Taables 4 and 5).. Standard dev viations for the apparent viscosity were som mewhat high; values v for apparent viscosity ranged betweenn 424.44 (Run 6) and 3565.88 (Run 5) Pa.s. For the main effects (Table 4), with increaasing DDGS conntent, temperaature, screw sp peed, and screew compressioon ratio, decreeases in apparrent viscosity were observed. Raising the D DDGS level fro om 20 to 40% % yielded a deccrease in appaarent viscosity of 43.3%. Sim milar results werre observed byy Kannadhason n et al. (2009b)). Compared too soybean meaal, DDGS has higher h fiber content and less protein. Increassing the DDGS content in thhe blends, whhile reducing th he amount of SBM, changedd the chemical composition c annd the potentiaal functionalityy of the ingreddients in the do ough, thus affe fecting the apparent viscosity (Chevanan ( et al., 2010). A decrease in aapparent viscoosity by 22.3% % was observeed as the die zone et al. temperaturre was raised from 100 to 140°C; this ressult is supporteed by findingss reported by Kannadhason K (2009b) annd Chevanan ett al. (2010). Liikewise, previoous studies reported that increeasing the tempperature resultted in a decreasee in viscosity (L Launay & Liscch, 1983; Senoouci & Smith, 1988). The reeduced viscositty can be relatted to starch gelaatinization, prootein denaturattion, chemical and structurall transformatio ons, respectiveely. Changes ddue to higher moiisture content w were curvilineear and showedd a significant difference d only y when increassing MC from 30 to 40%, speccifically a reduuction of 51.2 2%. Similar findings were made m by Chev vanan et al. (22007a, 2010), who concluded that this behhavior was caused c by com mpeting interaactions betweeen moisture content and oother independennt variables. IIncreasing the screw speed ffrom 100 to 150 and 200 rp pm had signifi ficant effects oon all recorded values v for the aapparent viscossity, and yieldeed an overall decrease d by 42..3%. These reccordings are sim milar to observaations made byy other researcchers (Kannadhhason et al., 20009b), as the dough d was pseeudoplastic. Onn the other handd, an increase in viscosity of o 36.9% was observed wheen increasing the die L/D ratio r from 5 too 13. 20
www.ccsenet.org/jfr
Journal of Food Research
Vol. 2, No. 2; 2013
Chevanan et al. (2007a) made similar observations as well. With changes in die L/D ratio, only the die diameter changed, whereas the length stayed the same. With a smaller die diameter, pressure and shear increased, which led to an increase in viscosity. Increasing the screw compression led to a decrease in apparent viscosity by 33.3%, and was pseudoplastic behavior. 3.1.5 Specific Mechanical Energy Specific mechanical energy consumption quantifies the net energy that is required to convey the material through the extruder per unit rate of mass flow. For the main effects, no clear pattern of changes could be observed with varying levels of the independent variables, which again was related to the high standard deviations. The highest SME was detected at 1449.40 J/g (Run 13) and the lowest at 297.70 J/g (Run 8; Table 5). With increasing DDGS level, SME showed a significant decrease (Table 4). With increasing SBM, however, the SME increased as well. Increasing the screw speed and compression ratio of the screw yielded an increase and decrease in SME by 25.4% and 14%, respectively. As temperature profile and L/D ratio increased, SME exhibited curvilinear behavior. 3.1.6 Temperature Temperature settings were adjusted in the beginning of each extrusion run to the desired value. However, throughout processing, temperatures within the different zones increased due to friction (Table 5) and were adjusted by using external air when temperature increased more than 5°C. These temperature effects were expected, due to frictional heating and shear forces in the barrel during extrusion processing. This was due to the design of the extruder (i.e. the conveying mechanism of the flighted screw, the viscous properties of the raw material, and the grooved walls that reduce slip and cause friction) (Harper, 1981). 3.2 Extrudate Physical Properties 3.2.1 Moisture Content The moisture content of the raw blends had one of the most important impacts on almost all extrudate physical properties and their cohesiveness (Table 4). Previous studies have shown that extrudate MC increased with higher DDGS levels (Ayadi et al., 2011b; Kannadhason et al., 2010) as well as the MC of the raw blends (Kannadhason et al., 2009b; Rosentrater, 2009b). In this study, extrudate MC decreased significantly (by 8.8%) when DDGS content of the blends increased from 20 to 30%, whereas MC did not show significant effects when increasing DDGS level from 30 to 40%. Increases with higher initial MC were as expected due to the higher water content of the raw blends. The difference between initial and final MC can be caused by greater flashing of moisture during exiting the die. The highest value for extrudate MC was 12.01% (Run 16) and the lowest was 7.24% (Run 1) (Table 6). Regarding the other independent variables, some differences occurred for the extrudate MC, in terms of main effect or treatment combination effects (Table 6). Also, using the 3:1 screw (with a higher compression ratio) yielded higher extrudate MC, by 21.3%. Table 6. Treatment effects on extrudate physical properties* Property
Treatment 9 10
1
2
3
4
5
6
7
8
11
12
13
14
15
16
17
18
MC (g kg -1)
7.24k (0.09)
8.10i (0.05)
8.62gh (0.10)
7.67j (0.06)
7.88ij (0.11)
8.84fg (0.04)
11.43b (0.04)
9.27e (0.32)
10.12d (0.21)
10.28cd (0.32)
8.22hi (0.05)
10.54c (0.23)
9.19ef (0.29)
9.41e (0.58)
9.43e (0.31)
12.01a (0.45)
8.11i (0.12)
9.33e (0.13)
aw (-)
0.47a (0.00)
0.45c (0.00)
0.44c (0.01)
0.47a (0.00)
0.46b (0.00)
0.45c (0.00)
0.38f (0.01)
0.37gh (0.00)
0.38fg (0.00)
0.37fgh (0.00)
0.39e (0.01)
0.37gh (0.00)
0.37gh (0.00)
0.35i (0.00)
0.38fg (0.00)
0.41d (0.00)
0.37fg (0.01)
0.36h (0.00)
BD (kg m-3)
241.22d (2.08)
230.81e (2.10)
177.10l (4.78)
267.39a (1.42)
215.98g (2.19)
203.16j (1.41)
175.04l (2.56)
209.17hi (3.11)
196.62k (3.36)
254.73c (0.66)
228.93ef (2.48)
259.34b (1.24)
228.85ef (0.74)
206.49ij (1.40)
210.82h (2.76)
209.55hi (0.28)
225.29f (0.40)
204.00j (1.89)
UD (kg m-3)
1012.01ij 1132.85eh 1254.34bcd 1109.81ei 1329.95ab 1170.72def 1389.22a 1257.15bcd 1182.74cde 1023.55i (58.16) (51.00) (49.20) (50.00) (200.92) (167.36) (65.73) (62.34) (55.12) (27.95)
925.42j 1081.64fi 1045.62i (148.21) (43.24) (52.83)
1153.98efg 1164.84dg 1279.89bc 1080.48fi 1068.86ghi (75.80) (198.15) (80.01) (224.16) (46.30)
ER (-)
0.94de (0.04)
0.91e (0.02)
0.94de (0.02)
0.99bc (0.03)
0.94de (0.02)
0.56g (0.03)
0.90e (0.01)
0.85f (0.02)
1.02ab (0.03)
1.05a (0.02)
0.82f (0.02)
0.84f (0.15)
0.99bc (0.01)
0.99bc (0.03)
0.53g (0.07)
0.85f (0.03)
0.97cd (0.06)
0.94de (0.05)
PDI (%)
87.79gh (0.20)
96.07a-e (0.11)
98.99a (0.17)
97.61abc (0.08)
97.95abc (0.01)
97.07a-d (0.05)
96.35a-e (4.60)
98.44ab (0.06)
92.93ef (8.71)
86.49h (0.30)
94.38b-f (2.29)
91.01fg (0.53)
88.70gh (0.76)
97.94abc (0.30)
97.04a-e (0.06)
97.07a-d (0.23)
93.11def (2.97)
93.83c-f (0.27)
WAI (-)
3.00i (0.01)
3.04ghi (0.04)
3.03hi (0.02)
3.05gh (0.02)
3.55d (0.01)
2.77k (0.02)
3.55d (0.01)
2.81k (0.02)
3.33f (0.00)
2.90j (0.01)
3.90a (0.02)
3.48e (0.06)
2.81k (0.00)
3.08g (0.06)
3.30f (0.01)
3.60c (0.01)
3.67b (0.01)
3.04ghi (0.01)
WSI (%)
20.10b (0.15)
17.72gh (0.40)
18.56efg (0.22)
17.98fgh (0.05)
18.64def (0.08)
19.05cde (0.50)
19.51bc (0.18)
17.73gh (0.55)
19.06cde (0.03)
19.10cde (0.71)
22.72a (0.09)
19.58bc (0.11)
20.24b (0.17)
18.16fgh (0.45)
19.10cde (0.22)
17.93fgh (1.72)
17.43h (0.16)
19.45bcd (0.45)
WS (min)
>30.00a (0.00)
19.67c (4.73)
>30.00a (0.00)
15.33de (0.58)
22.33b (2.52)
>30.00a (0.00)
14.83de (2.25)
>30.00a (0.00)
9.17f (1.04)
19.50c (0.87)
7.83f (1.53)
10.37f (1.10)
>30.00a (0.00)
20.33b (1.53)
>30.00a (0.00)
>30.00a (0.00)
13.83e (1.26)
16.83d (1.26)
L (-)
48.96a (0.35)
43.94b (1.19)
35.55g (0.92)
43.53b (0.19)
42.61bc (1.42)
39.20de (3.18)
36.53fg (0.37)
38.42ef (0.92)
42.44bc (0.54)
48.10a (0.55)
42.44bc (1.94)
48.64a (1.19)
49.40a (0.23)
40.66cd (1.04)
40.25de (0.10)
39.64de (1.56)
41.11cd (1.11)
48.18a (0.37)
a (-)
3.96e (0.16)
4.54cde (0.80)
3.87ef (0.19)
5.39b (0.07)
4.15e (0.21)
4.53cde (0.89)
4.04e (0.11)
5.05bcd (0.25)
5.61b (0.05)
4.40de (0.39)
5.15bc (0.39)
4.20e (0.16)
4.01e (0.48)
5.60b (0.20)
4.58cde (0.40)
3.21f (0.88)
6.92a (0.24)
4.06e (0.38)
b (-)
14.84bcd (0.47)
13.63de (1.85)
11.26fg (0.44)
16.47ab (0.11)
12.59ef (0.45)
12.46ef (1.72)
10.58gh (0.22)
12.98e (0.57)
16.21ab (0.06)
15.60ab (0.64)
13.52de (0.75)
9.60h (1.88)
16.56a (0.61)
13.83cde (1.02)
21
15.33abc 14.85bcd 15.15a-d 14.99a-d (1.03) (1.09) (0.08) (1.51)
www.ccsenet.org/jfr
Journal of Food Research
Vol. 2, No. 2; 2013
* Means followed by similar letters for a given dependent variable (row) are not significantly different at P