minerals Article
Concentration at the Minimum Bubble Velocity (CMV) for Various Types of Flotation Frothers Przemyslaw B. Kowalczuk 1,2, *, Jan Zawala 3 and Jan Drzymala 1 1 2 3
*
Faculty of Geoengineering, Mining and Geology, Wroclaw University of Science and Technology, Wybrzeze Wyspianskiego 27, 50-370 Wroclaw, Poland;
[email protected] Department of Geoscience and Petroleum, Norwegian University of Science and Technology, Sem Sælands veg 1, NO-7491 Trondheim, Norway Jerzy Haber Institute of Catalysis and Surface Chemistry PAS, Niezapominajek 8, 30-239 Krakow, Poland;
[email protected] Correspondence:
[email protected]; Tel.: 0047-9303-1854
Received: 28 June 2017; Accepted: 10 July 2017; Published: 12 July 2017
Abstract: This paper presents the determination of a concentration at the minimum bubble velocity (CMV) for different types of frothers, such as straight and branched alkyl chain aliphatic alcohols, 1,ω-diols, poly(propylene glycol) and poly(ethylene glycol) alkyl ethers, n-alkyltrimethylammonium bromides, commercial frothers and others. The values of terminal rise bubble velocity were reviewed from the experimental data published in the literature for two different types of columns, i.e., a short PAS (used in Polish Academy of Sciences) of height (35 cm) and a long McGill of height (350 cm). The obtained empirical equation is universal and allows one to rapidly and accurately determine the CMV for all surfactants. The proposed empirical model can also be used to predict the terminal bubble velocity–frother concentration curve by knowing the maximum and minimum terminal velocities, as well as the values of CMV. Assessment and usefulness of frother characterization parameters (i.e., concentration at the minimum bubble velocity (CMV), dynamic frothability index (DFI) and critical coalescence concentration (CCC)) were shown in the flotation of coal. Keywords: concentration at the minimum bubble velocity; frothers; flotation; bubble velocity; bubble size; critical coalescence concentration; dynamic frothability index
1. Introduction Flotation frothers are surface active substances commonly used in a froth flotation separation process as an important additive of the pulping process. They are mainly aimed to modify the liquid/gas interface properties to enhance many essential fundamental factors (e.g., degree of gas dispersion, coalescence inhibition, bubble rise velocities, induction time, froth formation and stability) influencing the separation efficiency. Currently, a vast number of types of frothers are used, and the impact on the above-mentioned factors depends mainly on their surface activity in the chosen concentration range. This influence has to be experimentally determined in terms of the most efficient range of concentrations, where desired liquid/gas interface properties, triggering useful frothers’ features and allowing their classification, can be achieved. The experimentally determined parameters, which are commonly used for these purposes, are for example, the concentration at the minimum bubble velocity (CMV) [1–3], the critical coalescence concentration (CCC) [4–6], the concentration at half of the maximum foam height (CMH) [7] or the dynamic frothability index (DFI) [8–10]. Since all these parameters depend mainly on the properties of the liquid/gas interface, the corresponding characteristic frother concentration values can vary strongly, depending on the frother’s family (type) and carbon chain length.
Minerals 2017, 7, 118; doi:10.3390/min7070118
www.mdpi.com/journal/minerals
Minerals 2017, 7, 118
2 of 15
From the practical point of view, it would be very beneficial to determine a methodology, which can be used for the simple characterization and anticipation of frothers’ properties in terms of CMV, CCC, CMH and DFI variations, based on basic experimental results, which can be either found in a myriad of published papers or easily determined. In this paper, we show a methodology to obtain an Minerals 2017, 7, 118 2 of 15 empirical equation allowing the rapid and accurate determination of the value of the CMV for surface active substances commonly usedofasview, flotation frothers. addition, it is shown that the proposed From the practical point it would be veryIn beneficial to determine a methodology, empirical approach can for be the used to predict the dependence of a rising bubble terminal velocity as a which can be used simple characterization and anticipation of frothers’ properties in terms of CMV, CCC, CMH and DFI variations, based on basic experimental results, which can be either function of frother concentration only by knowing the border velocity values (maximum and minimum) a myriad of published papers or easily determined. Inextended this paper, for we show a methodology and the found CMVinfor a given system. This approach can also be prediction of the bubble to obtain an empirical equation allowing the rapid and accurate determination of the value of the size–concentration curve, where the minimum and maximum bubble sizes, as well as the CCC value, CMV for surface active substances commonly used as flotation frothers. In addition, it is shown that are known. the proposed empirical approach can be used to predict the dependence of a rising bubble terminal velocity as a function of frother concentration only by knowing the border velocity values
2. Columns Used and to Measure Velocity (maximum minimum)Bubble and the CMV for a given system. This approach can also be extended for
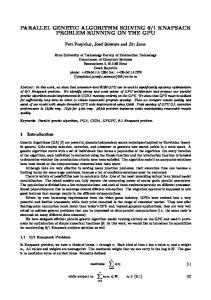
prediction of the bubble size–concentration curve, where the minimum and maximum bubble sizes, In this work, the values of terminal rise bubble velocity were reviewed from the experimental as well as the CCC value, are known. data published in the literature. Two series of single bubble tests were considered: one at the Jerzy Haber Institute of Used Catalysis and Surface Chemistry, Polish Academy of Science in Krakow (Poland), 2. Columns to Measure Bubble Velocity shortly called PAS, using a short column (height 35 cm), and the other one at McGill University in In this work, the values of terminal rise bubble velocity were reviewed from the experimental Quebec data (Canada), shortly McGill, using longbubble column (350 cm). The experimental setups of published in the called literature. Two series of asingle tests were considered: one at the Jerzy both tests are Institute presented in Figure 1. Surface Chemistry, Polish Academy of Science in Krakow (Poland), Haber of Catalysis and called was PAS,described using a short (height 35 cm), thesetup other consisted one at McGill in of (i) a Theshortly PAS setup in column detail elsewhere [11].and The of aUniversity basic level Quebec (Canada), shortly called McGill, using a long column (350 cm). The experimental setups of square glass column (40 mm × 40 mm) with a height of 35 cm; (ii) a glass capillary with an inner both tests are presented in Figure 1. diameter of 0.075 mm at the bottom of the column; (iii) a high-speed camera (1000–1024 frames per The PAS setup was described in detail elsewhere [11]. The setup consisted of a basic level of (i) a second);square (iv) a glass highcolumn precision pump gas-tight a computer (40 mm × 40with mm) awith a heightsyringe; of 35 cm;(v) (ii)a alight glasssource; capillaryand with(vi) an inner for datadiameter processing (Figure 1a). To determine profiles of the local velocity of the bubble of 0.075 mm at the bottom of the column; (iii) a high-speed camera (1000–1024 frames detaching per second); (iv) high precision pump was with monitored a gas-tight syringe; (v) adistance light source; and300 (vi) mm. a computer from the capillary, athe bubble motion over the of ca. The bubble data processing (Figure 1a). To average determinefor profiles of the where local velocity bubble terminalfor velocity was calculated as an distances, valuesofofthe the local detaching bubble velocity from the capillary, the bubble motion was monitored over the distance of ca. 300 mm. The bubble started to be constant. The distance of 300 mm was enough for the rising bubble to reach the terminal terminal velocity was calculated as an average for distances, where values of the local bubble velocity velocity [11,12].started to be constant. The distance of 300 mm was enough for the rising bubble to reach the Theterminal McGillvelocity experimental [11,12]. setup proposed by Finch and his co-workers was described in detail elsewhere [1–3] (Figure 1b). It comprised (i) a by circular Plexiglas column with a 6.35incm diameter The McGill experimental setup proposed Finch and his co-workers was described detail elsewhere [1–3] (Figure 1b). It comprised (i) a circular Plexiglas column with a 6.35 cm diameter and and a height of 350 cm surrounded by a water jacket; (ii) a glass capillary with an inner diameter of a height 350 cmgenerator surrounded byframes a water per jacket; (ii) a glass with an inner diameter of 0.051for data 0.051 mm, (iii) aof bubble (30 second), (iv)capillary a CCD camera and (v) a computer mm, (iii) a bubble generator (30 frames per second), (iv) a CCD camera and (v) a computer for data processing. The terminal bubble velocity was measured at the distance of 300 cm from the capillary. processing. The terminal bubble velocity was measured at the distance of 300 cm from the capillary.
(a)
(b)
Figure 1. PAS (a) and McGill (b) experimental setups used to measure local velocity of the bubble
Figure 1.(after PAS (a) and McGill (b) experimental setups used to measure local velocity of the bubble [2,11]). (after [2,11]).
Minerals 2017, 7, 118
3 of 15
Minerals 2017, 7, 118
3 of 15
Profiles for different different types types of of chemical chemical reagents, reagents, Profiles of of the the local local bubble bubble velocity velocity were were determined determined for such as straight and branched alkyl chain aliphatic alcohols, 1,ω-diols, poly(propylene glycol) such as straight and branched alkyl chain aliphatic alcohols, 1,ω-diols, poly(propylene glycol) alkyl alkyl ethers (C P ), poly(ethylene glycol) alkyl ethers (C E ), n-alkyltrimethylammonium bromides, n m n m ethers (CnPm), poly(ethylene glycol) alkyl ethers (CnEm), n-alkyltrimethylammonium bromides, commercial The properties properties of of chemical chemical reagents reagents used used are are shown shown in in Table Table 11 in commercial frothers frothers and and others. others. The in Section 4. All reagents were of the highest available purity and were used without further purification. Section 4. All reagents were of the highest available purity and were used without further ® was used in the tests, cleaning and preparation of surfactant solutions for the single Mili-Q waterMili-Q purification. water® was used in the tests, cleaning and preparation of surfactant solutions for bubble tests in the PAS column, while tap water used in theused McGill tests. the single bubble tests in the PAS column, whilewas tap water was in the McGill tests.
40
40
30
30
20
1-pentanol, M
10
0
water 8e-5 6e-4 1.5e-3 6.8e-3
bubble velocity, cm/s
bubble velocity, cm/s
3. Terminal Bubble Velocity 3. Terminal Bubble Velocity Profiles of local velocities of bubbles in water and the aqueous solutions of 1-pentanol, as an Profiles of local velocities of bubbles in water and the aqueous solutions of 1-pentanol, as an example, after detachment from capillaries in the McGill and PAS columns are presented in Figure 2a,b, example, after detachment from capillaries in the McGill and PAS columns are presented in respectively. It can be clearly seen that, irrespective of the column type and length, in pure water the Figure 2a,b, respectively. It can be clearly seen that, irrespective of the column type and length, in bubble accelerates rapidly to a terminal (constant) velocity, which is equal to ca. 33 and ca. 35 cm/s in pure water the bubble accelerates rapidly to a terminal (constant) velocity, which is equal to ca. 33 the McGill and PAS columns, respectively. The terminal velocity in the McGill column was determined and ca. 35 cm/s in the McGill and PAS columns, respectively. The terminal velocity in the McGill at the distance of 300 cm, while in the PAS column was at 30 cm. column was determined at the distance of 300 cm, while in the PAS column was at 30 cm. In the aqueous solutions of surfactants, the bubble velocity reaches the maximum, and then In the aqueous solutions of surfactants, the bubble velocity reaches the maximum, and then decreases until it assumes a constant value of the terminal velocity. The value of the terminal velocity decreases until it assumes a constant value of the terminal velocity. The value of the terminal of the bubble depends on the solution concentration. The impact of the surfactant concentration on the velocity of the bubble depends on the solution concentration. The impact of the surfactant profiles of bubble velocities is described in detail elsewhere (e.g., [2,3,11–22]). In short, it depends on concentration on the profiles of bubble velocities is described in detail elsewhere (e.g., [2,3,11–22]). In the mass transfer rate, molecular orientation and packing at the liquid/gas interface, surface activity short, it depends on the mass transfer rate, molecular orientation and packing at the liquid/gas and mobility, surface tension gradients, surface viscosity, as well as hydration effects. A detailed interface, surface activity and mobility, surface tension gradients, surface viscosity, as well as discussion of the mechanism is outside of the scope of this paper. hydration effects. A detailed discussion of the mechanism is outside of the scope of this paper.
20
1-pentanol, M water 1e-4 5e-4 1e-3 1.5e-3 3e-3 5e-3
10
0 0
100
200
300
3000
distance from capillary, mm
(a)
3250
3500
0
50
100
150
200
250
300
350
distance from capillary, mm
(b)
Figure 1-pentanol in in McGill McGill (a) (a) and and PAS PAS (b) (b) columns. columns. Figure 2. 2. Bubble Bubble velocity velocity profiles profiles in in the the presence presence of of 1-pentanol
Figure 3a shows the terminal velocities as dependent on the concentration of 1-pentanol, as an Figure 3a shows the terminal velocities as dependent on the concentration of 1-pentanol, example. Initially, the values of terminal velocities decrease rapidly with the surfactant as an example. Initially, the values of terminal velocities decrease rapidly with the surfactant concentration until the bubble reaches the minimum terminal velocity of ca. 15 cm/s, which then is concentration until the bubble reaches the minimum terminal velocity of ca. 15 cm/s, which then is not further affected by the frother concentration. Despite the difference in the distance and bubble not further affected by the frother concentration. Despite the difference in the distance and bubble size in the McGill (h = 300 cm) and PAS (h = 30 cm) columns, one can observe that dependences of the size in the McGill (h = 300 cm) and PAS (h = 30 cm) columns, one can observe that dependences terminal bubble velocity on the surfactant concentration (Figure 3) have similar patterns. The of the terminal bubble velocity on the surfactant concentration (Figure 3) have similar patterns. profiles of local bubble velocities are slightly different due to, for example, bubble size and bubble The profiles of local bubble velocities are slightly different due to, for example, bubble size and bubble formation time. By normalizing the terminal bubble velocities in the McGill and PAS columns using formation time. By normalizing the terminal bubble velocities in the McGill and PAS columns using (v − vmin)/(vmax − vmin), where vmax and vmin are the maximum (in water, ca. 33 and 35 cm/s in McGill (v − vmin )/(vmax − vmin ), where vmax and vmin are the maximum (in water, ca. 33 and 35 cm/s in and PAS) and minimum (ca. 15 cm/s) terminal bubble velocities, respectively, it can be seen from McGill and PAS) and minimum (ca. 15 cm/s) terminal bubble velocities, respectively, it can be seen Figure 3b, that all the experimental points fit one single curve, indicating that the profiles of bubble from Figure 3b, that all the experimental points fit one single curve, indicating that the profiles of velocities in the presence of an aqueous solution of 1-pentanol are similar. The same results were observed for all types of the investigated flotation frothers.
Minerals 2017, 7, 118
4 of 15
bubble velocities in the presence of an aqueous solution of 1-pentanol are similar. The same results 4 of 15 were observed for all types of the investigated flotation frothers.
Minerals 2017, 7, 118 35
terminal bubble velocity, cm/s
1-pentanol 30 McGill column PAS column 25
20
15 0
normalized terminal bubble velocity
1.0 1-pentanol 0.8 McGill column PAS column 0.6
0.4
0.2
0.0
0
2
4
6
8
10
0
2
4
concentration, mM
6
8
10
concentration, mM
(a)
(b)
Figure 1-pentanol concentration on on (a) (a) normal andand (b) normalized (v − (v vmin−)/(v max − Figure 3. 3. Influence Influenceofof 1-pentanol concentration normal (b) normalized vmin )/ v(vmin) terminal bubble velocity measured in McGill (300 cm) and PAS (30 cm) columns. − v ) terminal bubble velocity measured in McGill (300 cm) and PAS (30 cm) columns. max
min
4. Concentration at the Minimum Bubble Velocity (CMV) 4. Concentration at the Minimum Bubble Velocity (CMV) Figure 4 shows the dependences of the normalized terminal bubble velocity on the Figure 4 shows the dependences of the normalized terminal bubble velocity on the concentration concentration of different types of surfactants tested in the McGill and PAS columns. The of different types of surfactants tested in the McGill and PAS columns. The concentration is concentration is presented on a logarithmic scale. It can be clearly seen that, irrespective of the type presented on a logarithmic scale. It can be clearly seen that, irrespective of the type of column, of column, the bubble velocity–concentration (v–c) trend is generic for all investigated frothers. As the bubble velocity–concentration (v–c) trend is generic for all investigated frothers. As discussed discussed elsewhere (e.g., [1–3]), the surfactants, and thus their foaming properties, can be elsewhere (e.g., [1–3]), the surfactants, and thus their foaming properties, can be characterized by the characterized by the concentration at the minimum bubble velocity (CMV). The values of CMV can concentration at the minimum bubble velocity (CMV). The values of CMV can be either interpreted be either interpreted from the v–c plot or mathematically determined. The estimation of the CMV from the v–c plot or mathematically determined. The estimation of the CMV from the v–c plot from the v–c plot (Figure 3) is done by taking the intersection of the linear trend imposed on the data (Figure 3) is done by taking the intersection of the linear trend imposed on the data with the minimum with the minimum terminal bubble velocity (ca. 15 m/s) line by determining the 95% confidence terminal bubble velocity (ca. 15 m/s) line by determining the 95% confidence interval of the line [1]. interval of the line [1]. This graphical method is similar to that used in determining the critical This graphical method is similar to that used in determining the critical micelle concentration (CMC) micelle concentration (CMC) from a surface tension-concentration plot [23] and the critical from a surface tension-concentration plot [23] and the critical coalescence concentration (CCC) from coalescence concentration (CCC) from a bubble size-concentration plot [4,18]. A more practical a bubble size-concentration plot [4,18]. A more practical approach is to use a formula, which allows approach is to use a formula, which allows one to rapidly and accurately determine the CMV of one to rapidly and accurately determine the CMV of frothers. Based on the relationship between the frothers. Based on the relationship between the terminal bubble velocity v and the frother terminal bubble velocity v and the frother concentration c (Figure 4), the values of the CMV can be concentration c (Figure 4), the values of the CMV can be determined by utilizing the empirical determined by utilizing the empirical equation: equation: 2
)) ( / v == vmin + + vmin ); )· e−3(c/CMV (v(max −−
(1) (1)
and vmax are the minimum and maximum terminal velocities, respectively. where where vvmin min and vmax are the minimum and maximum terminal velocities, respectively. By normalizing the terminal terminal bubble bubblevelocity velocitywith with(v(v− −v vmin)/(v )/(vmax −− vvmin) )and the frother By normalizing the max min min and the frother concentration c in relation to the CMV values for all investigated frothers, it can be clearly concentration c in relation to the CMV values for all investigated frothers, it can be clearly seen seen that that all all experimental experimental data data points points converge converge to to one one single single universal universal curve curve (Figure (Figure 4b). 4b). This This self-similarity self-similarity gives gives aa unique unique trend trend line line for for all all frothers frothers by by plotting plotting the the normalized normalized terminal terminal bubble bubble velocity velocity against against the normalized concentration c/CMV. It indicates that the frothers act similarly but at different the normalized concentration c/CMV. It indicates that the frothers act similarly but at different concentrations, concentrations, expressed expressed as as CMV. CMV. The The experimental experimental and and determined determined values values of of CMV CMV are are given given in in Table 1. Figures 5–9 show the results for different frother families, that is straight and branched Table 1. Figures 5–9 show the results for different frother families, that is straight and branched alkyl alkyl chain 1,ω-diols, poly(propylene ethers (C (CnP m), poly(ethylene glycol) chain aliphatic aliphatic alcohols, alcohols, 1,ω-diols, poly(propylene glycol) glycol) alkyl alkyl ethers n Pm ), poly(ethylene glycol) alkyl ethers (C nPm), n-alkyltrimethylammonium bromides, commercial frothers and others. alkyl ethers (C P ), n-alkyltrimethylammonium bromides, commercial frothers and others. n m
Minerals 2017, 7, 118
5 of 15
Minerals 2017, 7, 118
5 of 15 1-butanol
1.0
1-pentanol 1-hexanol 1-heptanol 1-octanol 1-nonanol
normalized terminal bubble velocity
2-pentanol 3-pentanol
0.8
2-hexanol 3-hexanol 2-methyl-1-butanol 3-methyl-1-butanol 3-methyl-2-butanol 2-methyl-1-pentanol
0.6
3-methyl-1-pentanol 3-methyl-2-pentanol 3-methyl-3-pentanol 4-methyl-1-pentanol 1,2-pentanediol 1,2-hexanediol 1,5-hexanedio
0.4
1,6- hexanediol C1E2 C2E2 C3E2 C4E2 C6E2 C1P3
0.2
C3P3 C4P3 n-octanoic acid n-octyldimethylphosphine oxide n-octyl ß-D-glucopyranoside C8TAB
0.0 10-7
C12TAB
10-6
10-5
10-4
10-3
10-2
10-1
100
101
102
103
C16TAB a-terpineol DF250
concentration, mM
F150
(a) 1-butanol 1-pentanol
1.0
1-hexanol 1-heptanol 1-octanol 1-nonanol
normalized terminal bubble velocity
2-pentanol 3-pentanol
0.8
2-hexanol 3-hexanol 2-methyl-1-butanol 3-methyl-1-butanol 3-methyl-2-butanol 2-methyl-1-pentanol 3-methyl-1-pentanol
0.6
3-methyl-2-pentanol 3-methyl-3-pentanol 4-methyl-1-pentanol 1,2-pentanediol 1,2-hexanediol 1,5-hexanedio
0.4
1,6- hexanediol C1E2 C2E2 C3E2 C4E2 C6E2 C1P3
0.2
C3P3 C4P3 n-octanoic acid n-octyldimethylphosphine oxide n-octyl ß-D-glucopyranoside C8TAB
0.0 10-3
C12TAB
10-2
10-1
100
101
102
103
C16TAB a-terpineol DF250
normalized concentration, c/CMV
F150
(b)
Figure 4. Influence of surfactant concentration expressed in mM (a) and normalized surfactant Figure 4. Influence of surfactant concentration expressed in mM (a) and normalized surfactant concentration (c/CMV) terminalbubble bubble velocity −)/(v vmin )/(vmax vmin max − vmin ). − vmin ). concentration (c/CMV)(b) (b)on onthe thenormalized normalized terminal velocity (v −(v Straight alkyl chain aliphatic alcohols
Straight alkyl chain aliphatic alcohols
1.0
1.0 1-butano
1-butanol
1-hexano 1-heptan
0.8
1-octano 1-nonano 2-pentan 0.6
3-pentan 2-hexano 3-hexano
0.4
0.2
0.0 10-3
10-2
10-1
100
concentration, mM
(a)
101
102
1-pentanol
normalized terminal bubble velocity
normalized terminal bubble velocity
1-pentan
1-hexanol 0.8
1-heptanol 1-octanol 1-nonanol 2-pentanol
0.6
3-pentanol 2-hexanol 3-hexanol
0.4
0.2
0.0 10-3
10-2
10-1
100
101
102
normalized concentration, c/CMV
(b)
Figure 5. Influence of straight alkyl chain aliphatic alcohols concentration expressed in mM (a) and
Figure 5. Influence of straight alkyl chain aliphatic alcohols concentration expressed in mM (a) and normalized surfactant concentration (c/CMV) (b) on the normalized terminal bubble velocity. normalized surfactant concentration (c/CMV) (b) on the normalized terminal bubble velocity.
Minerals 2017, 7, 118
6 of 15
Minerals 2017, 7, 118 Minerals 2017, 7, 118 Minerals 2017, 7, 118 Branched alkyl chain aliphatic alcohols Branched alkyl chain aliphatic alcohols Branched alkyl chain aliphatic alcohols 2-methyl-1-butanol 2-methyl-1-butanol 3-methyl-1-butanol 2-methyl-1-butanol 3-methyl-1-butanol 3-methyl-2-butanol
1.0
normalized terminal bubble velocity normalized terminal bubble velocity normalized terminal bubble velocity
1.0 1.0
0.8 0.8
3-methyl-1-butanol 3-methyl-2-butanol 2-methyl-1-pentanol 3-methyl-2-butanol 2-methyl-1-pentanol 3-methyl-1-pentanol
0.8
2-methyl-1-pentanol 3-methyl-1-pentanol 3-methyl-2-pentanol 3-methyl-1-pentanol 3-methyl-2-pentanol 3-methyl-3-pentanol
0.6 0.6
3-methyl-2-pentanol 3-methyl-3-pentanol 4-methyl-1-pentanol 3-methyl-3-pentanol 4-methyl-1-pentanol
0.6
4-methyl-1-pentanol
0.4 0.4 0.4 0.2 0.2 0.2 0.0 0.0
1
2
1
0.0
3
2
4
3
concentration, 2 3 mM concentration, mM concentration, mM (a)
1
Branched alkyl chain aliphatic alcohols Branched alkyl chain aliphatic alcohols Branched alkyl chain aliphatic alcohols 2-methyl-1-butanol 2-methyl-1-butanol 3-methyl-1-butanol 2-methyl-1-butanol 3-methyl-1-butanol 3-methyl-2-butanol
1.0
normalized terminal bubble velocity normalized terminal bubble velocity normalized terminal bubble velocity
1.0 1.0
6 of 15 6 of 15 6 of 15
5
4
5
3-methyl-1-butanol 3-methyl-2-butanol 2-methyl-1-pentanol 3-methyl-2-butanol 2-methyl-1-pentanol 3-methyl-1-pentanol
0.8
2-methyl-1-pentanol 3-methyl-1-pentanol 3-methyl-2-pentanol 3-methyl-1-pentanol 3-methyl-2-pentanol 3-methyl-3-pentanol
0.6 0.6
3-methyl-2-pentanol 3-methyl-3-pentanol 4-methyl-1-pentanol 3-methyl-3-pentanol 4-methyl-1-pentanol
0.6
4-methyl-1-pentanol 0.4 0.4 0.4 0.2 0.2 0.2 0.0 0.0 0 0.0 0
5
4
0.8 0.8
1 1
0
2
3
2
4
3
5
4
6
5
6
normalized concentration, 2 3 4 c/CMV5 normalized concentration, c/CMV normalized concentration, c/CMV (b)
1
6
(a) (b) (a) (b) Figure 6. Influence of branched alkyl chain aliphatic alcohols concentration expressed in mM (a) and Figure 6. Influence of branched alkylchain chainaliphatic aliphatic alcohols expressed in mM (a) and Figure 6. Influence of branched alkyl alcoholsconcentration concentration expressed in mM (a) and Figure 6. Influence of branched alkyl (c/CMV) chain aliphatic concentration expressed in mM (a) and normalized surfactant concentration (b) on alcohols the normalized terminal bubble velocity. normalized surfactant concentration(c/CMV) (c/CMV) (b) terminal bubble velocity. normalized surfactant concentration (b) on onthe thenormalized normalized terminal bubble velocity. normalized surfactant concentration (c/CMV) (b) on the normalized terminal bubble velocity.
normalized terminal bubble velocity normalized terminal bubble velocity normalized terminal bubble velocity
1.0 0.8 0.8 0.8
1,2-pentanediol 1,2-pentanediol 1,2-hexanediol 1,2-hexanediol 1,5-hexanediol 1,2-pentanediol 1,5-hexanediol 1,6- hexanediol 1,2-hexanediol 1,6hexanediol 1,5-hexanediol
1.0
1,6- hexanediol
0.6 0.6 0.6 0.4 0.4 0.4 0.2 0.2 0.2 0.0 0.0 0 0.0 0
2 2
0
2
4 4
1,ω-diols 1,ω-diols 1,ω-diols
1.0 1.0
normalized terminal bubble velocity normalized terminal bubble velocity normalized terminal bubble velocity
1,ω-diols 1,ω-diols 1,ω-diols
1.0 1.0
concentration, mM 4 concentration, mM concentration, mM (a)
6 8
6
8
1,2-hexanediol 1,5-hexanediol 1,6- hexanediol 1,5-hexanediol 1,6hexanediol
0.8
1,6- hexanediol
0.6 0.6 0.6 0.4 0.4 0.4 0.2 0.2 0.2 0.0 0.0 0 0.0 0
8
6
0.8 0.8
1,2-pentanediol 1,2-pentanediol 1,2-hexanediol 1,2-pentanediol 1,2-hexanediol 1,5-hexanediol
0
1 1 1
2 2
3 3
4 4
5 5
6
7
6
7
normalized 2 3concentration, 4 5c/CMV 6 normalized concentration, c/CMV normalized concentration, c/CMV (b)
7
(a) (b) (a) (b) Figure 7. Influence of 1,ω-diols concentration expressed in mM (a) and normalized surfactant Figure 7. Influence of 1,ω-diols concentration expressed in mM (a) and normalized surfactant Figure 7. Influence of of 1,ω-diols expressed mM(a)(a) and normalized surfactant Figure 7. Influence 1,ω-diols concentration expressed inin mM and normalized surfactant concentration (c/CMV) (b) on theconcentration normalized terminal bubble velocity. concentration (c/CMV) (b) on the normalized terminal bubble velocity. concentration (c/CMV) (b)(b) ononthe bubblevelocity. velocity. concentration (c/CMV) thenormalized normalized terminal terminal bubble
C4P3
0.4 0.4 0.4 0.2 0.2 0.2 0.0 0.0 10-4 -4 0.010 10-4
10-3 10-3 10-3
10-2 10-1 100 10-2 10-1 100 -2 -1 concentration, mM 10 10 100 concentration, mM concentration, (a)mM
101 101 101
Poly(ethylene glycol) CnEm and poly(propylene glycol) CnPm alkyl ethers Poly(ethylene glycol) CnEm and poly(propylene glycol) CnPm alkyl ethers 1.0 Poly(ethylene glycol) CnEm and poly(propylene glycol) CnPm alkyl ethers 1.0 C1E2 1.0 C1E2 C2E2 C1E2 C2E2 C3E2 0.8 C2E2 C3E2 0.8 C4E2 C3E2 C4E2 0.8 C6E2 C4E2 C6E2 C1P3 C6E2 0.6 C1P3 C3P3 0.6 C1P3 C3P3 0.6 C4P3 C3P3 C4P3 normalized terminal bubble velocity normalized terminal bubble velocity normalized terminal bubble velocity
normalized terminal bubble velocity normalized terminal bubble velocity normalized terminal bubble velocity
Poly(ethylene glycol) CnEm and poly(propylene glycol) CnPm alkyl ethers Poly(ethylene glycol) CnEm and poly(propylene glycol) CnPm alkyl ethers 1.0 Poly(ethylene glycol) CnEm and poly(propylene glycol) CnPm alkyl ethers 1.0 C1E2 1.0 C1E2 C2E2 C1E2 C2E2 C3E2 0.8 C2E2 C3E2 0.8 C4E2 C3E2 C4E2 0.8 C6E2 C4E2 C6E2 C1P3 C6E2 0.6 C1P3 C3P3 0.6 C1P3 C3P3 C4P3 0.6 C3P3 C4P3
C4P3
0.4 0.4 0.4 0.2 0.2 0.2 0.0 0.0 10-2 -2 0.010 10-2
10-1 100 101 10-1 100 101 -1 0 normalized concentration, c/CMV 10 10 101 normalized concentration, c/CMV normalized concentration, c/CMV (b)
102 102 102
(a) (b) (a) (b) Figure 8. Influence of poly(ethylene glycol) and poly(propylene glycol) alkyl ethers concentration Figure 8. Influence of poly(ethylene glycol) and poly(propylene glycol) alkyl ethers concentration Figure 8. Influence of poly(ethylene glycol) and poly(propylene alkyl concentration expressed in mM (a) and normalized surfactant concentrationglycol) (c/CMV) (b)ethers on the normalized expressed in mM and normalized surfactant concentration (c/CMV) (b) onethers the normalized Figure 8. Influence of (a) poly(ethylene glycol) and poly(propylene glycol) alkyl concentration expressed in mM (a) and normalized surfactant concentration (c/CMV) (b) on the normalized terminal bubble velocity. terminal bubble velocity. expressed in mM (a) and normalized surfactant concentration (c/CMV) (b) on the normalized terminal terminal bubble velocity.
bubble velocity.
Minerals 2017, 7, 118
7 of 15
Minerals 2017, 7, 118
7 of 15 others
others 1.0 n-octanoic acid n-octyldimethylphosphine oxide n-octyl ß-D-glucopyranoside C8TAB
0.8
C12TAB C16TAB α-terpineol DF250 F150
0.6
0.4
0.2
0.0 10-7 10-6 10-5 10-4 10-3 10-2 10-1 100 101 102 103
normalized terminal bubble velocity
normalized terminal bubble velocity
1.0
n-octanoic acid n-octyldimethylphosphine oxide n-octyl ß-D-glucopyranoside C8TAB
0.8
C12TAB C16TAB α-terpineol DF250 F150
0.6
0.4
0.2
0.0 10-2
10-1
concentration, mM
100
101
102
103
normalized concentration, c/CMV
(a)
(b)
Figure 9. Influence of n-alkyltrimethylammonium bromides (CnTAB), commercial and other frothers Figure 9. Influence of n-alkyltrimethylammonium bromides (Cn TAB), commercial and other frothers concentration expressed in mM (a) and normalized surfactant concentration (c/CMV) (b) on the concentration expressed in mM (a) and normalized surfactant concentration (c/CMV) (b) on the normalized terminal bubble velocity. normalized terminal bubble velocity. Table1.1.Properties Propertiesof ofsurfactants surfactants used used in in this study. study. Data from aa [3], Table [3], bb [24], [24], cc [25], [25],dd[2], [2],ee[26], [26],f f[1], [1],g source. n/d—not n/d—not determined because because original originaldata datawere were g[19]. [19].Accuracy Accuracyof ofCMV CMV according according to original source. not notavailable. available. Name
Name
Chemical Formulan
Chemical Formula
m
n
Aliphatic alcohols, Cn Aliphatic alcohols, Cn straight alkyl chain straight alkyl chain 1-butanol 3(CH2)3OH 1-butanol CH3 (CHCH 4 - 4 2 )3 OH 3(CH2)4OH 5 1-pentanol 1-pentanol CH3 (CHCH - 5 2 )4 OH 1-hexanol CH3 (CHCH - 6 3(CH2)5OH 6 1-hexanol 2 )5 OH 1-heptanol CH3 (CHCH 7 - 7 2 )6 OH 3(CH2)6OH 1-heptanol 1-octanol CH3 (CH2 )7 OH 8 8 1-octanol CH3(CH2)7OH 1-nonanol CH3 (CH2 )8 OH 9 3(CH2)8OH 1-nonanol CH 2-pentanol CH3 (CH2 )2 CHOHCH3 5 - 9 CHOHCH 2-pentanol CH3(CH2)22CH 3-pentanol CH3 CH2 CHOHCH 53 - 5 3 2-hexanol CH3 (CH 6 3 - 5 CH2CHOHCH 2CH 3-pentanol CH 2 )33CHOHCH 3 3-hexanol CH3 (CH2 )CH 63 - 6 2 CHOHCH 2 CH3 3(CH2)3CHOHCH 2-hexanol 2)2CHOHCH 6 3-hexanol CH3(CH branched alkyl chain2CH3 2-methyl-1-butanol CH3 CH2 CHCH 5 3 CH2 OH branched alkyl chain 2-methyl-2-butanol CH3 CHCH 5 - 5 2 CH 3 COHCH 3 3CH2OH 2-methyl-1-butanol 3CH 2CHCH 3-methyl-1-butanol CH3 CHCH3 (CH2 )2 OH 5 5 2-methyl-2-butanol CH3CH2CH3COHCH3 3-methyl-2-butanol CH3 CHCH3 CHOHCH3 5 3CHCH3(CH2)2OH 3-methyl-1-butanol CH 2-methyl-1-pentanol CH3 (CH2 )2 CHCH3 CH2 OH 6 - 5 3CHCH 3CHOHCH 3-methyl-2-butanol 2-methyl-2-pentanol CH3 (CH2CH )2 CCH 6 3 - 5 3 OHCH 3 2-methyl-3-pentanol CH3 CHCH - 6 3(CH2)2CHCH 2-methyl-1-pentanol 2 CHOHCH(CH 3 )2 3CH26OH 3-methyl-1-pentanol CH3 CH2CH CHCH 6 3 - 6 3 (CH 2 )2 OH 3(CH 2)2CCH 3OHCH 2-methyl-2-pentanol 3-methyl-2-pentanol CH3 CHCH CHOHCH3 6 3)2 - 6 2 CHCH 3CH32CHOHCH(CH 2-methyl-3-pentanol 3-methyl-3-pentanol CH3 CH2 COHCH3 CH2 CH3 6 6 3-methyl-1-pentanol CH3CH2CHCH3(CH2)2OH 4-methyl-1-pentanol (CH3 )2 CH(CH2 )3 OH 6 3CH2CHCH3CHOHCH3 3-methyl-2-pentanol 4-methyl-2-pentanol (MIBC) (CH3 )2CH CHCH 6 - 6 2 CHOHCH3 6 3-methyl-3-pentanol CH3CH2COHCH3CH2CH3 1,ω-diol 2)3OH 6 4-methyl-1-pentanol (CH3)2CH(CH 1,2-butanediol C2 H5 CHOHCH OH 4 2 3)2CHCH 4-methyl-2-pentanol 1,2-pentanediol (MIBC) C3 H7(CH CHOHCH 5 3 - 6 2 OH2CHOHCH 1,2-hexanediol C4 H9 CHOHCH1,ω-diol 6 2 OH 1,5-hexanediol CH3 CHOH(CH 6 - 4 2 )4 OH 1,2-butanediol C2H5CHOHCH 2OH 1,6-hexanediol HO(CH2 )6 OH 6 5 1,2-pentanediol C3H7CHOHCH2OH Poly(ethylene glycol) alkyl2OH ethers, Cn Em 6 1,2-hexanediol C4H9CHOHCH Ethylene glycol monoethyl ether C2 H5 (OC2 H4 )OH 2 1 CHOH(CH2)4OH 1,5-hexanediol CH3H Ethylene glycol monopropyl ether C3 H7 (OC 3 1 6 2 4 )OH Ethylene1,6-hexanediol glycol monobutyl ether C4 H9 (OC2HO(CH H4 )OH 2)6OH 4 1 6 Di(Ethylene glycol) monomethyl ether CH3 (OC2 H4 )glycol) 1 Poly(ethylene alkyl ethers, C2nEm 2 OH Ethylene glycol monoethyl ether C2H5(OC2H4)OH 2 3 Ethylene glycol monopropyl ether C3H7(OC2H4)OH 4 Ethylene glycol monobutyl ether C4H9(OC2H4)OH 1 Di(Ethylene glycol) monomethyl ether CH3(OC2H4)2OH 2 Di(Ethylene glycol) monoethyl ether C2H5(OC2H4)2OH
MW
CMVexp
CMVcalc
MW CMVexp CMVcalc m (g/mol)(g/mol)(mM) (mM) (mM) (mM)
74.12 20 a 74.12 88.15 2.3 a 88.15 102.17 102.17 0.27 a a 116.20 116.20 0.06 130.23 0.013 b 130.23 144.25 0.007 c 144.25 2.65 d 88.15 88.15 3.05 d 88.15 102.17 88.15 0.30 d d 102.17 102.17 0.36 -
102.17
88.15 1.95 d d 88.15 88.15 3.5 d 88.15 1.2 88.15 88.15 3.2 d 102.17 88.15 0.23 d 88.15 0.40 d 102.17 102.17 102.17 0.65 d d 102.17 102.17 0.14 d 102.17 0.37 102.17 102.17 0.60 d 102.17 102.17 0.11 d 102.17 0.4 f 102.17
-
102.17
102.17 20 a 90.12 102.17 1.8 a 104.15 118.17 0.18 a a 118.17 90.12 0.40a 118.17 2.5
104.15 118.17 90.12 20 a 118.17 104.15 6.5 a 118.17 1.1 a 118.17
1.95 d 3.5 d 1.2 d 3.2 d 0.23 d 0.40 d 0.65 d 0.14 d 0.37 d 0.60 d 0.11 d 0.4 f 20 a 1.8 a 0.18 a 0.40 a 2.5 a
25 a
120.15
1 1 1 2 2
20 a 2.3 a 0.27 a 0.06 a 0.013 b 0.007 c 2.65 d 3.05 d 0.30 d 0.36 d
90.12 104.15 118.17 120.15 134.15
24 2.2 0.30 0.05 0.013 0.007 2.75 3.3 0.31 0.32
24 2.2 0.30 0.05 0.013 0.007 2.75 3.3 0.31 0.32
3.0 n/d 1.30 3.0 0.22 n/d n/d 0.05 0.40 0.60 0.05 0.25
3.0 n/d 1.30 3.0 0.22 n/d n/d 0.05 0.40 0.60 n/d 0.05 1.1 0.25 0.11 0.60 2.0
n/d 1.1 0.11 n/d n/d 0.60 n/d 2.0 25
20 a 6.5 a 1.1 a 25 a 10 a
n/d n/d n/d 25 10
Minerals 2017, 7, 118
8 of 15
Table 1. Cont. Name Minerals 2017, 7, 118
n
Chemical Formula
m
MW (g/mol)
CMVexp (mM)
Di(Ethylene glycol) monoethyl ether C2 H5 (OC2 H4 )2 OH 2 2 134.15 10 a a a Di(Ethylene glycol) monopropyl etherether C3 H7 (OCC OH2H4)2OH 3 23 1.81.8 Di(Ethylene glycol) monopropyl 3H 2 148.20 148.20 2H 4 )72(OC a Di(Ethylene glycol) monobutyl ether C H (OC H ) OH 4 2 162.23 0.4 4 9 2 4H 4 92(OC2H4)2OH 4 2 162.23 0.4 a Di(Ethylene glycol) monobutyl ether C a Di(Ethylene glycol) monohexyl etherether C6 H13 (OCC26H OH2H4)2OH 6 26 0.025 a H413)2(OC 2 190.28 190.28 0.025 Di(Ethylene glycol) monohexyl Tri(Ethylene glycol) monomethyl etherether CH3 (OC2CH H4 )33(OC OH2H4)3OH 1 31 7 a7 a 3 164.20 164.20 Tri(Ethylene glycol) monomethyl a Tri(Ethylene glycol) monoethyl ether C2 H5 (OC2 H4 )3 OH 2 3 178.23 1.4 a 2 3 178.23 1.4 Tri(Ethylene glycol) monoethyl ether C2H5(OC2H4)3OH Tri(Ethylene glycol) monobutyl ether C4 H9 (OC2 H4 )3 OH 4 3 206.28 0.08 a a (OC2H4alkyl )3OHethers, C P4 3 206.28 0.08 Tri(Ethylene glycol) monobutyl ether Poly(propylene C4H9glycol) n m Poly(propylene glycol) alkyl ethers, Cn1Pm Propylene glycol propyl ether C3 H7 (OC3 H6 )OH 3 118.17 3a Propylene glycol propyl 3H)OH 1 132.20 118.17 Propylene glycol butyl ether ether C4 H9 (OCC 13 0.5 3a a 3H 6 7(OC3H6)OH 4 a a (OC3H6)OH 1 1 148.20 132.20 Propylene glycol butyl ether Di(propylene glycol) methyl ether CH3 (OC3C H46H)29OH 24 3.50.5 a a Di(propylene glycol) propyl etherether C3 H7 (OC3CH H63)(OC 21 0.143.5 2 176.25 148.20 Di(propylene glycol) methyl 2 OH3H6)2OH 3 a Di(propylene glycol) bytul ether C H (OC H ) OH 4 2 190.28 0.024 4 9 3 3H 6 72(OC3H6)2OH 3 2 176.25 0.14 a Di(propylene glycol) propyl ether C a Tri(propylene glycol) methyl ether CH3 (OC3CH4H OH 3H6)2OH 1 34 0.2 6 )93(OC 2 206.28 190.28 0.024 a Di(propylene glycol) bytul ether a Tri(propylene glycol) propyl etherether C3 H7 (OC3CH H63)(OC 31 0.010.2 3 OH3H6)3OH 3 a 3 234.33 206.28 Tri(propylene glycol) methyl Tri(propylene glycol) bytul ether C4 H9 (OC3 H6 )3 OH 4 3 248.36 0.0014 a a 3 3 234.33 0.01 Tri(propylene glycol) propyl ether C3H7(OC3H6)3OH bromides, Cn TAB 4 3 248.36 0.0014 a Tri(propylene glycol) bytul ether n-alkyltrimethylammonium C4H9(OC3H6)3OH n-octyltrimethylammonium bromide CH3 (CH2 )7 N(CH3 )3 Br 8 29 b n-alkyltrimethylammonium bromides, Cn-TAB 252.24 n-dodecytrimethylammonium bromide ) Br 12 -8 0.4529b b 11 N(CH n-octyltrimethylammonium bromide CH3 (CH2 )CH 3(CH23)73N(CH3)3Br - 308.34 252.24 b n-cetyltrimethylammonium bromide CH (CH ) N(CH ) Br 16 364.45 0.0035 3 2 15 3 3 12 308.34 0.45 b n-dodecytrimethylammonium bromide CH3(CH2)11N(CH3)3Br Commercial frothers 16 364.45 0.0035 b n-cetyltrimethylammonium bromide CH3(CH2)15N(CH3)3Br DF250 CH3 (C3 H6 O)4 OH 1 4 264.35 0.002 f Commercial frothers F150 H(C3 H6 O)7 OH 7 425.00 8 × 10⁻⁵ ff 1 4 264.35 0.002 DF250 CH3(C3H6O)4OH 3H6O)7OH 7 425.00 8 × 10⁻⁵ f F150 H(COthers n-octanoic acid CH3 (CH2 )6 COOH 8 144.21 1.5·× 10−5 g Others n-octyl β-D-glucopyranoside C14 H28 O6 8 292.37 2.0·× 10−5−5g g n-octanoic acid CH3(CH2)6COOH 8 144.21 1.5·× 10 n-octyldimethylphosphine oxide CH3 (CH2 )7 P(O)(CH3 )2 8 190.26 7.5·× 10−6−5g g n-octyl β-D-glucopyranoside C14H28O6 8 292.37 2.0·× 10 α-terpineol C10 H18 O 154.25 0.042 e −6 g 8 190.26 7.5·× 10 n-octyldimethylphosphine oxide CH3(CH2)7P(O)(CH3)2 154.25 0.042 e α-terpineol C10H18O
CMVcalc (mM) 8 of 15 10 1.6 1.6 0.25 0.25 0.020 0.020 n/d n/d n/d n/d n/d n/d n/d n/d n/d n/d n/d n/d n/d n/d n/d 0.15 n/d 0.01 0.15 0.0014 0.01 0.0014 29 0.45 29 0.0035 0.45
0.0035 0.002 8·× 10−5 0.002 8·× 10−5 1.5·× 10−5 g 2.0·× 0−−55gg 1.5·× 10 7.5·× 10−5−g5 g 2.0·× 0 0.042 7.5·× 10−5 g 0.042
A comparison of the experimental data and values predicted in this work for all investigated A comparison of the experimental data and values predicted in this work for all investigated frothers is provided in Figure 10. As seen, the proposed empirical equation (Equation (1)) gives an frothers is provided in Figure 10. As seen, the proposed empirical equation (Equation (1)) gives an excellent fit to the experimental data, with the determination coefficient 2R2 = 0.9985, and a standard excellent fit to the experimental data, with the determination coefficient R = 0.9985, and a standard error error of estimate σest σ=est0.2592, and acceptablefor for surfactants. of estimate = 0.2592, andthus thusisisgenerally generally acceptable allall surfactants. 30
25
calculated CMV, mM
20
15
10 5 4 3 2 1 0
0
1
2
3
4
5 10
15
20
25
30
measured CMV, mM
Figure 10. Comparison of measured and predicted values of CMV for investigated frothers
Figure 10. Comparison of measured and predicted values of CMV for investigated frothers (determination coefficient R2 = 0.9985, standard error of estimate σest = 0.2592). (determination coefficient R2 = 0.9985, standard error of estimate σest = 0.2592).
The proposed empirical model (Equation (1)) can be also used to predict the terminal bubble velocity–concentration curve by knowing the maximum (vmax , in water to ca. 33 ca. 35 cm/s The proposed empirical model (Equation (1)) can be also used equal to predict theand terminal bubble in the McGill and PAS columns, respectively) and minimum (v min, equal to ca. 15) terminal velocities, velocity–concentration curve by knowing the maximum (vmax , in water equal to ca. 33 and ca. 35 cm/s as well as the values of CMV. An example is given for 2-pentanol (Figure 11). As seen from Figure in the McGill and PAS columns, respectively) and minimum (vmin , equal to ca. 15) terminal velocities, 11, the line fits well to the experimental points.
as well as the values of CMV. An example is given for 2-pentanol (Figure 11). As seen from Figure 11, the line fits well to the experimental points.
Minerals 2017, 7, 118
9 of 15
Minerals 2017, 7, 118
9 of 15 35
Minerals 2017, 7, 118
9 of 15 terminal bubble terminalvelocity, bubble cm/s velocity, cm/s
2-pentanol 35 30 experimental predicted
2-pentanol 30 25
experimental predicted
v = vmin + (vmax − vmin ) ⋅ e
25 20
v = vmin + (vmax − vmin ) ⋅ e
20 15 0 15
0
2
4
C − 3 CMV
C − 3 CMV
6
2
2
8
concentration, mM 0
0
2
4
6
8
11. Comparison of measured [2] and predicted (Equation (1)) values of terminal bubble FigureFigure 11. Comparison of measured [2] and predicted (Equation (1)) values of terminal bubble velocity concentration, mM velocity v vs. 2-pentanol concentration. v vs. 2-pentanol concentration. Figure 11. Comparison of measured [2] and predicted (Equation (1)) values of terminal bubble The physicochemical characteristics of surfactants, e.g., the critical micelle concentration velocity v vs. 2-pentanol concentration.
The physicochemical characteristics of surfactants, the criticalatmicelle concentration (CMC), (CMC), the critical coalescence concentration (CCC), thee.g., concentration half of the maximum foam heightcoalescence (CMH) and the concentration(CCC), at the minimum bubble velocity (CMV) strongly depend on the the critical concentration the concentration at half of the maximum foam height The physicochemical characteristics of surfactants, e.g., the critical micelle concentration alkyl chain length [2,3,7,18,27]. Theminimum values of CMC, CCC, CMH and CMVstrongly decreasedepend as the number of (CMH) and the concentration at the bubble velocity (CMV) on the (CMC), the critical coalescence concentration (CCC), the concentration at half of the maximum foamalkyl carbons in the alkyl chain of surfactant increases. In the case of the CMC, the trend is related to the chainheight length(CMH) [2,3,7,18,27]. values of at CMC, CCC, CMH andvelocity CMV decrease as the number of the carbons and the The concentration the minimum bubble (CMV) strongly depend on energy transfer of surface active molecules of frothers from the bulk solution to the micelle, while in chain length [2,3,7,18,27]. The valuesInofthe CMC, CCC, CMH and CMV decrease as the number of in thealkyl alkyl chain of surfactant increases. case of the CMC, the trend is related to the energy the case of the CMV, CCC and CMH, the trend is related to the transfer of surface active molecules of carbons in the active alkyl chain of surfactant increases. thebulk case solution of the CMC, the micelle, trend is related to the the case transfer of surface molecules of frothers fromInthe to the while in frothers from the bulk to the surface [3,7]. transfer of surface active molecules of frothers the bulk solution to themolecules micelle, while in of theenergy CMV, CCC and related the from transfer ofthat surface active of frothers The trends inCMH, Figurethe 12 trend show is a series oftoself-similarities, is consistent patterns (similar the case of the CMV, CCC and CMH, the trend is related to the transfer of surface active molecules of from the bulk to can the be surface [3,7]. slope) that approximated with a simple linear equation lnCMV = −αn + β, where n is the frothers from the bulk to the surface [3,7]. The trends Figurein12 seriesand of self-similarities, is consistent patterns (similar slope) number of in carbons theshow alkylachain, α and β are the that constants that depend on the frothers’ The trends in Figure 12 show a series of self-similarities, that is consistent patterns (similar that can be approximated with a simple linear equation lnCMV − αn + β, where is the number family, as given in Table 2. This empirical equation allows one to=predict the values ofnthe CMV from of slope) that can be approximated with a simple linear equation lnCMV = −αn + β, where n is the thein number of carbons in theαalkyl chain (C n) for aliphatic alcohols, poly(ethylene glycol)family, alkyl ethers carbons theofalkyl chain, and β are the depend on frothers’ as given number carbons in the alkyland chain, and α constants and β are that the constants thatthe depend on the frothers’ (for m = 1, 2 and 3), poly(propylene glycol) alkyl ethers (for m = 1, 2 and 3), in Table 2. This empirical equation allows one to predict of the thevalues CMV of from the number family, as given in Table 2. This empirical equation allows the onevalues to predict the CMV from of n-alkyltrimethylammonium bromides (C nTAB) and 1,2-diols. carbons in the alkyl chainin(Cthe aliphatic poly(ethylene glycol) alkyl ethers (for m = 1, 2 the number of carbons alkyl chain (Cnalcohols, ) for aliphatic alcohols, poly(ethylene glycol) alkyl ethers n ) for (for m = 1, 2 and 3), poly(propylene glycol) alkyl ethers (for m = 1, 2 and 3), and 3), poly(propylene glycol) alkyl ethers (for m = 1, 2 and 3), n-alkyltrimethylammonium bromides 4 n-alkyltrimethylammonium bromides (C n TAB) and 1,2-diols. Cn (Cn TAB) and 1,2-diols. 1,2-diols CnE1 CnE2 CnE3 Cn CnP1 1,2-diols CnP2 CnE1 CnP3 CnE2 CnTAB CnE3 CnP1 CnP2 CnP3 CnTAB
2 4
lnCMV
lnCMV
0 2
-2 0
-4 -2
-6 -4
-8 -6 0
2
4
6
8
10
12
14
16
n -8
2 4of carbons 6 8 12 chain 14 16 Figure 12. The effect of the 0number in10 alkyl (n) on CMV. Solids represent experiments, while lines show linear fitting curves.n
Figure 12. effect The effect the number of carbons alkyl(n) chain (n) onSolids CMV.represent Solids represent Figure 12. The of the of number of carbons in alkylinchain on CMV. experiments, experiments, while lines show linear fitting curves. while lines show linear fitting curves.
Minerals 2017, 7, 118
10 of 15
Minerals 2017, 7, 118
10 of 15
Table 2. Constants in linear trends in relationship between lnCMV and n (Figure 12, lnCMV = −αn + Table 2. Constants in linear trends in relationship between lnCMV and n (Figure 12, lnCMV = −αn + β) that depend on frother family and goodness-of-fit statistics. β) that depend on frother family and goodness-of-fit statistics. Surfactant Family Surfactant Family
α
α
Aliphatic alcohols, Aliphatic alcohols, CC n n Poly(ethylene glycol)alkyl alkylethers, ethers, Poly(ethylene glycol) E mn m CnEC
1.6424 1.6424 1.4505 1.4505 1.4205 1.4205 1.4821 1.4821 1.6535 1.6535 1.6317 1.6317
mm = 1= 1 mm = 2= 2 m=3
m=3 mm = 2= 2 Poly(propylene glycol)alkyl alkyl Poly(propylene glycol) m=3 ethers, C P ethers, CnPmn m m=3 n-alkyltrimethylammoniumbromides, bromides, Cn TAB n-alkyltrimethylammonium 1,2-diols CnTAB 1,2-diols
β
β
9.0449 9.0449 6.0049 6.0049 4.8466 4.8466 3.3770 3.3770 2.9283 2.9283 0.0891 0.0891
1.1278
Determination Determination CoefficientRR22 Coefficient 0.9722 0.9722 0.9834 0.9834 0.9954 0.9954 0.9991 0.9991 0.9995 0.9995 0.9950 0.9950
12.5047
0.9981
1.1278 2.3553 12.5047 12.3992
0.9981 0.9998
2.3553
0.9998
12.3992
Standard Error of Standard Error Estimate σ est σest of Estimate 0.4491 0.4491 0.2664 0.2664 0.2144 0.2144 0.0953
0.0953
0.0824 0.0824 0.2503
0.2503
0.280
0.280
0.0430
0.0430
5. CMV in Relation to Other Frother Characterization Parameters 5. CMV in Relation to Other Frother Characterization Parameters In order to check the relationship between CMV and other frother characterization parameters, In order check the relationship betweentoCMV andcoalescence other frother characterization parameters, the the data from to Table 1 were plotted in relation critical concentration (CCC) (Figure 13) data from Table 1 were plotted in relation to critical coalescence concentration (CCC) (Figure 13) and and dynamic frothability index (DFI) (Figure 14). Figure 13 shows that there is a correlation between dynamic frothability (Figure alcohols, 14). Figure 13 shows thatglycol) there is a correlation between CCC CCC and CMV (both index as ln) (DFI) for aliphatic poly(ethylene and poly(propylene glycol) and CMV (both as ln) for aliphatic alcohols, poly(ethylene glycol) and poly(propylene glycol) alkyl alkyl ethers, which can be approximated to an equation lnCMV = αlnCCC − β, where α and β are ethers, whichthat can be approximated to an equation = αlnCCC where α and β are the constants the constants depend on the frothers’ family,lnCMV as given in Table −3.β,This relationship indicates that thatimpact depend the frothers’ family, as and giventype in Table 3. This indicates that thethe impact the ofon surfactant concentration is similar forrelationship both terminal velocity and shapeof surfactant of bubbles.concentration and type is similar for both terminal velocity and the shape of bubbles. Aliphatic alcohols, Cn Poly(ethylene glycol) alkyl ethers, CnEm Poly(propylene glycol) alkyl ethers, CnPm
0
lnCMV
-1
-2
-3
-4
-8
-6
-4
-2
0
2
4
lnCCC
Figure between lnCMH and lnCCC surfactants. Solids represent Figure13.13.Relationship Relationship between lnCMH and lnCCC 95 for nonionic tested nonionic surfactants. Solids 95 for tested the experimental point (data: CMV CCC [18,28]), represent curves. represent the experimental point Table (data:1,CMV Table 1, while CCC lines [18,28]), whilelinear lines fitting represent linear
fitting curves. Table 3. Constants in linear trends in the relationship between lnCMV and lnCCC (Figure 13, lnCMV = αlnCCC − β) that depend on frother family and goodness-of-fit statistics. Table 3. Constants in linear trends in the relationship between lnCMV and lnCCC (Figure 13, lnCMV = αlnCCC − β) that depend on frother family and goodness-of-fit statistics. Surfactant
α
Surfactant Aliphatic alcohols, Cn
α 0.4594
Poly(ethylene glycol) C alkyl Aliphatic alcohols, n ethers,glycol) Cn Em alkyl Poly(ethylene Poly(propylene alkyl ethers, Cnglycol) Em ethers, Cn Pm Poly(propylene glycol) alkyl ethers, CnPm
β
Data Points, N
β1.5232 Data Points, 8 N
0.4594 0.3026
1.5232 1.6329
8 11
0.3026
1.6329
11
0.2486
0.2486
1.8593
1.8593
Determination 0.9742 R2 Coefficient 0.9742 0.7640 0.7640
8
8
Determination Coefficient R2
0.9193
0.9193
Standard Error of Estimate σ est
Standard Error of0.4194 Estimate σest 0.4194 0.3951 0.3951 0.2183
0.2183
As discussed before by Laskowski [29], the DFI-CCC diagram can be used to classify frothers into selective and powerful. Selective frothers recover useful fine particles, while powerful frothers
Minerals 2017, 7, 118
11 of 15
As discussed before by Laskowski [29], the DFI-CCC diagram can be used to classify frothers into selective and powerful. Selective frothers recover useful fine particles, while powerful frothers float coarse particles. The powerful frothers have high values of DFI and low CCC, while selective ones have low values of DFI and high CCC. Since there is a correlation between CCC and CMV (Figure 13), Minerals 11 Minerals 2017, 2017, 7, 7, 118 118 11 of of 15 15 by analogy the same attempt can be made to create the DFI–CMV diagram. Such an example is shown float particles.alcohols The powerful values of DFI and CCC, selective in Figure 14 coarse for aliphatic for n frothers from 4 have to 8. high It can be clearly seenlow that thewhile foaming properties ones have of DFI and high in CCC. is (n). a correlation CCC and highly depend onlow thevalues number of carbons theSince alkylthere chain As seenbetween from Figure 15a,CMV the values 13), by analogy the same attempt can be made to create the DFI–CMV diagram. Such an of CMC(Figure decrease (as discussed before), while the DFI increases with the increase in the number of example is shown in Figure 14 for aliphatic alcohols for n from 4 to 8. It can be clearly seen that the carbonsfoaming in the alkyl chain. It means that the DFI is inversely proportional to CMV. When the same properties highly depend on the number of carbons in the alkyl chain (n). As seen from data areFigure plotted in the form of of CMC 1/DFI and CMV versus (n), as shown in Figure 15b, itwith can the be clearly 15a, the values decrease (as discussed before), while the DFI increases seen that the trend generic. This new diagram canItbe usedthat to classify powerful and increase in theisnumber of carbons in the alkyl chain. means the DFI isfrothers inverselyinto proportional CMV.on When same data are plotted in the form of 1/DFI and CMV versus (n), as shown in with selectivetobased the the number of carbons in the alkyl chain (n). The frother selectivity decreases Figure can be clearly seen that selective the trend is generic. This1-butanol new diagram usedthe to classify the increase in15b, the italkyl chain. The most seems to be (n =can 4), be while less selective, frothers into powerful and selective based on the number of carbons in the alkyl chain (n). The and thus the most powerful, is n-octanol (n = 8). The same classification can be made for any other frother selectivity decreases with the increase in the alkyl chain. The most selective seems to be flotation1-butanol frothers(nutilizing their foaming properties. = 4), while the less selective, and thus the most powerful, is n-octanol (n = 8). The same Table 4 shows can thatbe(i) thefor frother characterization CMV, CCC and CMH, can classification made any other flotation frothersparameters, utilizing theire.g., foaming properties. Table 4 shows (i) the frother characterization parameters, CMV, andand CMH,CMV can beas well be easily determined bythat empirical equations proposed in thise.g., work forCCC CCC easily determined by the empirical equations in this work for CCC and CMV as terminal well as for bubble as for CMH [7], and (ii) equations canproposed be successfully used to predict the CMH [7], and (ii) the equations can be successfully used to predict the terminal bubble velocity– velocity–concentration, bubble shape–concentration and foam height–concentration curves by knowing concentration, bubble shape–concentration and foam height–concentration curves by knowing the the maximum and minimum values of either bubble velocities and shapes or foam height, as well as maximum and minimum values of either bubble velocities and shapes or foam height, as well as the the values of CMV, CCC values of CMV, CCCand andCMH. CMH. 3 80x10 80x103
1-octanol 1-octanol
DFI,s/M s/M DFI,
3 60x10 60x103
1-heptanol 1-heptanol
3 40x10 40x103
1-hexanol 1-hexanol
3 20x10 20x103
1-pentanol 1-pentanol 1-butanol 1-butanol 00
00
-3 5x10 5x10⁻³
-3 10x10 10x10-3
-3 15x10 15x10-3
-3 20x10 20x10-3
-3 25x10 25x10-3
CMV, CMV, M M
Figure 14. Relationship between dynamic frothability index (DFI) and CMV values for aliphatic
Figure 14. Relationship between dynamic frothability index (DFI) and CMV values for aliphatic alcohols (data: CMV Table 1, DFI [30]). alcohols (data: CMV Table 1, DFI [30]). 100.00 100.00
CMV, CMV, mM mM DFI, DFI, s/mM s/mM
100.00 100.00
1.0 1.0
selective selective
1/DFI,mM/s mM/s 1/DFI,
1.00 1.00
10 10
10.00 10.00
CMV,mM mM CMV,
DFI,s/mM s/mM DFI,
10.00 10.00
1.00 1.00
0.1 0.1
0.10 0.10
11
22
33
44
55
66
nn
(a)
77
88
99
0.01 0.01
CMV,mM mM CMV,
100 100
0.10 0.10
0.0 0.0
powerful powerful
CMV, CMV, mM mM DFI, DFI, s/mM s/mM 22
33
44
55
66
77
88
99
0.01 0.01
nn
(b)
Figure 15. Effect of the number of carbons in the alkyl chain (n) of aliphatic alcohols on CMV and
Figure 15. Effect ofand theCMV number in CMV the alkyl DFI: (a) DFI vs. n;of (b)carbons 1/DFI and vs n. chain (n) of aliphatic alcohols on CMV and DFI: (a) DFI and CMV vs. n; (b) 1/DFI and CMV vs n.
Minerals 2017, 7, 118
12 of 15
Minerals 2017, 7, 118
12 of 15
Table 4. Frother characterization parameters CMV, CCC and CMH (data: 1-pentanol [2], DF250 [18], C4P32017, [7]). Minerals 7, 118 12 of 15 12 of 15 Minerals 2017, 7,2017, 118 7, 118 Minerals 12 of 15
Table 4. Frother characterization parameters CMV, CCC and CMH (data: 1-pentanol [2], DF250 [18], CMV CCC Table 4. Frother parameters CMV, CCC and CMHand (data: 1-pentanol [2], 1-pentanol DF250[2], [18], Table 4.characterization Frother characterization parameters CMV, CCC CMH (data: (data: 1-pentanol DF250 [18], [18], Table 4. Frother characterization parameters CMV, CCC and CMH [2], CMH DF250 C4 P3 [7]). C4P3 [7]). C4P3 [7]). 4P3 [7]). concentration at the C minimum bubble
velocity CMV CMV
concentration at half of the maximum
critical coalescence concentration CCC
CMV CMV
foam CMHCMH CMH
CMH
CCC CCC CCC
height
concentration at the minimum bubble concentration at half of the maximum concentration at thevminimum bubblebubble concentration at half of the maximum concentration at the minimum concentration half of the maximum maximum bubble velocity, bubble size, dconcentration foam height, h concentration atat half of the concentration criticalcoalescence coalescence concentration critical coalescence concentration at the minimum bubble velocity critical coalescence critical concentration velocity velocity foam height foamfoam height velocity foamheight height ( /
=
)
velocity, bubblevbubble velocity, v +bubble ( velocity, − velocity, v bubble v )·e
( /
bubble size, =bubble size, +bubble (d bubble − dd size, )·ed size,
) foam height, h height, h foam =foam + ( height, −h
)e
foam height, h
1-pentanol
predicted
v = vmin + (vmax − vmin )v⋅ e= v 25
20
15
15
3.0
3.0
−3( c / CCC ) )⋅ e + (v v = − vvmin min + (vmax − vmin ) ⋅ e −3( c / CCC )2
25
20
2
2.5
2.0
1.5
0
0
0
2
0
2
0
2.0
3.0
experimental predicted
2.5
2.0
experimental predicted
−3(c / CCC )
2.5
2.0
8
12
6
24
8
46
0.5 0.00 8
68
0.02
0.5 0.04 0.00
6
6
concentration, mM
6
C4P3
predicted experimental
−1
predicted experimental
predicted experimental
−1
4
3
4
2
3
min
4
(
−1
max
min
−1
) ⋅ e 2(c / CMH )
3
2
2 0.08 0.04 0.02
0.10 0.06 0.04
0.08 0.06
0.10 0.08
0.5 concentration, mM concentration, mM concentration, mM 0.00 0.02 0.04 0.06 0.08
concentration, mM concentration, mM concentration, mM 4 6 8
C4P3
predicted experimental
3 / CMH ) (c / CMH ) h = hmin + (hmax − hmin h) ⋅ = e 2h(cmin + (hmax h⋅ e(=h2max h − hmin + )h⋅ e 2(c / CMH − h) h =− hhmin min )+
2
1.0
0.5 0.06 0.02 0.00
C4P3 C4P3
8 8
1.0 6
02
12
10
8
4
1.5
1.0
14
12
10
+ (d max ) ⋅ (ed max − d min ) ⋅ e −3(c / CCC ) d =− ddmin min +
−3(c / CCC ) min
1.5
14
10
experimental predicted 10
d = d min + (d max − d min ) ⋅ e −3(c / CCC )
d = d min + (d max − d mind) ⋅=e d
2.5
1.0
15
4
0
3.0
1.5
15 0
3.5
DF250
experimental DF250 12 predicted
foam height, cm
predicted 2
−3( c / CCC )2 min max
DF250 3.5
bubble size, mm
20
predicted
30
v = vmin + (vmax − vmin ) ⋅ e −3(c / CCC )
bubble size, mm
25
terminal bubble velocity, cm/s
terminal bubble velocity, cm/s
25
20
30
14
4.0
foam height, cm
3.5 experimental
4.0
foam height, cm
experimental
predicted
3.5
foam height, cm
1-pentanol
bubble size, mm
1-pentanol
bubble size, mm
experimental 1-pentanol experimental
30
)
1 ) 2(c/CMH)3
DF250
4.0
35
30 terminal bubble velocity, cm/s
terminal bubble velocity, cm/s
35
( /
( / − )e )( /
)( / )+ (= ) = (= −= )·e+−− ( )·e+− )·e −3( (/c/CCC (3( (/c/CMV ))·e − )2 ( /)·e = ((d/ ))− )·e= ) ( /) +) (= 14( )e+ −(( / − + d = dmin + −=+ (d(max 4.0 v = v 35min + (+v max − v+min ); e − min ; e h =− h=min + (hmax −)eh min )e 35
0 0.00 0.10
0 0.00
0.05
0 0.10 0.00 0.05
0.15 0.05 0.10
0.15 0.10
0.15
0 concentration, mM concentration, mM concentration, mM 0.10 0.00 0.05
0.10
0.15
concentration, mM
concentration, mM
6. Influence of Parameters onParameters Flotation 6. Influence of Characterization Frother Characterization Parameters on Flotation 6. Frother Influence of Frother Characterization on Flotation
6. Influence of Frother Characterization Parameters on Flotation 6. Influence of Frother Characterization Parameters onsurfactant Flotation Many authors haveauthors investigated the influence of surfactant type andtype concentration on the on the Many authors have have investigated the influence of and concentration Many investigated the influence of surfactant type and concentration on the flotation performance (e.g., [7,9,31–41]). An example involving coalinvolving flotation is shown Figure flotation performance (e.g., (e.g., [7,9,31–41]). An example coal type flotation isinshown in16. Figure 16.on16.the Many authors have investigated the influence of involving surfactant and concentration flotation performance [7,9,31–41]). An example coal flotation is shown in Figure Many authors have the ofmaterial surfactant type and concentration the Malysa et al. [9]etshowed that plotting, forAn aplotting, given and aliphatic alcohols family frothers Malysa al. [9]al.showed that plotting, forinfluence amaterial given material and aliphatic alcohols family frothers Malysa et [9]investigated showed that for ainvolving given and aliphatic alcohols family frotherson flotation performance (e.g., [7,9,31–41]). example coal flotation is shown in Figure 16. flotation performance (e.g., [7,9,31–41]). An example involving coal flotation is shown in Figure 16. (e.g., 1-butanol, 1-pentanol, 1-hexanol), the maximum recovery of coal versus a product of dynamic (e.g., (e.g., 1-butanol, 1-pentanol, 1-hexanol), the maximum recovery of coal versus a product of dynamic 1-butanol, 1-pentanol, 1-hexanol), the maximum recovery of coal versus a product of dynamic Malysa et al. [9] showed that plotting, for a given material and aliphatic alcohols family frothers foamability index (DFI) and frother concentration c, provided all the curves converging into one foamability index (DFI) and frother concentration c, provided all the curves converging into one foamability index (DFI) and frother concentration c, provided all the curves converging into one Malysa et al. [9] showed that plotting, for a given material and aliphatic alcohols family frothers (e.g., 1-butanol, 1-pentanol, 1-hexanol), single universal plotuniversal (Figure 16). single universal plot (Figure 16). the single (Figure 16). maximum recovery of coal versus a product of dynamic (e.g., 1-butanol, 1-pentanol,plot 1-hexanol), the maximum recovery of coal versus a product of dynamic foamability index (DFI) and frother concentration c, provided all the curves converging into one single foamability index (DFI) and frother concentration c, provided all the curves converging into one universal plot (Figure 16). single universal plot (Figure 16). 80
40 20
0
0
40
recovery, %
40
20
0
20
0
1e-3 0
0
2e-3 1e-3
1e-3
3e-3 2e-3
1-butanol 1-butanol 1-pentanol1-pentanol 1-hexanol 1-hexanol 2e-3
3e-3
concentration,concentration, M M concentration, M
100
100
80
80
60 40
0
3e-3
1
1-butanol 1-pentanol 1-hexanol 1e-3
(a)
(a)
2e-3
(a)
0
100
80
80
40
0
0
40
5
0
40 25 15
45 30 20
c.DFI
35 25
1-butanol 1-pentanol 1-hexanol
40 30
45 35
40
3
1-butanol 1-pentanol 1-hexanol 1-butanol 1-pentanol 1-hexanol
020 0
1
45
c.DFI
60
5 04
100 c/CMV
2
10 15
15 26
3
1-butanol 1-butanol 1-pentanol 1-pentanol 1-hexanol 1-hexanol
20 37
4
c/CMV
25
. 5c DFI 6 4
30 5
7
35 6
40
45
7
c/CMV
100 80
60 40
20
0
35 20 10
40
0
80
60
30 15 5
1-butanol 1-pentanol 1-hexanol
40 80 20
40
100
60
0 25 10 0
c.DFI 60 100
60
1-butanol 1-pentanol
40
1-butanol 1-pentanol 1-hexanol
20 20 0 10
0
0 50 15 0 c/CCC
1
105 20
2 c/CCC
1-butanol 1-pentanol 1-hexanol
15 10 25
3 c/CCC
20 15
4
1-butanol1-hexanol 1-pentanol 1-hexanol 25 20
5
25
6
7
c/CMV
100
(b)
3e-3
80
recovery, %
0
60
2
1-butanol 1-pentanol 1-hexanol
40
80 20 5
20
0
60
100 20
0 15 0
10
20
20
0
5
20
1-butanol 1-pentanol 1-hexanol 0
0
recovery, %
60 20
40
60
recovery, %
40
60
recovery, %
recovery, %
80
recovery, %
recovery, %
60
40 20
recovery, %
100
60
recovery, %
60
recovery, %
100
80
recovery, %
80
100
80
recovery, %
80
100
recovery, %
80
100
recovery, %
100
recovery, %
100
(b)
(b)
concentration, M Figure 16. Flotation recovery of coal asofacoal function of frother expressed in M; Figure 16. Flotation recovery a function of (a)concentration concentration expressed in M;in M; Figure 16. Flotation recovery of as coal as (a) a function offrother (a) 60frother concentration expressed and (b) products of (b) c·DFI, c/CMV c/CCC (data of c/CCC recovery andofDFI from [9]). and (b) products of c·DFI, c/CMV and c/CCC (data of recovery and40DFI and products ofand c·DFI, c/CMV and (data recovery andfrom DFI [9]). from [9]). 20
1-butanol 1-pentanol 1-hexanol
This generic trendgeneric indicates thatindicates flotation recoveries were thewere same conditions ofconditions This This generic trendtrend indicates that flotation recoveries theunder same underunder conditions of of that flotation recoveries were the same 0 0 5 10 15 20 25 identicalidentical aliphatic alcohols family frothers expressed asexpressed DFI·casand same aliphatic alcohols family frothers expressed DFI·c and thehydrodynamic same hydrodynamic identical aliphatic alcohols family frothers asthe DFI·c and the same hydrodynamic c/CCC conditions. Comparable results can beresults obtained when thewhen flotation results are plotted theplotted form ofinform conditions. Comparable results can be obtained the flotation results are in plotted in the of of conditions. Comparable can be obtained when the flotation results are the form flotationflotation recovery versus frother concentration in relation toineither (c/CCC) or (c/CCC) recovery versus normalized frother concentration in relation toCCC either CCC CCC (c/CCC) or or flotation recovery versus normalized frother concentration relation to either (a)normalized (b) CMV (c/CMV) (Figure 16). A(Figure similar pattern was recently presented by presented Kowalczuk al. [7] et foral.the CMVCMV (c/CMV) (Figure 16). A16). similar pattern was recently presented by Kowalczuk [7]al. for[7]the (c/CMV) A similar pattern was recently byetKowalczuk et for the Figure Flotation recovery of short coal aoffunction of (a) frother concentration expressed in M; flotation of16. quartz thequartz presence of chain alkyl where the normalized flotation of in quartz in thein presence ofas short chainamines, alkyl amines, where the normalized frother flotation of the presence short chain alkyl amines, where the frother normalized frother
Figure 16. Flotation recovery of coal as a function of (a) frother concentration expressed in M; and (b) and (b) products of c·DFI, c/CMV and c/CCC (data of recovery and DFI from [9]). products of c·DFI, c/CMV and c/CCC (data of recovery and DFI from [9]).
This generic trend indicates that flotation recoveries were the same under conditions of This generic trend indicates flotation recoveries were the identical identical aliphatic alcohols that family frothers expressed as same DFI·c under and conditions the same of hydrodynamic aliphatic alcohols family frothers expressed as DFI ·c and sameresults hydrodynamic conditions. Comparable results can be obtained when the the flotation are plottedconditions. in the form of Comparable results can be obtained when the flotation results are plotted in the form of flotation recovery versus normalized frother concentration in relation to either CCCflotation (c/CCC) or recovery normalized frother concentration relation to either CCC by (c/CCC) or CMV (c/CMV) CMVversus (c/CMV) (Figure 16). A similar pattern in was recently presented Kowalczuk et al. [7] for the (Figure 16). A of similar pattern waspresence recently of presented by Kowalczuk et al. [7] for the of quartz flotation quartz in the short chain alkyl amines, where theflotation normalized frother
Minerals 2017, 7, 118
13 of 15
in the presence of short chain alkyl amines, where the normalized frother concentration was presented in the form of c/CHM (concentration at half of the maximum foam height CMH). It proves that all frothers exhibit almost the same foaming behaviours but at different concentrations, expressed as either DFI, CCC, CMV, CMH or any other frother characterization parameter. 7. Conclusions Based on an analysis of the literature and experimental data for surfactants used as flotation frothers, the following conclusions can be drawn. (a)
(b)
(c)
(d)
The newly obtained empirical equation allows one to rapidly and accurately determine a concentration at the minimum bubble velocity (CMV), as a characterization parameter for different types of frothers, such as straight and branched alkyl chain aliphatic alcohols, 1,ω-diols, poly(propylene glycol) and poly(ethylene glycol) alkyl ethers, n-alkyltrimethylammonium bromides, commercial frothers and others. An excellent agreement was observed between the determined and experimental values. The proposed empirical model can also be used to predict the terminal bubble velocity–frother concentration curve by knowing the maximum and minimum terminal velocities, as well as the values of the CMV. This approach is universal under similar experimental conditions and can be also extended for the prediction of bubble size when the minimum and maximum bubble sizes, as well as CCC value, are known. There is a strong correlation between the CMV, the DFI and the number of carbons in the alkyl chain (n). This correlation allows one to determine these parameters, but also to classify frothers as selective and powerful. The assessment and usefulness of frother characterization parameters, e.g., CMV, DFI and CCC, were shown in the flotation of coal.
Acknowledgments: The work was partially financed by the Polish Statutory Research Grant (No. 0401/0121/16). Author Contributions: Przemyslaw B. Kowalczuk analyzed the data; Przemyslaw B. Kowalczuk, Jan Zawala and Jan Drzymala wrote the paper. Conflicts of Interest: The authors declare no conflict of interest.
References 1. 2. 3. 4. 5. 6. 7. 8. 9.
Tan, Y.H.; Rafiei, A.A.; Elmahdy, A.; Finch, J.A. Bubble size, gas holdup and bubble velocity profile of some alcohols and commercial frothers. Int. J. Miner. Process. 2013, 119, 1–5. [CrossRef] Tan, Y.H.; Finch, J.A. Frother structure–property relationship: Effect of hydroxyl position in alcohols on bubble rise velocity. Miner. Eng. 2016, 92, 1–8. [CrossRef] Tan, Y.H.; Finch, J.A. Frother structure–property relationship: Effect of alkyl chain length in alcohols and polyglycols ethers on bubble rise velocity. Miner. Eng. 2016, 95, 14–20. [CrossRef] Cho, Y.S.; Laskowski, J.S. Effect of flotation frothers on bubble size and foam stability. Int. J. Miner. Process. 2002, 64, 69–80. [CrossRef] Zhang, W.; Nesset, J.E.; Rao, R.; Finch, J.A. Characterizing frothers through critical coalescence concentration (CCC) 95-hydrophile-lipophile balance (HLB) relationship. Minerals 2012, 2, 208–227. [CrossRef] Kowalczuk, P.B. Determination of critical coalescence concentration and bubble size for surfactants used as flotation frothers. Ind. Eng. Chem. Res. 2013, 52, 11752–11757. [CrossRef] Kowalczuk, P.B.; Siedlarz, M.; Szczerkowska, S.; Wojcik, M. Facile determination of foamability index of non-ionic and cationic frothers and its effect on flotation of quartz. Sep. Sci. Technol. 2017, 1–9. [CrossRef] Czarnecki, J.; Malysa, K.; Pomianowski, A. Dynamic frothability index. J. Colloid Interface Sci. 1982, 86, 570–572. [CrossRef] Malysa, E.; Malysa, K.; Czarnecki, J. A method of comparison of the frothing and collecting properties of frothers. Colloids Surf. 1987, 23, 29–39. [CrossRef]
Minerals 2017, 7, 118
10. 11. 12.
13. 14. 15. 16. 17. 18. 19. 20. 21. 22. 23.
24.
25. 26.
27. 28. 29. 30.
31. 32.
33.
14 of 15
Khoshdast, H.; Mirshekari, S.; Zahab-Nazouri, A. A model for predicting dynamic frothability index for dual-frother blends. J. Min. Environ. 2015, 6, 119–124. [CrossRef] Malysa, K.; Krasowska, M.; Krzan, M. Influence of surface active substances on bubble motion and collision with various interfaces. Adv. Colloid Interface Sci. 2005, 114 115, 205–225. [CrossRef] [PubMed] Zawala, J.; Malysa, E.; Krzan, M.; Malysa, K. Monitoring of contamination of coal processing plants and environmental waters using bubble velocity measurements—Advantages and limitations. Physicochem. Probl. Miner. Process. 2014, 50, 143–157. [CrossRef] Frumkin, A.; Levich, V. On surfactants and interfacial motion. Zhur. Fiz. Khim. 1947, 21, 1183–1204. Fuerstenau, D.W.; Wayman, C.H. Effect of chemical reagents on the motion of single air bubbles in water. Trans. AIME 1958, 211, 694–699. Clift, R.; Grace, J.R.; Weber, M.E. Bubbles, Drops and Particles; Academic Press: Cambridge, MA, USA, 1978. Zhou, Z.A.; Egiebor, N.O.; Plitt, L.R. Frother effect on single bubble motion in a water column. Can. Metall. Q. 1992, 31, 11–16. [CrossRef] Sam, A.; Gomez, C.O.; Finch, J.A. Axial velocity profiles of single bubbles in water/frother solutions. Int. J. Miner. Process. 1996, 47, 177–196. [CrossRef] Zhang, W.; Sam, A.; Finch, J.A. Temperature effect on single bubble velocity profile in water and surfactant solution. Colloids Surf. A Physicochem. Eng. Asp. 2003, 223, 45–54. [CrossRef] Krzan, M.; Lunkenheimer, K.; Malysa, K. On the influence of the surfactant’s polar group on the local and terminal velocities of bubbles. Colloids Surf. A Physicochem. Eng. Asp. 2004, 250, 431–441. [CrossRef] Alves, S.S.; Orvalho, S.P.; Vasconcelos, J.M.T. Effect of bubble contamination on rise velocity and mass transfer. Chem. Eng. Sci. 2005, 60, 1–9. [CrossRef] Krzan, M.; Malysa, K. Influence of solution pH and electrolyte presence on bubble velocity in anionic surfactant solutions. Physicochem. Probl. Miner. Process. 2009, 43, 43–58. Javor, Z.; Schreithofer, N.; Heiskanen, K. The effect of bubble release techniques on their behavior at the initial stages of rise. Miner. Eng. 2012, 36, 254–261. [CrossRef] Varadaraj, R.; Bock, J.; Valint, P. Jr.; Zushma, S.; Thomas, R. Fundamental interfacial properties of alkyl-branched sulfate and ethoxy sulfate surfactants derived from Guerbet alcohols. 1. Surface and instantaneous interfacial tensions. J. Phys. Chem. 1991, 95, 1671–1676. [CrossRef] Krzan, M.; Zawala, J.; Malysa, K. Development of steady state adsorption distribution over interface of a bubble rising in solutions of n-alkanols (C5, C8) and n-alkyltrimethylammonium bromides (C8, C12, C16). Colloids Surf. A Physicochem. Eng. Asp. 2007, 298, 42–51. [CrossRef] Krzan, M.; Malysa, K. Profiles of local velocities of bubbles in n-butanol, n-hexanol and n-nonanol solutions. Colloids Surf. A Physicochem. Eng. Asp. 2004, 207, 279–291. [CrossRef] Kosior, D.; Zawala, J.; Krasowska, M.; Malysa, K. Influence of n-octanol and a-terpineol on thin film stability and bubble attachment to hydrophobic surface. Phys. Chem. Chem. Phys. 2013, 15, 2586–2595. [CrossRef] [PubMed] Klevens, H. Structure and aggregation in dilate solution of surface active agents. J. Am. Oil Chem. Soc. 1953, 30, 74–80. [CrossRef] Finch, J.A.; Zhang, W. Frother function-structure relationship: Dependence of CCC95 on HLB and the H-ratio. Miner. Eng. 2014, 61, 1–8. [CrossRef] Laskowski, J.S. Testing flotation frothers. Physicochem. Probl. Miner. Process. 2004, 38, 13–22. Sweet, C.; van Hoogstraten, J.; Harris, M.; Laskowski, J.S. The effect of frothers on bubble size and frothability of aqueous solutions. In Processing of Complex Ores: Proceedings of the Second UBC-McGill Bi-Annual International Symposium on Fundamentals of Mineral Processing and the Environment, Sudbury, Ontario, 17–19 August 1997; Finch, J.A., Rao, S.R., Holubec, I., Eds.; Canadian Institute of Mining, Metallurgy and Petroleum: Montreal, QC, Canada, 1997; pp. 235–245. Mukai, S.; Wakamatsu, T.; Takahashi, K. Mutual interaction between collectors and frothers in flotation. Mem. Fac. Eng. Kyoto Univ. 1972, 34, 279–288. Kurniawan, A.U.; Ozdemir, O.; Nguyen, A.V.; Ofori, P.; Firth, B. Flotation of coal particles in MgCl2 , NaCl, and NaClO3 solutions in the absence and presence of Dowfroth 250. Int. J. Miner. Process. 2011, 98, 137–144. [CrossRef] Laskowski, J.S.; Castro, S.; Ramos, O. Effect of sea water main components on frothability in the flotation of Cu-Mo sulphide ore. Physicochem. Probl. Miner. Process. 2013, 50, 17–29. [CrossRef]
Minerals 2017, 7, 118
34. 35. 36. 37. 38. 39. 40. 41.
15 of 15
Karlkvist, T.; Patra, A.; Rao, K.H.; Bordes, R.; Holmberg, K. Flotation selectivity of novel alkyl dicarboxylate reagents for apatite–calcite separation. J. Colloid Interface Sci. 2015, 445, 40–47. [CrossRef] [PubMed] Moimane, T.M.; Corin, K.C.; Wiese, J.G. Investigation of the interactive effects of the reagent suite in froth flotation of a Merensky ore. Miner. Eng. 2016, 96, 39–45. [CrossRef] Park, H.; Wang, J.; Wang, L. A comparative study of methyl cyclohexanemethanol and methyl isobutyl carbinol as frother for coal flotation. Int. J. Miner. Process. 2016, 155, 32–44. [CrossRef] Drzymala, J.; Ratajczak, T.; Kowalczuk, P.B. Kinetic separation curves based on process rate considerations. Physicochem. Probl. Miner. Process. 2017, 53, 983–995. [CrossRef] Kowalczuk, P.B.; Drzymala, J. Selectivity and power of frothers in copper ore flotation. Physicochem. Probl. Miner. Process. 2017, 53, 515–523. [CrossRef] Sousa, R.; Futuro, A.; Setas Pires, C.; Machado Leite, M. Froth flotation of Aljustrel sulphide complex ore. Physicochem. Probl. Miner. Process. 2017, 53, 758–769. [CrossRef] Sun, K.; Liu, T.; Zhang, Y.; Liu, X.; Wang, B.; Xu, C. Application and mechanism of anionic collector sodium dodecyl sulfate (SDS) in phosphate beneficiation. Minerals 2017, 7, 29. [CrossRef] Kowalczuk, P.B.; Mroczko, D.; Drzymala, J. Influence of frother type and dose on collectorless flotation of copper-bearing shale in a flotation column. Physicochem. Probl. Miner. Process. 2015, 51, 547–558. [CrossRef] © 2017 by the authors. Licensee MDPI, Basel, Switzerland. This article is an open access article distributed under the terms and conditions of the Creative Commons Attribution (CC BY) license (http://creativecommons.org/licenses/by/4.0/).