Modeling the Effect of Environmental Parameters (Temperature, pH & aw) on the Individual Cell Lag Phase of Listeria monocytogenes
1
K. Francois1, F. Devlieghere1, K. Smet1, A.R. Standaert2, A.H. Geeraerd2, J.F. Van Impe2 and J. Debevere1 Laboratory of Food Microbiology and Food Preservation, Department of Food Technology and Nutrition, Ghent University, Coupure Links 653, B-9000 Ghent, Belgium. 2 BioTeC – Bioprocess Technology and Control, Department of Chemical Engineering, Katholieke Universiteit Leuven, W. de Croylaan 46, B-3001 Leuven, Belgium. Correspondence to
[email protected]
Introduction Until now, the lag phase of microorganisms has mostly been investigated on population level, using high inoculum levels. In reality, however, foods are often contaminated with low numbers of food pathogens. Robinson et al., (2001) observed that the variability of the lag phase of Listeria monocytogenes increased when a lower inoculum level was applied and, when dealing with the same inoculum level, an increase in variation was observed when more salt stress was applied. These observations were confirmed by Metris et al. (2002) when investigating the effect of salt stress and acid stress on lag time distributions of isolated L. monocytogenes cells. Therefore, when dealing with realistic low inoculum levels of L. monocytogenes, a high variability can be expected in the population lag phase, especially when severe stress conditions are applied. An individual cell approach is therefore needed to adequately quantify these distributions. The effect of temperature and pH on the individual lag phase of L. monocytogenes was previously described by Francois et al. (2004a). The objectives of this contribution are (i) to extend the current relationships including aw data, and (ii) a recalculation of the previous datasets using an adjusted calibration curve (OD-cfu/ml) for each set of environmental conditions, according to recent findings describing the effect of environmental parameters on the calibration curve of L. monocytogenes (Francois et al., 2004b). The resulting distributions, describing the individual cell lag phase as a function of environmental conditions, can be modeled and will be used in the framework of risk assessment concerning L. monocytogenes.
Material and methods Strains and culture conditions L. monocytogenes was used as a test organism. Strains were subcultured twice in BHI (Oxoid ltd., Basingstoke, Hampshire, England) for 24h at 30°C and stored on TSA slants (Oxoid ltd., Basingstoke, Hampshire, England) grown for 24h at 30°C and stored at 7°C. Calibration Curve The protocol described by Francois et al. (2003) was used to create the calibration curves for 19 different combinations of temperature, pH and aw. A modelling approach is used to describe the intermediate calibration curves (Francois et al., 2004b). Data collection The procedure of Francois et al. (2003) was applied to obtain single L. monocytogenes cells in the wells of a microtiter plate, combining a high probability of having single cells, with a sufficient yield. Growth data were collected using optical density (OD) measurements at 600 nm using a Versamax microplate reader. Growth was investigated by means of a factorial design with 5 different incubation temperatures (30°C, 10°C, 7°C, 4°C and 2°C) combined with 6 different pH levels (pH 7.4 (pure BHI), 6.0; 5.5; 5.0; 4.7 and 4.4) and 3 aw levels (0.995; 0.97 and 0.95). The pH of the BHI was modified using a 32% HCl solution (Merck
Eurolab, Leuven, Belgium), while the aw was lowered adding NaCl (Merck Eurolab, Leuven, Belgium). For each set of conditions, about 100 individual cell lag phases were determined. Determination of the lag phase and generation time of single cells At regular time intervals, OD @ 600 nm was measured as a function of time. Using the appropriate calibration curve, OD values were recalculated as cell densities (adapted from Stephens et al., 1997). The three phase linear model was used to calculate the growth rate and the individual cell lag phase as described in Francois et al. (2004a). The results were visualised using histograms (SPSS 11.0, Chicago, Illinois, USA). Distributions are fitted to the data using @RISK 4.5.2 Professional edition (Palisade Corporation, Newfield, NY, USA).
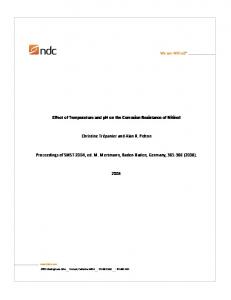
Results and discussion For all performed experiments, generation times and individual lag phases (λind) were calculated using the linear extrapolation method. High adjusted correlation factors were obtained for the linear regression (0.99 – 0.98). When environmental conditions become more stressful, the lag phase increases exponentially, e.g., for BHI (pH 7.4) the mean individual lag time at 2°C is about 900h whereas at 4 and 7°C it is 40h and 8.35h respectively. These trends are comparable for different types of environmental stress. When stress levels are increasing, the distribution describing the individual cell lag phases of L. monocytogenes is shifting to the right (longer lag time) and becomes broader (increasing variability). An extreme example can be seen at 2°C were the mean individual lag shifts up to about 900h with a standard deviation of around 90h. These tendencies are also observed when focussing on pH stress. Especially at pH 5.5 and 0,10 lower, very broad, flat distributions can be seen. In a next step, distributions, which will be further 0,08 used to develop a predictive model, were fitted to 0,06 the data. Using @Risk 37 different distribution types were tested to fit to the data. Previous results 0,04 showed that the Gamma distribution was preferred at a moderate stress level, while the Weibull 0,02 distribution could be used at higher stress levels 0,00 (see Fig. 1). Data are currently reprocessed with 0 20 40 60 80 100 120 140 160 Individual cell lag time (h) regard to the appropriate calibration curves Figure 1. Distributions fitted to the histograms of the determined in Francois et al. (2004b). These results individual cell lag phases of L. monocytogenes cultivated will learn if these two distribution types can be at 7°C in pH-adjusted BHI. confirmed. The final distribution parameters will be used to create a model, able to predict the distribution of the individual cell lag phase for a given set of conditions. This information will contribute to perform a thorough, knowledgebased risk assessment for L. monocytogenes at realistic low contaminating cell levels. Probability
pH 7,4 Gammaplot pH 7,4 pH 6,1 Weibullplot pH 6,1 pH 5,5 Weibullplot pH 5,5
References Francois, K., Devlieghere, F. Smet, K., Standaert, A.R., Geeraerd, A.H., Van Impe, J.F. and Debevere, J. (2004a). Modelling the individual cell lag phase: effect of temperature and pH on the individual cell lag distribution of Listeria monocytogenes. International Journal of Food Microbiology. Accepted for publication. Francois, K., Devlieghere, F., Standaert, A.R., Geeraerd, A.H., Van Impe, J.F. and Debevere, J. (2003). Modelling the individual cell lag phase. Isolating single cells: Protocol development. Letters in Applied Microbiology, 37, 26-30. Francois, K., Devlieghere, F., Standaert, A.R., Geeraerd, A.H., Van Impe, J.F. and Debevere, J. (2004b). Effect of environmental factors on the calibration curve (optical density @ 600 nm – cfu/ml) of Listeria monocytogenes. Submitted for publication. Stephens, P.J., Joynson, J.A., Davies, K.W., Holbrook, R., Lappin-Scott, H.M. and Humphrey, T.J. (1997). The use of an automated growth analyzer to measure recovery times of single heat-injured Salmonella cells. Journal of Applied Microbiology, 83, 445-455. Metris, A., George, S., Peck, M. and Baranyi, J. (2002). Effect of sodium chloride and pH on the distribution of the lag times of individual cells of Listeria Innocua. Conference proceedings 7ème journées Européennes Agro-industrie et méthodes statistiques Lille january 2002. Robinson, T.P., Aboaba, O.O., Ocio, M.J., Baranyi, J. and Mackey, B.M. (2001) The effect of inoculum size on the lag phase of L. monocytogenes. International Journal of Food Microbiology 70, 163 – 173.