(ii) presented in three metrical contexts (no meter, duple and triple meter), using (iii) an ... refer to these two theories as meter induction models (see Footnote 1). 2. ... note onsets (i.e. three inter-onset intervals or IOIs) adding up to a total duration of one ... These rhythms can be represented in a three dimensional space (see.
Modeling the Effect of Meter in Rhythmic Categorization: ∗ Preliminary Results∗ Peter Desain1 and Henkjan Honing1,2
Music, Mind, Machine Group1 NICI, University of Nijmegen P.O. Box 9104, 6500 HE Nijmegen The Netherlands Music Department2 University of Amsterdam Spuistraat 134, 1012 VB Amsterdam The Netherlands
Running Title: Rhythmic Categories and Meter
Revision, submitted February 11, 2002 Short Report for JMPC
Address correspondence to: Peter Desain & Henkjan Honing NICI, University of Nijmegen P.O. Box 9104, 6500 HE Nijmegen The Netherlands ∗ Both authors contributed equally to this work. For an appendix containing all experimental data, audio examples and animations, see www.nici.kun.nl/mmm/time.html.
Rhythmic Categories and Meter 2
Abstract
This paper is a report of ongoing research on categorical rhythm perception and the influence of context. It concerns the mapping of the continuous space of performed temporal patterns to the discrete, symbolic space of rhythmic categories. And, whether this mapping is influenced by the metrical context in which the temporal patterns are presented. While the empirical results are described elsewhere, this paper focuses on the predictions made by two existing models of meter induction. Their low explanatory value is interpreted as evidence for a possible dissociation between the processes of categorization and meter induction.
Keywords Rhythm Perception, Categorization, Categorical Perception, Metric priming, Meter, Computational Modeling.
Rhythmic Categories and Meter 3
1. Introduction This paper is a report of ongoing research on categorical rhythm perception and the influence of context. In a series of experiments we investigated which rhythmic categories are identified in a large set of temporal patterns presented on a continuous scale, and how they are influenced by the context in which they are presented (Desain, Jansen & Honing, 2000). We will restrict us here to a brief overview of the empirical results (described elsewhere), focusing on modeling the effect of metrical context in studying two existing models of meter induction and their predictions; For details on the experimental design and an elaborate description of the empirical data the reader is referred to Desain & Honing (submitted). The central question in this research is concerned with the cognitive process which enables listeners to arrive at a symbolic representation from an expressive performance, a transformation of a temporal pattern from a continuous scale to a discrete one. This is investigated by studying the mapping of the continuous space of performed temporal patterns to the discrete, symbolic space of rhythmic categories. More importantly, we studied whether this mapping is influenced by the metrical context in which these temporal patterns are presented. This metrical context is manipulated by dividing the empty bar that precedes the temporal pattern (without-meter condition), in two or three equal beats (duple and triple meter condition). The question of categorization has been addressed in a relatively small number of studies on categorical rhythm perception (Clarke, 1987; Schulze, 1989). And indeed, for a few special cases a sharp transitional boundary between rhythmic categories was found:
Rhythmic Categories and Meter 4 the identification function had a steep change in slope at the boundary, the discrimination function a strong peak in the same position, both evidence for categorical perception (Harnad, 1987). With regard to the question of the influence of meter, Clarke (1987) presented evidence that meter (a hierarchical subdivision of the preceding context in two or three equal beats) has an effect on categorization. He showed that the position of the boundary between rhythmic categories shifts depending on the metrical context in which the rhythm was presented. In that study (as in Schulze, 1989), however, only few categories were investigated. In this study, we therefore use (i) all possible patterns of four note onsets and a fixed total duration (sampled on a fine temporal grid) as stimuli, (ii) presented in three metrical contexts (no meter, duple and triple meter), using (iii) an identification task with semi-open responses. Furthermore, because previous research showed that meter plays an important role in the recognition, coding, and reproduction of rhythm (Povel & Essens, 1985; Parncutt, 1994), we will investigate a possible relation between the process of meter induction and categorization, basing ourselves on two existing models (Povel & Essens, 1985; LonguetHiggins & Lee, 1984) already proven to be successful in modeling meter induction proper (Essens, 1995; Lee, 1991; Desain & Honing, 1999). It is noteworthy in this respect that all these models, with the sole exception of Longuet-Higgins (1976), assume the availability of categorized input data without further motivation (they do not consider performed rhythms, i.e. rhythms with expressive timing variation, as used in this study). Theories of meter perception predict an easier identification, coding and recall for rhythmic patterns that are metrical (a notion that is, however, defined differently in the various models). Using the definition that metrical rhythms are those patterns that contain
Rhythmic Categories and Meter 5 subjective accents that align with a beat or clock (Povel & Essens, 1985) or minimize syncopation (Longuet-Higgins & Lee, 1984), it can be hypothesized that temporal patterns that are in accordance with the metrical context in which they are presented (i.e. they induce the same meter) are more easily identified, priming the responses. We will refer to these two theories as meter induction models (see Footnote 1).
2. Materials and Methods (see Footnote 2) 2.1. Participants. Eleven participants took part in the experiment. All participants were highly trained professional musicians or advanced conservatory students. They had between 7 and 17 years of musical training and were paid for their participation.
2.2. Apparatus. The sounds were presented through headphones (Sennheiser HD 445) on a Yamaha MU90R synthesizer using General MIDI percussion sounds, “low bongo” to indicate the meter and “high woodblock” for the rhythm. The participants could adjust the loudness of the stimuli to a comfortable listening level. It was driven by the POCO system (Honing, 1990; Desain & Honing, 1992) via the OMS MIDI driver, running on an Apple Macintosh G3.
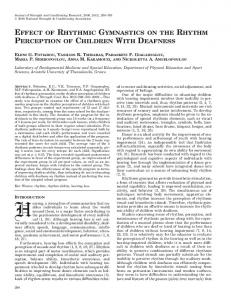
Rhythmic Categories and Meter 6 2.3. Stimulus Construction. The stimuli used in the experiment are a subset of all temporal patterns made up of four note onsets (i.e. three inter-onset intervals or IOIs) adding up to a total duration of one second (the sounding duration of the notes is not manipulated but kept constant). This set contains musical and unmusical rhythms, and covers, in principle, all possible expressive interpretations. These rhythms can be represented in a three dimensional space (see Figure 1, Panel A), with the three axes representing the three inter-onset intervals. All the patterns that add up to a total duration of one second form an equilateral triangle in such a space, which can be presented as a ternary plot (see Figure 1, Panel B). Since in principle the set is of infinite size, it is sampled by considering only those patterns on a temporal grid of 1/19th of a second (about 0.053 s) with a minimum duration of three time grid units (3/19th, about 0.158 s) to stay in the range of musical note durations. The choice of a prime unit prevents the induction of a fine metrical subdivision by the sampling itself. This sampling balances the size of the stimulus set with a fine enough resolution to still have a good sampling of the continuous space of all possible performed rhythms. The resulting total of 66 stimulus patterns (the black dots in Figure 1, Panel D) were embedded in a metrical context. The two metrical conditions were created by filling the preceding empty bar by a subdivision in two (duple condition) or three (triple condition) beats of equal length, marked by a “low bongo” percussion sound.
Rhythmic Categories and Meter 7
A
B
0.50
A
Int e
s)→
0.50
0
A
0.25 Inte
rva
l2
(s)
→
3(
rva l
al
B
e
Int
0.25
0.75
erv
l rva
→ s) 1 ( 3
1( s) →
1
0
Int
Interval 1 (s) →
1
1
0.75
B
1
0 1
0.75
0.50
0.25
0
← Interval 2 (s) D
C
1
s)
• • • • • • 0.50 • • • • 0.50 • • • • • • • • • • • • • • • • • • • • • • • • • • 0.75 0.25 • • • • • • • • • • • • • • • • • • • • • • • • • • • • • •
0.75 1
0
0.25 0.50
erv Int
1
Time (s) →
→
[0.25, 0.25, 0.50]
s)
B:
3(
al
al
0.25
erv
0
0.25
0.75
Int
→
[0.25, 0.50, 0.25]
1(
A:
0
1
0 1
0.75
0.50
0.25
0
← Interval 2 (s)
Figure 1. Performance space (Panel A), ternary plot (Panel B), two example patterns (Panel C), and a sampling of the space (Panel D). The triangular slice in Panel A represents the patterns of three time intervals and of one second total duration. This slice is shown as a ternary plot in Panel B. The grid lines in this representation are to be
Rhythmic Categories and Meter 8
interpreted following the direction of the tick marks along the axes. As an example, two rhythms are marked in the space and shown as time-line diagrams and as IOIs (between square brackets) in Panel C. The space can be probed, selecting a finite set of stimuli: the sampling used in our experiments is indicated in Panel D.
2.4. Response. For the identification task, a specially designed computer interface was used on which rhythms in common music notation (CMN) could be entered. It allowed for a large set of time signatures, notes and rests (ranging from a whole to a 32th duration), dots, ties, and grouping in duplets, triplets and quintuplets. While, in principle, categorization is still forced, it enables notations with a granularity much finer than the differences between stimuli (see Footnote 3).
2.5. Procedure. The participants performed an identification task in which they had to notate (using the computer interface described above) the presented stimulus. The presentation of the stimuli and entering of the responses was self-paced, but each complete stimulus (i.e. three repetitions of the rhythm embedded in a metrical context) could only be listened to once. The stimuli were presented in random order, blocked by context condition. The control condition was presented first, followed by the duple and triple condition, the latter presented in random order. Participants were instructed to think of the stimulus as if played by a percussionist, and to notate the score they thought most likely used by the
Rhythmic Categories and Meter 9 percussionist, to prevent them from obsessively trying to write out expressive timing. This task was familiar to the participants, part of the standard solfège training at the music conservatory. The task took about two hours to complete, including short breaks.
2.6. Data Preparation and Visualization. All responses (i.e. music notations) were converted to integer representation, with several music notation variants leading to the same integer representation. In total there were 158 different responses over all three conditions, but only 112 of those were used more than once. Response proportions (distribution of responses) were calculated for each stimulus. Maximal response proportions (i.e. the most often chosen response for a certain stimulus) were identified as rhythmic categories. The location of the boundaries between these areas were estimated as the position of the intersection of the linear interpolations of proportions of the maximally chosen response. In between stimuli. 90% confidence limits were approximated. All data were visualized as ternary plots using JMP (version 3.2.2 by SAS).
2.7. Regression Analyses. Two models, a mental clock model (Povel & Essens, 1985) and a model of syncopation (Longuet-Higgins & Lee, 1984), were tested to see to what extent they could explain the change in response proportions for a certain rhythm between the duple and triple condition. The mental clock model (Povel & Essens, 1985) produces a measure (named “counter evidence”) of the amount of negative evidence for a certain clock given a
Rhythmic Categories and Meter 10 rhythmic pattern defined on a temporal grid. We took a 24-point temporal grid. (85% of the response categories can be described on such a grid; i.e. the responses that can be expressed as multiples of 1/24 of the bar duration) and calculated the negative evidence for a duple and a triple clock for all responses. The difference in response proportions in the two metrical contexts was linearly regressed against these two factors. R2, adjusted for the number of parameters, is reported as measure of the explained proportion of the variance. The second model is the Longuet-Higgins & Lee (1984) measure of syncopation strength, indicating the amount of syncopation of a rhythmic pattern given a certain metrical interpretation. The syncopation strength was calculated for all possible duple and triple meters that could accommodate the responses. The minima of these measures (grouped into duple and triple meters) were taken as the two factors in a linear regression analysis.
3. Results 3.1. Identification of Rhythmic Categories We will first look more closely at the identification of the rhythmic categories: which categories are formed and where they are located. We consider all stimuli that attract the same response rhythm significantly more often than any other rhythm as belonging to the same category.(see Footnote 4). Figure 2a shows the resulting categories for the control (no meter) condition. Rhythmic categories are indicated with grayscales(see Footnote 5) and italic numbers (their music notation and integer representations are shown in the legend), with darker
Rhythmic Categories and Meter 11 shades indicating a higher proportion of participants who identified it (darkest shade marks 100% agreement among participants). In the white areas there is less than 90% statistical confidence that there is one rhythmic category identified more often or, in other words, in a replication of this experiment the boundaries could fall in the white areas in 90% of the cases.
A
In
0.8
0.2
0.4
7
4
10
← Interval 2 (s)
0.6
1
3
11
0.6
0.2
0.4 →
2
5
6
8
0.2 In s) 3(
→
0.4
0.6
0.8
l
l
va ter
ter va
Figure 2a.
1( s)
No Meter (N=11)
0.8
10 11 12
9
8
7
3 4 5 6
1 2
1-1-1 1-2-1 2-1-1 1-1-2 2-3-1 4-3-1 3-1-2 4-1-1 1-3-2 3-1-4 1-1-4 2-1-3
Rhythms:
CCC CBC BCC CCB C C« D B C« C C« DC B DD DC« C C« DB DDB C DC«
Rhythmic Categories and Meter 12
In
0.8
0.2
0.4
4
10
← Interval 2 (s)
0.6
1
3
7
0.6
0.2
0.4 →
2
5
6
8
0.2
s) 3(
→
0.4
0.6
0.8
In
l
B
l
va r e t
ter va
Figure 2b.
1( s)
Duple Meter (N=11)
0.8
12
10 11
9
8
7
3 4 5 6
1 2
1-1-1 1-2-1 2-1-1 1-1-2 2-3-1 4-3-1 3-1-2 4-1-1 1-3-2 3-1-4 1-1-4 2-1-3
Rhythms:
CCC CBC BCC CCB C C« D B C« C C« DC B DD DC« C C« DB DDB C DC« Rhythmic Categories and Meter 13
C
In 0.8
0.4
← Interval 2 (s)
0.6
9
1
7 12
0.6
0.2
11
0.4 →
0.2
5
3
8
0.2
s) 3(
→ 0.4
0.6
0.8
In
l
l
va r e t
ter va
Figure 2c.
1( s)
Triple Meter (N=11)
0.8
12
10 11
9
8
7
3 4 5 6
1 2
1-1-1 1-2-1 2-1-1 1-1-2 2-3-1 4-3-1 3-1-2 4-1-1 1-3-2 3-1-4 1-1-4 2-1-3
Rhythms:
CCC CBC BCC CCB C C« D B C« C C« DC B DD DC« C C« DB DDB C DC« Rhythmic Categories and Meter 14
Rhythmic Categories and Meter 15
Figure 2. Time clumping maps: the effect of duple (Panel B) and triple (Panel C) meter as compared to the no meter condition (Panel A). Note the slight growth of the areas around simple rhythms like 1-1-2 and 1-2-1 in the duple meter condition, and their complete disappearance in the triple meter condition. (See www.nici.kun.nl/mmm/time.html for a color version of this graph, and an animation showing the changing categories.)
3.2. Effect of Meter The next question we will address is whether the presence of a meter influences rhythmic identification. A meter can be defined as consisting of at least two levels of temporal structuring, e.g., a bar subdivided in two or three equal beats (Martin, 1972). This subdivision can extend to several levels forming a metrical tree. In this study we focus only on the topmost two levels of metrical structure. This was studied by presenting the same rhythmic patterns preceded by a bar subdivided in two or three equal beats (duple and triple meter, respectively). Figure 2 presents the empirical results as a time clumping map, showing the maximal response proportions in the three context conditions. Response proportions in the no meter condition (Figure 2a) still correlate quite highly (.94) with the responses in the duple meter condition (Figure 2b). This is as expected, based on the more common duple interpretation of rhythms (Longuet-Higgins, 1976). But behavior in the triple meter condition (Figure 2c) is quite different from the no meter condition (correlation .70) and even more different from the duple meter condition (correlation .53) (see Footnote 6). The effect of meter is so large that it completely changes the tiling of the rhythm space. Some simple rhythmic categories which were
Rhythmic Categories and Meter 16 identified quite often in the without meter condition, and which are even more salient in the context of a duple meter, disappear completely in triple meter. To give an example: the stimulus which is perceived most differently in the two meters is [.210 .474 .316] (in seconds) (see Footnote 7). In duple meter it is heard mostly as 1-2-1 (64% of the responses; with 10% identifying it as 1-3-2), in triple meter it is interpreted mostly as 1-3-2 (36% of the responses, not one identifying it as 1-2-1). So, in summary, there is a strong effect of meter on rhythmic identification.
3.3. Modeling the Effect of Meter We investigated two alternative explanations. The first is a mental clock-model that predicts easier identification of rhythms that are compatible with a beat or clock induced by the previous material. Povel & Essens (1985) describe such a model that calculates the negative evidence for a certain clock given a rhythmic pattern. Besides onsets it takes subjective accentuation into account (i.e. the first and last onset of a run of notes, and the second of a group of two are perceived as accented, and more likely to induce a beat in that position). Linearly regressing the difference in response proportions between the two metrical conditions against the theoretical counter-evidence for a duple and triple clock, the model explains just 7% of the variance (see Footnote 8). Only one factor, the counterevidence for a triple clock subdividing the bar did contribute significantly to the prediction of a lower proportion of responses in that condition. An alternative to the Povel & Essens model is the meter induction theory proposed by Longuet-Higgins & Lee (1984). It defines the amount of syncopation for a
Rhythmic Categories and Meter 17 specific rhythm in a specific meter, and one can argue that the meter which minimizes syncopation is chosen as the preferred interpretation. This measure was also not very successful in explaining the shift in responses between the two metric conditions as a linear combination of the syncopation strength for duple and triple meter. Only 12% of the variance was explained. However, in this case both factors contributed significantly. Being unable to show much success for the models in predicting the size of the change, we proceeded to test the predicted direction of the effect. A positive effect indicating that a response was given more often in a triple condition , a negative effect indicating it was more often used in a duple condition, and zero change meaning that there was no effect of context on the number of times a certain response was given. As it turned out, for 55% of the responses Povel & Essens’ model predicts the correct direction of the shift between proportions of that response in the duple and the triple meter. Longuet-Higgins & Lee’s model does so even for 71% of the responses, again taking only responses that are compatible with a 24-point temporal grid into account. Thus, though the prediction of the size of the metric priming effect was rather poor for both models, the direction of the effect seems to be captured more satisfactory. In summary, the two meter induction models, though successful in explaining the direction of the change in response proportion in the duple and triple meter conditions, could explain only very little of the size of the change in the response proportions themselves. In this assessment we use the models “in reverse”: instead of assigning a beat to a categorized rhythmic input, we assume that during categorization the beat that would
Rhythmic Categories and Meter 18 later be assigned to a candidate is already accessible and causes a response bias, favoring the choice that is compatible with the pre-established meter.
4. Discussion Although in a previous study (Clarke, 1987) an effect of meter on the position of the category boundary was observed, that study was restricted to a few rhythmic patterns. In this investigation, we show the effect for a systematic set of temporal patterns and their clumping into rhythmic categories. The results for the different metrical contexts were subsequently interpreted as a large and robust effect of metric priming. Thus rhythmic categorization depends on a pre-established cognitive framework of time structuring, a main finding of this investigation. The effect of priming can be partly explained on the basis of the rhythmic structure of the responses: i.e. where note onsets fall on points of a metrical grid. This is in accordance with theories that stress the importance of the role of meter in the mental representation of rhythm (Longuet-Higgins, 1976; Povel & Essens, 1985), sometimes even so far as to state that rhythm only exists under metric interpretation.
Rhythmic Categories and Meter 19
Meter-induction
Meter-induction
Categorization
Categorization
Figure 3. Integration (left panel) vs. modularity (right panel) of categorization and meter induction. The arrows indicate the processing of time-intervals. In the left alternative categorization and meter-induction are inter-twinned and make use of the same input, while in the right alternative first the interval is categorized and only then available for meter induction. In turn, its output is available for interpreting new incoming time intervals.
One might take the rather poor results of the theories of meter perception –which were quite successful in other settings (as cited before)–, in backwardly predicting a metric priming effect for each candidate rhythm in a categorization task, as support for a dissociation between the early process of rhythmic categorization and the later process of inferring a metrical structure. The earlier categorization phase is open to influence from pre-induced meter (i.e. meter induced by the preceding material), as is shown by the change in response proportions, but its metric interpretation only becomes accessible after beat induction. Thus, we argue, rhythmic categorization and beat induction may not
Rhythmic Categories and Meter 20 be an integrated interactive process, but rather constitute two sequential modular processes (see Figure 3) in which first rhythmic categories are formed, on the basis of which a beat or meter is induced, which only then can influence the categorization of new incoming material. This agrees with another meter induction model by Longuet-Higgins (1976; 1979) which, while categorizing, grafts a representation of musical rhythm onto the framework of a pre-established meter. Thus, meter clearly does not play an allexplaining role in rhythm identification, which may suggest that other aspects of rhythm, such as expressive timing (Clarke, 1999), figural coding (Handel, 1993), or rhythmic structure (Desain & Honing, 1991; 1992), remain worthy of investigation.
References
Clarke, E. F. (1987). Categorical rhythm perception: an ecological perspective. In A. Gabrielsson (Ed.): Action and Perception in Rhythm and Music, Royal Swedish Academy of Music, 55, 19-33. Clarke, E.F. (1999). Rhythm and Timing in Music. In D. Deutsch (Ed.), Psychology of Music, 2nd (pp. 473-500). New York: Academic Press. Desain, P. & Honing, H. (submitted). The Perception of Time: The Formation of Rhythmic Categories and Metric Priming. Desain, P. & Honing, H. (1991). Quantization of musical time: a connectionist approach. In P.M. Todd,. & D.G. Loy, (Eds.) Music and Connectionism (pp. 150-167). Cambridge: MIT Press.
Rhythmic Categories and Meter 21
Desain, P. & Honing, H. (1992) Music, Mind and Machine: Studies in Computer Music, Music Cognition and Artificial Intelligence. Amsterdam: Thesis Publishers. Desain, P. and Honing, H. (1999) Computational Models of Beat Induction: The RuleBased Approach. Journal of New Music Research, 28(1), 29-42. Desain, P., Jansen, C., and Honing, H. (2000) How identification of rhythmic categories depends on tempo and meter. In Proceedings of the Sixth International Conference on Music Perception and Cognition Keele, UK: Keele University, Department of Psychology. CD-ROM. Essens, P. (1995). Structuring Temporal Sequences: Comparison of Models and Factors of Complexity. Perception & Psychophysics. 57(4), 519-532. Handel, S. (1993). The effect of tempo and tone duration on rhythm discrimination. Perception & Psychophysics, 54(3), 370-382. Harnad, S. (1987). Categorical Perception. The Groundwork of Cognition Cambridge: Cambridge University Press. Honing, H. (1990). POCO: an environment for analysing, modifying, and generating expression in music. In Proceedings of the 1990 International Computer Music Conference. 364-368. San Francisco: Computer Music Association. Lee, C. S. (1991). The perception of metrical structure: Experimental evidence and a model. In P. Howell, R. West, & I. Cross (Eds.), Representing musical structure . 59-127. London: Academic. Longuet-Higgins, H. C. (1976). The perception of melodies. Nature, 263, 646-653. (Reprinted in Longuet-Higgins, 1987)
Rhythmic Categories and Meter 22
Longuet-Higgins, H.C. & Lee, C.S. (1984). The rhythmic interpretation of monophonic music. Music Perception, 1(4), 424—441. (Reprinted in Longuet-Higgins, 1987) Longuet-Higgins, H.C. (1979). The perception of music. Proceedings of the Royal Society of London. B 205, 307-322. (Reprinted in Longuet-Higgins, 1987) Longuet-Higgins, H.C. (1987). Mental Processes. Cambridge, Mass.:MIT Press. Martin, J. G. (1972) Rhythmic (hierarchic) versus serial structure in speech and other behaviour. Psychological Review, 79, 487-509. Parncutt, R. (1994). A perceptual model of pulse salience and metrical accent in musical rhythms. Music Perception, 11, 409-464. Povel, D.J. & Essens, P. (1985). Perception of temporal patterns. Music Perception, 2(4):411-440. Schulze, H.H. (1989). Categorical perception of rhythmic patterns. Psychological Research, 51, 10-15.
Rhythmic Categories and Meter 23
Acknowledgements
This research was funded by the Netherlands Organization for Scientific Research (NWO). Support was also provided by the Canon Foundation. Experiments were conducted by Rinus Aarts, Chris Jansen and Maki Sadakata, at the Nijmegen Institute for Cognition and information (NICI) and at Kyoto City University of the Arts, Japan.
Rhythmic Categories and Meter 24
Footnotes 1 But note that Longuet-Higgins & Lee(1984) was not primarily conceived as such. 2 For details on methods and materials used the reader is referred to Desain & Honing (submitted). 3 It supports a large set of different rhythmic patterns which can be reduced, in our case, to about ten thousand classes, each represented by a unique integer sequence (e.g., 1-2-1) representing the ratios between the time intervals. 4 A check for an increased discrimination sensitivity around the category boundaries that are identified in our experiment will be left as subject for future research. 5 See www.nici.kun.nl/mmm/time.html for a color version of this Figure. Here we have to restrict ourselves to a version that is a gray scale conversion, loosing much detailed information. 6 All differences between the reported correlations are significant (p