MODELING THE IMPACT OF FRAME RATE ON PERCEPTUAL QUALITY OF VIDEO Yen-Fu Ou, Tao Liu, Zhi Zhao, Zhan Ma, Yao Wang Department of Electrical and Computer Engineering, Polytechnic University, Brooklyn, NY 11201 Emails: {you01, tliu02, zzhao04, zma03}@students.poly.edu,
[email protected] ABSTRACT This study aims to understand how perceived quality of a video varies as the frame rate changes. We find that an inverted falling exponential function can accurately reflect the trend observed from subjective testing. We further explore the relationship between the falling rate and the video content features, such as frame difference, motion, and contrast. Index Terms— Video quality metrics, frame rate 1. INTRODUCTION Development of objective quality metrics that can automatically and accuratly measure perceptual video quality is becoming more and more important as video applications become pervasive. Prior work in video quality assessment is mainly concerned with applications where the frame rate of the video is fixed. The objective quality metric compares each pair of corresponding frames in deriving a similarity score or distortion between two videos with the same frame rate. In many emerging applications targeting for heterogeneous users with different display devices and/or different communication links, the same video content may be delivered with varying frame rate or frame size (assuming the video is coded into a scalable stream with spatial/temporal scalability). In applications permitting only very low bit rate video, one often has to determine whether to code an original high frame-rate video at the same frame rate but with significant quantization, or to code it at a lower frame with less quantization. In all proceeding scenarios as well as many others, it is important being able to objectively quantify the degradation in perceived quality of a video when the frame rate is reduced. There have been several works studying the impact of frame rate on perceptual video quality. In a recent review of frame rate effect on human perception of video [1], it is found that frame rate around 15 Hz seems to be a threshold of humans’ satisfaction level, but the exact acceptable frame rate varies depending on video content, underlying application, and the viewers. In addition, the authors of [2] proposed that the preferred frame rate decreases as video bandThis work is supported in part by the National Science Foundation under Grant No. 0430145, and by the Joint Research Fund for Overseas Chinese Young Scholars of National Natural Science Foundation of China under grant No. 60528004.
width decreases, and two switching bandwidths corresponding to the preferred frame rates were derived. The work in [3] investigated the preferred frame rate for different types of video. In [4], a particular high-motion type of coded video sequences (sports game) was explored. It was found that high spatial quality is more preferable than high frame rate for small screens. The work in [5, 6] considered the dependency of the perceptual quality of encoded video on PSNR, frame rate and video motion speed. Specifically, [6] considered the impact of the frame rate alone on uncoded video sequences. However, the model in [6] requires several parameters, which limits the applicability of the model. We conduct subjective tests to evaluate how frame rate influences the perceived video quality. Results of our subjective tests suggest that, for a variety of video, the perceptual quality decreases with the frame rate in an inverted exponential falling trend. The falling rate is video content dependent. Based on these results, we propose a single-parameter model relating the perceived quality with the frame rate, assuming the perceptual quality at a high frame rate is known (which can be estimated using conventional methods for comparing two videos at the same frame rate). The rest of the paper is organized as follows. Section 2 presents the configuration and the subjective test results. Section 3 describes the proposed model and verifies its accuracy. Section 4 explores the relation between the model parameter with the video content including frame difference, motion and contrast. Finally we conclude the paper and discuss the future work. 2. SUBJECTIVE QUALITY MEASUREMENT To obtain subjective ratings of video at different frame rates, and to explore the influence of video content and video resolution on the visual sensitivity to frame rate, we chose six video clips with a variety of scene content from the standard test sequence pool: Mobile, Football, Tempete, City, Bus, and Akiyo, all in both CIF (352×288) and QCIF (176×144) resolutions, originally 30 frames/sec (fps), each 10 seconds long. These sequences range widely from slow motion to sports highlights. We downsampled each 30 fps video into lower frame rates 15, 10, 7.5 and 6, without any temporal filtering. This leads to a total of 30 test sequences for each resolution. The videos are displayed in their native resolution
Football
100
100
80
80
Subjective score
Subjective score
Mobile
60
40 subjective score (CIF) model curve subjective score (QCIF) model curve
20
0 0
5
10
15
20
25
60
40 subjective score (CIF) model curve subjective score (QCIF) model curve
20
0 0
30
5
10
100
100
80
80
60
40 subjective score (CIF) model curve subjective score (QCIF) model curve
20
0 0
5
10
15
20
25
0 0
30
5
10
Subjective score
80
60
40 subjective score (CIF) model curve subjective score (QCIF) model curve 15
20
15
20
25
30
Frame rate(fps) Akiyo
80
10
30
subjective score (CIF) model curve subjective score (QCIF) model curve
20
100
5
25
40
100
0 0
20
60
Frame rate(fps) Bus
20
15
Frame rate(fps) City
Subjective score
Subjective score
Frame rate(fps) Tempete
Subjective score
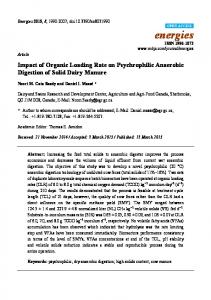
in the center of a 14.1’ LCD monitor with 1280×800 pixels. The video are displayed in their actual frame rates without temporal interpolation, so that a frame is simply held longer when displaying a lower frame rate video. Each subjective test consists of two sessions, a training session and a test session. The training session is used for the subject to accustom him/herself to the rating procedure and ask questions if any. The training clips are chosen to expose the viewers to the types and quality range of the testing clips. The sequences in test session are ordered randomly so that each subject sees the video clips in a different order. Each test consists of only CIF or QCIF clips, so that a viewer is exposed only to changes in frame rate and video content in each test. The testing configuration for either CIF or QCIF are the same except for the participating subjects. Totally 16 and 14 engineering students in Polytechnic University participated in the CIF and QCIF tests, respectively. The subjective quality assessment is carried out using Single Stimulus Continuous Quality Evaluation (SSCQE) method described in [7], by which a subject rates a video without comparison to a reference artifact-free version. However, instead of asking each subject to provide continuous rating of a video as it is played, the subject only needs to give an overall rating of the video at the end of the display. The rating is in the range of 0 (worst) to 100 (best). Each test lasts about 15 minutes without breaks. The other aspects of the test set-up closely follow the protocols defined in [7]. Given an overall range of 0 to 100, different viewers’ scores tend to fall in quite different subranges. We first normalize each viewer’s scores based on a chosen pair of minimum and maximum value. Specifically, we first find the minimum and maximum scores given by each viewer for all test sequences. We then set the normalized minimum value to the average of the minimum scores of all viewers, and similarly the normalized maximum value to the average of the maximum scores of all viewers. We average normalized viewer ratings for the same video sequence to determine the mean opinion score (MOS). Figure 1 presents the subjective test results. For each video, we show results both for CIF and QCIF sequences. As expected, the MOS reduces as the frame rate decreases, for each sequence at the same spatial resolution, and the falling rate is faster for sequences with faster motion. It is interesting and somewhat surprising that the falling rate is faster at QCIF than at CIF resolution for all video clips. This suggests that at a lower spatial resolution, viewers are more sensitive to reduction in frame rates. We note that the 95% confidential intervals are generally larger for QCIF clips than for CIF clips. The standard deviation over all clips at QCIF is 10 compared to 9.3 in CIF, indicating that the viewers are less consistent when rating the QCIF sequences. We attribute this to the difficulty in rating video quality when the display size is very small. Somewhat unexpected, the MOS for some QCIF sequences (e.g. Akiyo, and Mobile) at the highest reference
25
60
40 subjective score (CIF) model curve subjective score (QCIF) model curve
20
30
0 0
5
10
Frame rate(fps)
15
20
25
30
Frame rate(fps)
Fig. 1. The MOS (in points) and model curves (in curves) for each video sequence at different frame rates. The vertical bar indicates 95% confidential. The average standard deviation among all sequences at CIF and QCIF resolution are 9.3 and 10, respectively.
frame rate are slightly higher than those for CIF sequences. Since each viewer rates only CIF or QCIF sequences, this reversed phenomenon should not be interpreted as an indication that viewers believe the QCIF sequences have higher quality than CIF. We expect that the average ratings for the QCIF and CIF sequences at the highest frame rates should be similar when more viewers are involved in both tests. 3. PROPOSED MODEL Based on the subjective test results shown in Fig. 1, we propose to model the relation between the normalized quality (normalized by the quality at the highest frame rate) and the frame rate by an inverted falling exponential function. Let f represent the frame rate and fmax the maximum frame rate (fmax = 30 fps1 ). Let Qmax represent the quality rating for a video at frame rate fmax . The proposed model can be written as f
Q(f ) = Qmax
1 − e−c fmax . 1 − e−c
(1)
1 Based on the video frame size, perceived quality in CIF and QCIF size is mostly saturated at 30 fps, so higher frame rate is not considered at this time
CIF
proximate Qmax , and then reduce Qmax by the factor in Eq.
Normalized quality or correction Factor
1
f −c
max to account for the reduction of 1, i.e. C(f ) = 1−e 1−e−c the perceptual quality when the frame rate is reduced. For this reason, we call the factor C(f ) the temporal correction factor and the curves in Fig. 2 show how the correction factor varies with the frame rate. Note that although our subjective tests used uncompressed videos, the proposed model is applicable to compressed videos, where Qmax will be the quality derived from comparing coded frames to corresponding uncompressed frames.
0.8
0.6
0.4
Mobile, c = 7.96 Football, c = 5.43 Tempete, c = 7.03 City, c = 6.30 Bus, c = 6.28 Akiyo, c = 9.40
0.2
0 0
5
10 15 20 Frame rate(fps)
25
30
QCIF
4. RELATION OF MODEL PARAMETER AND THE SEQUENCE CHARACTERISTICS Figure. 2 shows that the model parameter is sequence dependent. The model will be very useful if the model parameter can be predicted from some features that can be computed from the original video sequences. In this section, we explore the relationship between some content-dependent features and the model parameter.
1 Normalized quality or correction Factor
f
0.8
0.6
4.1. Normalized Frame Difference 0.4
Mobile, c = 5.70 Football, c = 4.69 Tempete, c = 6.14 City, c = 5.70 Bus, c = 5.52 Akiyo, c = 6.26
0.2
0 0
5
10 15 20 Frame rate(fps)
25
30
Fig. 2. Normalized quality or correction factor v.s. frame rate Using the measured MOS at the maximum frame rate for each video sequence as Qmax , we plot the model curves together with the measured MOS values for all test sequences in Fig. 1. We can see that the proposed model fits the measurement data very well. The parameter c for each sequence is determined through the least square fitting method[8]. Figure 2 plots the ) model curves for normalized MOS scores Q(f Qmax . Note that the parameter c essentially characterizes how fast the perceive quality reduces as the frame rate decreases, with a larger c value indicating a slower falling rate, and vice verse. We see that at the same spatial resolution, faster motion sequences have smaller c values. Also, for the same sequence, the c values are smaller at the QCIF than at the CIF resolution. In order to predict the quality of a low frame rate video based on the model in equation 1, one may use a conventional objective metric (e.g. a sigmoidal function of PSNR as proposed in[9], or more complex metrics, such as VQM[10]) that compares corresponding frames between target video and its reference video at the same frame rate to determine ˜ The resulting Q ˜ does not consider the a quality index Q. frame rate of the video and will be similar to the quality Qmax determined for a high frame-rate version, if the frames in the low frame-rate video have similar quality as those in ˜ to apthe high frame-rate version. Therefore we can use Q
A simple measure of the temporal variation of a video is the mean absolute difference (MAD) or simply known as frame difference (FD), defined as λF D . We note that a sequence with high contrast tends to have a large frame difference even with small motion, and vice verse. Therefore, a more meaningful measure of frame difference due to motion should be normalized by contrast. This normalized frame difference (NFD) feature is defined as λN F D = λF D /λcont , where the contrast λcont of a video is defined as the mean of the standard deviation of the pixel values in each frame. Figures 3(a) and 3(f) plot this feature vs. parameter c. We see that c decreases along NFD quite linearly, with a high correlation of 0.94 and 0.94 for CIF and QCIF sequences, respectively. 4.2. Motion Vector Magnitude Frame difference only measures the changes in pixel values in successive frames, but it does not reflect the actual motion content in the scene. A more precise way to characterize the motion magnitude is by evaluating the motion vectors (MVs). In our study, MVs are determined by using full search block matching algorithm. We define the motion (MO) feature λmo as the mean of the motion vector magnitudes, for all motion vectors with magnitude at the top 10% of all MV magnitudes. Figures 3(b) and 3(g) plot parameter c v.s. λmo , and we see that c generally decreases with λmo , except for the sequence "City" in CIF, the view of Empire State Building from a rotating camera, and "Mobile" in QCIF, the artificial scene with objects moving in multiple directions. Even though each pixel for both sequences has relatively small motion vector and hence a small λmo , the consistent rotating camera motion and multiple moving directions make the eye quite sensitive to frame drop.
Normalized Frame Diff. v.s parameter (CIF)
MV v.s parameter (CIF)
9.5
9.5
akiyo
9
9
9
9
8.5
8.5
8.5
8.5
tempete city
tempete
7 6.5
bus
6
mobile
bus
5.5 0.1 0.2 0.3 0.4 Normalized Frame Difference
5 0
0.5
5
10 Magnitude of MV
(a)
15
6.2
tempete
bus
5.4
0.2 0.3 Normalized MV
5.8 5.6
mobile city bus
5.6
5.2
5
5
4.8
4.8
4.8
0.5
4.6 0
football 0.2
0.4 0.6 NFD+NMV
football 5 10 Magnitude of MV
15
4.6 0
0.8
(d) Normalized FD and MV v.s parameter (QCIF) 6.2
tempete
akiyo tempete
6
city bus
5.8 5.6
mobile
city bus
5.4 5.2 5
football 0.1
0.2 0.3 Normalized MV
0.4
0.5
4.8 4.6 0
football 0.2
0.4 0.6 NFD+NMV
0.8
(f) (g) (h) (i) Fig. 3. Relation between parameter c and the feature values for different features. The Pearson Correlation (PC) coefficients between "c" and individual feature are (a) PC=−0.94, (b) PC=−0.87, (c) PC=−0.93, (d) PC=−0.97, (f) PC=−0.94, (g) PC=−0.87, (h) PC=−0.90, (i) PC=−0.94
As with frame difference, we can also normalize the motion vector by contrast, yielding the normalized motion vector (NMV) feature, defined as λN MV = λmo /λcont . Figures 3(c) and 3(h) show that λN MV is more linearly related to the parameter c than λMV , but still not as good as λN F D .
rameter. This paper focused on the influence of the frame rate on video quality. Future studies will consider the effect of the frame size as well as the joint interaction among frame rate, frame size, and quantization on video quality. 6. REFERENCES
4.3. Weighted Sum of NMV and NFD We also examine the use of a weighted sum of NFD and NMV as a feature, defined as λN MV _N F D = λN MV + wλN F D , where w is a weighting factor. Figures 3(d) and 3(i) plot this feature with w = 1. We see that this combined feature has a higher correlation with parameter c for CIF sequences, but the correlation remains the same for QCIF sequences. We note that the c parameters for QCIF sequences are less accurate because viewer ratings are less consistent at the QCIF resolution. 5. CONCLUSION This work is concerned with the impact of the frame rate on the perceptual quality of a video. We demonstrate that the degradation of the perceptual quality of a video with the frame rate reduction can be accurately captured by a simple single-parameter inverted falling exponential function. Furthermore, the parameter of this function (i.e. the falling rate) is highly correlated with both the normalized frame difference (normalized by the frame contrast) and the combined feature (weighted sum of normalized frame difference and motion vector magnitude). Our future work will explore additional features that allow more accurate prediction of the model pa-
1
6.4
5.4
5.2
football
bus
5 0
0.5
5.8 mobile
5
0.1 0.2 0.3 0.4 Normalized Frame Difference
0.4
akiyo
5.4
city
5.5
6
5.2
4.6 0
0.1
6.2
tempete
c parameter
city
c parameter
mobile
tempete
7
Normalized MV v.s parameter (QCIF)
6
5.6
mobile
6
6.4
akiyo
akiyo
8 7.5
(c)
MV v.s parameter (QCIF)
6
bus football
5 0
20
akiyo
6.5
city
5.5
6.4
5.8
tempete
(b)
Normalized Frame Diff. v.s parameter (QCIF) 6.4 6.2
7
6
football
football 5 0
mobile
7.5
6.5
city
6
5.5
8
c parameter
7
8 7.5
c parameter
mobile
7.5
c parameter
8
c parameter
c parameter
Normalized FD and MV v.s parameter (CIF)
9.5
akiyo
6.5
c parameter
Normalized MV v.s parameter (CIF)
9.5
akiyo
[1] J. Y. C. Chen and J. E. Thropp, “Review of Low Frame Rate Effects on Human Performance,” IEEE Transactions on Systems, Man and Cybernetics, vol. 37, pp. 1063–1076, Nov. 2007. [2] Y. Wang, S.-F. Chang, and A. Loui, “Subjective Preference of SpatioTemporal Rate in Video Adaptation Using Multi-Dimensional Scalable Coding,” Proc. of ICME’04, vol. 3, pp. 1719–1722, Jun. 2004. [3] G. Yadavalli, M. Masry, and S. S. Hemami, “Frame Rate Preference in Low Bit Rate Video,” Proc. of ICIP’03, vol. 1, pp. I–441–4, Nov. 2003. [4] J. McCarthy, M. A. Sasse, and D. Miras, “Sharp or Smooth ?: Comparing the Effects of Quantization vs. Frame Rate for Streamed Video,” Proc. of ACM CHI on Human Factors in Computing Systems, pp. 535– 542, Apr. 2004. [5] R. Feghali, D. Wang, F. Speranza, and A. Vincent, “Quality metric for video sequences with temporal scalability,” Proc. of ICIP’05, vol. 3, pp. III–137–40, Sep. 2005. [6] Z. Lu and et al., “Perceptual Quality Evaluation on Periodic FrameDropping Video,” Proc. of ICIP’07, pp. III–433–436, Sep. 2007. [7] ITU-R Rec. BT.500-11, “Methodology for the subjective assessment of the quality of television pictures,” 2002. [8] C. T. Kelley, Iterative Methods for Optimization. Applied Mathematics, March 1999, no. 8.
SIAM Frontiers in
[9] S. Wolf and M. Pinson, “Video quality measurement techniques,” NTIA Report 02-392, Jun. 2002. [10] M. H. Pinson and S. Wolf, “A new standardized method for objectively measuring video quality,” IEEE Transactions on Broadcasting, vol. 50, no. 3, pp. 312–322, Sep. 2004.
1