Samenvatting. 205 ...... Functieleer (Cognitieve Psychologie). Na zijn ... Amsterdam bij de vakgroep Klinische en Experimentele Audiologie van Prof. dr. ir.
Downloaded from UvA-DARE, the Institutional Repository of the University of Amsterdam (UvA) http://dare.uva.nl/document/36473
File ID Filename
36473 Rhebergen_PhD_Thesis.pdf
SOURCE, OR PART OF THE FOLLOWING SOURCE: Type Dissertation Title Modeling the speech intelligibility in fluctuating noise Author K.S. Rhebergen Faculty Faculty of Medicine Year 2006 Pages 219
FULL BIBLIOGRAPHIC DETAILS: http://dare.uva.nl/record/195548
Copyrights It is not permitted to download or to forward/distribute the text or part of it without the consent of the copyright holder (usually the author), other then for strictly personal, individual use.
UvA-DARE is a service provided by the Library of the University of Amsterdam (http://dare.uva.nl)
Modeling the speech intelligibility in fluctuating noise ACADEMISCH PROEFSCHRIFT door Koenraad Sjoerd Rhebergen
ISBN: 90-8559-202-X
Printed by: Optima Grafische Communicatie, Rotterdam, The Netherlands
Printing of this thesis was financially supported by Atze Spoor Fonds, Beltone Netherlands B.V., Beter Horen, GN Resound B.V., Oticon Nederland B.V., Schoonenberg Hoorcomfort, Siemens Audiologie Techniek B.V., SMA Hoorcomfort en Veenhuis Medical Audio B.V.. © K.S. Rhebergen, Leiden, 2006 All rights reserved. No part of this book may be reproduced in any form, by print, photocopying, microfilm, electronic data transmission, or otherwise, without prior permission in writing from the author.
2
Modeling the speech intelligibility in fluctuating noise ACADEMISCH PROEFSCHRIFT ter verkrijging van de graad van doctor aan de Universiteit van Amsterdam op gezag van Rector Magnificus prof. mr. P.F. van de Heijden ten overstaan van een door het college voor promoties ingestelde commissie, in het openbaar te verdedigen in de Aula der Universiteit op dinsdag 26 september 2006, te 10.00 uur door Koenraad Sjoerd Rhebergen geboren te Amsterdam
3
Promotiecommissie: Promotor: Co‐promotor: Overige leden:
Prof. dr. ir. W. A. Dreschler Dr. ir. N. J. Versfeld
Prof. dr. E. de Boer Prof. dr. A.W. Bronkhorst Prof. dr. W.J. Fokkens Prof. dr. ir. T. Houtgast Prof. dr. ir. L.C.W. Pols Prof. dr. J. Wouters Faculteit der Geneeskunde
4
Voor mijn ouders
5
6
Contents
Chapter 1: Chapter 2:
Chapter 3: Chapter 4:
Chapter 5:
Chapter 6: Chapter 7: Chapter 8:
List of abbreviations General Introduction. A speech intelligibility index‐based approach to predict the speech reception threshold for sentences in fluctuating noise for normal‐hearing listeners. J. Acoust. Soc. Am. (2005) 117 (4), 2181 –2192. Release from informational masking by time reversal of native and non‐native interfering speech. J. Acoust. Soc. Am. (2005) 118 (3), 1274 – 1277. Learning effect observed for the speech reception threshold in interrupted noise with normal‐hearing listeners. Submitted to J. Acoust. Soc. Am. Validation of the extended speech intelligibility index for the prediction of the speech reception threshold in fluctuating noise for normal‐hearing listeners, and suggestions for further improvement. J. Acoust. Soc. Am. In press. Predicting the intelligibility for speech in real‐life background noises. Submitted to Ear & Hearing The dynamic range of speech, compression, and its effect on the speech intelligibility in interrupted noise. Predicting the Speech intelligibility in fluctuating noise in hearing impaired listeners
9 11 21 53 63 71 99 113 151
7
Contents
Chapter 9:
8
General Discussion.
171
Summary
185
References
191
Samenvatting
205
Dankwoord Curriculum Vitae
211 215
List of Abbreviations AI CB CR CLD CVC dB dBA DC DR ER ERB ERD ESII FIR FFT FMF HI HL Hz IIF JFC L1 L99 LTASS NH PTA RMS SII SNR SPL SRT SRTq STI WDRC
Articulation Index Critical Band Compression Ratio Cumulative Level Distribution Consonant Vowel Consonant decibel decibel A‐weighted Duty Cycle Dynamic Range Expansion Ratio Equivalent Rectangular Bandwidth Equivalent Rectangular Duration Extended Speech Intelligibility Index Finite Impulse Response Fast Fourier Transform Forward Masking Function Hearing‐Impaired Hearing Level Hertz Intensity Importance Function Just Following Conversation 1st percentile level 99th percentile level Long Term Average Speech Spectrum Normal‐Hearing Pure Tone Average Root Mean Square Speech Intelligibility Index Signal‐to‐Noise Ratio Sound Pressure Level Speech Reception Threshold Speech Reception Threshold in quiet Speech Transmission Index Wide Dynamic Range Compression
9
10
Chapter 1 General Introduction
11
General Introduction
General Introduction In general, normal‐hearing listeners have no serious problems to understand speech in different environments. Discussion partners intuitively adjust their vocal effort to the level of the surrounding noise such that they are able to understand each other at an acceptable level. The degree to which speech is intelligible to a listener depends on large number of factors. In most cases, the amount of speech information that is available to the listener is the most important variable. The more speech information is available, the easier it is to follow the speaker. Attempts to model the speech intelligibility started many years ago. The first studies on intelligibility started at AT&T Bell Labs in the 1920s. The aim of these studies was to analyze speech quality, telephone quality, and speech transmission. The work remained largely classified and was first published internationally only shortly after World War II (French and Steinberg, 1947; Fletcher and Galt, 1950; Fletcher, 1953). This work formed the basis of the “articulation theory” (Allen, 1996). To that date, the articulation theory was used, amongst others, to evaluate pilot‐navigator communications, to improve the signal‐to‐noise ratio (SNR) in the pilot’s ear, or to improve headphone damping (Allen, 1996). The principle of the calculation scheme was to calculate the remaining information present at the receiver (listener), and the outcome of the calculation scheme was a number between zero and unity, called the Articulation Index, or AI. An AI of zero meant that no information was present at the receiver’s ear, whereas an AI of unity meant that all information was transmitted in a proper manner. Unfortunately, the AI method of Fletcher and Galt (1950) was hardly used after its publication (Müsch, 2001), most likely due to the complex calculation scheme. To overcome this problem, Kryter (1962) introduced a calculation scheme that was based on the Fletcher and Galt method, but was much simpler to use. Eventually, his method led to the ANSI S3.5 (1969) standard AI calculation method. The AI model evolved and today, a revised version, called the Speech Intelligibility Index, or SII, is most commonly used (e.g., Noordhoek et al., 2000; Hornsby and Ricketts, 2003; Kates and Arehart, 2005). The SII model has been designed to predict the speech intelligibility for communication channels, conditions with speech in noise, and hearing aid settings, adjustments, or evaluation of hearing aid benefit. The basic
12
Chapter 1 principle of the SII model is as follows: For a given condition where speech is embedded in noise at a given SNR, the SII is calculated using the average noise spectrum, the average speech spectrum, and the listener’s hearing threshold. By calculating the SNR in different frequency bands, and by assigning a weight to each band (the so‐called Band Importance Function), the SII is finally determined by adding the amount of information for each band (e.g., Studebaker et al., 1993). As with the AI, the SII is a number between zero and unity and can been interpreted as the proportion of the total speech information that is available to the listener. For example, the proportion of speech information required to understand about one half of a number of simple, everyday short sentences is about one‐third. In terms of the model this means that SII=0.33. This is true for normal‐hearing listeners, listening to their native language. For hearing‐impaired listeners, the value of the SII is strongly influenced by their hearing loss and their ability to use their remaining auditory capacities. One often encounters hearing‐impaired listeners who are unable to understand speech properly, even when it is presented, in comparison with a normal‐hearing listener, sufficiently audible (e.g., with a hearing aid). Although speech is audible, the auditory system apparently is unable to process it properly (so‐called supra‐threshold deficits, Noordhoek, 2000). This is exactly the situation where hearing‐impaired listeners complain when listening in noisy surroundings: “I can hear you, but I can’t understand you”. In general, these listeners require a higher SNR to reach a proper level of intelligibility. The performance of listeners with respect to speech intelligibility in different background noises can be assessed by means of the Speech Reception Threshold (SRT) test (Plomp and Mimpen, 1979). The SRT test is an adaptive test, set up to determine the SNR that is required to make half of a number of sentences completely intelligible. To that end, a list of 13 sentences, of course unknown to the listener, is monaurally presented via headphones. The listener’s task is to repeat each sentence verbatim. Usually, the masking noise is presented at a fixed level, while the sentence level is varied adaptively. The SNRs of last 10 presentations are averaged, and this mean SNR is denoted as the Speech Reception Threshold, or SRT for that particular noise condition. To date, the SRT test of Plomp and Mimpen (1979) has been validated for a number of speech corpuses, not only for the Dutch language, but also for many other languages. Plomp conducted a series of studies on the SRT model to compare the effects of various factors on speech intelligibility with the aim to predict the
13
General Introduction SRT in stationary noise. A review of these studies (Plomp, 1986) describes that the SRT in stationary noise for normal‐hearing and hearing‐impaired listeners can be predicted at various levels by two parameters. These two parameters are the SRT in quiet and the critical SNR in stationary noise at higher noise levels. The model prediction for SRT in stationary noise thus is not dependent on the presentation level but predicts a fixed SNR at various noise levels. Since no exact control over the presentation level is needed to measure a SRT in stationary noise, the SRT in stationary noise is thus very suitable for screening purposes, even by telephone (Smits, 2006). With Dutch speech materials, consisting of simple, everyday short sentences, presented monaurally, normal‐hearing listeners require an SNR in stationary noise with the long‐term spectrum of the target speech on average of about ‐5 dB, meaning that the average speech level is 5 dB below the average noise level. The inability of some normal‐hearing listeners to reach this score may be due to a number of factors. One is that the speech is distorted some way or another (Plomp, 1986). Another possibility is that ageing affects the nervous and cognitive system, making it more difficult to entangle the speech from the noise (Plomp and Mimpen, 1978; Duquesnoy, 1983, Marcell and Cohen, 1992). This group of normal‐hearing subjects might have in some way or another difficulties with spectral and or temporal processing. Reduced temporal resolution results in difficulties in processing rapid changes in the speech signal, whereas reduced frequency resolution results in limited discrimination of spectral contrasts in the speech signal. Finally, it is well known that acquaintance with the language is a dominant factor in speech intelligibility. Non‐native listeners need much more information to understand a message (van Wijngaarden, 2003). From the transmitter side, intelligibility is hampered if a non‐native speaker is talking, or if the speaker pronounces or articulates in an unclear manner. Traditionally, the SRT is determined for speech in stationary noise. Also, the SII has been validated only for speech in stationary noise. However, non‐stationary or fluctuating noises are increasingly used, since they appear to be more sensitive to discriminate between conditions and listeners (Festen and Plomp, 1990; Middelweerd et al., 1990; Peters et al., 1998; Versfeld and Dreschler, 2002; Festen and Plomp, 2002). For example, Festen and Plomp (1990) introduced a fluctuating noise with speech‐like properties, viz., noise with a speech spectrum
14
Chapter 1 and with speech modulations. They showed that differences between normal‐ hearing and hearing‐impaired subjects were larger in fluctuating noise than in stationary noise. Existing differences between normal‐hearing and hearing‐ impaired listeners were increased by the fact that normal‐hearing listeners were able to make good use of the relatively silent period in the noise, resulting in a decrease in SRT, while hearing‐impaired listeners only hardly benefited from the fluctuations, leaving their SRT unaltered.
SRT in Fluctuating Noise (dB)
10 NH subjects HI subjects
5 0 -5 -10 -15 -20 -20
-15
-10 -5 0 SRT in Stationary Noise (dB)
5
10
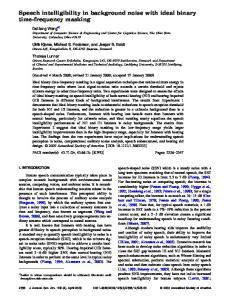
Figure 1.1 The SRT in fluctuating noise as a function of the SRT in stationary noise. The dotted line indicates the points of equal SRT. Each circle denotes an individual normal‐hearing (filled circle) or hearing‐ impaired (open circle) subject. Data taken from Versfeld and Dreschler (2002). Figure 1.1 shows the relationship between the SRT measured in fluctuating speech shaped noise and stationary speech shaped noise for groups of young and elderly, normal‐hearing or hearing‐impaired listeners (data taken from Versfeld and Dreschler, 2002). Each data point denotes the result of an individual listener. Figure 1.1 shows that normal‐hearing listeners (subjects
15
General Introduction with a normal pure‐tone threshold) perform generally well in fluctuating noise (on average have SRTs of about ‐12 dB), whereas their SRTs in stationary noise are about ‐4.5 dB. Subjects who perform worse in fluctuating noise may still experience no decline in SRT in stationary noise. Consequently, a good performance in fluctuating noise implies a good performance in stationary noise, whereas the opposite is not true. The large improvement in SRT due to the fluctuations in the masking noise cannot be modeled by the SII model in its present form (ANSI S3.5‐1997). Figure 1.2 displays the psychometric function where sentence intelligibility has been plotted as a function of SNR for normal‐ hearing subjects. The solid curve is obtained for speech in stationary speech shaped noise. It can be seen that this curve starts to deviate from zero at an SNR near –10 dB, and reaches 100 % at an SNR of about 0 dB. SII model calculations are given at the upper abscissa. As defined by the model, the SII increases linearly from zero at SNR=‐15 dB to unity at SNR=15 dB. As mentioned above, near a score of 50 %, the SII is equal to 0.33, meaning that one‐third of the speech information is required to obtain 50 % sentence intelligibility. The dashed curve in 1.2 denotes the psychometric function for the fluctuating masking noise of Festen and Plomp (1990). As discussed earlier, performance in fluctuating noise is much better, and 50 % intelligibility (the SRT) is at an SNR of about –12 dB. Given that the SII is calculated from the long‐term average spectrum of noise and speech, it does not take into account any fluctuations in the masking noise. Accordingly, an SII value calculated for an SRT in fluctuating noise will be identical to that in stationary noise. Figure 1.2 shows that 50 % intelligibility corresponds to an SII of 0.09, which deviates severely from the existing model. At threshold, one would expect similar values of the SII, indicating that the amount of speech information at threshold (SRT) is equal irrespective of the masking noise. Many studies have shown convincingly that the SII model can adequately describe the SRT in different kinds of stationary noise. However, when fluctuating noise is involved, the model is clearly inadequate. Attempts have been made to modify the SII model in order to predict the speech intelligibility in interrupted noise (Ludvigsen, 1987; Dubno et al., 2002). With interrupted noise, the signal can be partitioned into two portions: one part with masking noise present, and the other part with masking noise absent. For both separate parts, the conventional SII can be determined. The resulting SII then is the average of both parts. This technique is a special case of a model that considers the speech and noise stationary over a very short
16
Chapter 1 time interval. Within each time interval the conventional SII can be determined, and where the resulting SII is the average across all time intervals. Indeed, Kates (1987) introduced the concept of the short‐time articulation index to evaluate an adaptive noise‐cancellation system by dividing the speech into segments, and plotting the change in the AI as a function of time to illustrate the adaptivity of the noise‐cancellation system. Also, Houtgast et al. (1992) proposed that speech intelligibility in fluctuating noise might perhaps be predicted by calculating the instantaneous value of the AI. Unfortunately, although the general concept of an instantaneous AI or SII has been formulated about 20 years ago, it has never been properly implemented and used with the aim to predict the speech intelligibility in non‐stationary noise. The present thesis describes the research that has been set up and conducted to gain more insight in the intelligibility of speech in fluctuating noise by means of listening experiments and by means of modeling. SII 100
0.0
0.1
0.2
0.3
0.4
0.5
0.6
0.7
0.8
0.9
1.0
Sentence score correct (%)
90 80 70 60 50
SRT
40 30 20
Stationary Noise Fluctuating Noise
10 0 -15
-10
-5
0 SNR (dB)
5
10
15
Figure 1.2 Percent sentence correct as function of SNR in stationary noise (solid line) and fluctuating speech shaped noise (dashed line) for normal‐hearing listeners. The horizontal dotted line indicates the 50 % sentence correct score, or SRT. SRT is the SNR level in dB at which 50 % correct score is obtained. The upper axis indicates the SII (ANSI S3.5‐ 1997) value for a given sentence correct score.
17
General Introduction Chapter 2 introduces an approach to model the Speech Reception Threshold (SRT) in fluctuating noise for normal‐hearing listeners. The new method is an extension to the SII. Many SRT data available from the literature for a variety of noise types are used to evaluate the extension to the SII model. Furthermore, aspects that can influence the speech intelligibility in noise are discussed. In Chapter 3, a method is presented with which the effect of informational masking on the speech intelligibility in interfering speech can be examined. The study shows that with speech in a language unknown to the subjects (and consequently unintelligible) as interferer, listeners suffer less from informational masking than with intelligible speech in their own language as interferer. In Chapter 4, the learning effect is examined for the SRT in interrupted noise with normal‐hearing listeners. It appears that with stationary noise as a masker, no learning effect is observed, whereas with interrupted noise there is a strong effect. Chapter 5 describes a study with normal‐hearing listeners to validate the Extended SII (ESII) model introduced in Chapter 2 of this thesis. The SRTs for a range of fluctuating masking noise conditions, critical to the model, have been measured with normal‐hearing subjects and have been used to refine the model. A revision is proposed, which enables a better prediction for speech intelligibility in fluctuating noise, due to the introduction of forward masking. Chapter 6 is an evaluation study with normal‐hearing listeners to examine the ESII introduced in Chapter 5 of this thesis. The speech intelligibility is measured in a range of real‐life background masking conditions. The results show that it is valid to use the ESII with real‐life noises, i.e., sounds that show more complex spectro‐temporal variations than do artificial masker signals used in most experiments. Chapter 7 describes the effect of the dynamic range of speech on the intelligibility in stationary and interrupted noise for normal‐hearing listeners. In addition, a Wide Dynamic Range Compression (WDRC) scheme is used to measure the speech intelligibility for compressed speech‐in‐stationary, and speech‐in‐interrupted noise. The observed SRTs are used to refine and extend the model. In Chapter 8, the ESII model is used to predict the speech intelligibility for hearing‐impaired listeners in stationary and interrupted noise. Moreover, a
18
Chapter 1 method is suggested to model the effect of cochlear compression for normal‐ hearing and hearing‐impaired listeners for speech intelligibility in noise. Finally, Chapter 9 describes the general conclusions of this thesis, considers some limitations for the prediction of speech intelligibility in noise, and gives suggestions for further study opportunities to examine the speech intelligibility for hearing‐impaired and aided hearing‐impaired listeners. This thesis is composed of seven papers (chapters 2 ‐ 8) published or (to be) submitted as research paper. Therefore, chapter 2 to 8 can be read separately. Consequently, there may be some overlap in the introduction and method sections among these chapters.
19
General Introduction
20
Chapter 2 A Speech Intelligibility Index‐Based Approach to Predict the Speech Reception Threshold for Sentences in Fluctuating Noise for Normal‐Hearing Listeners Koenraad S. Rhebergen and Niek J. Versfeld Journal of the Acoustical Society of America (2005) 117 (4), 2181 –2192.
21
Extended Speech Intelligibility Index
Abstract The SII model in its present form (ANSI S3.5‐1997) can accurately describe intelligibility for speech in stationary noise but fails to do so for non‐stationary noise maskers. Here, an extension to the SII model is proposed with the aim to predict the speech intelligibility in both stationary and fluctuating noise. The basic principle of the present approach is that both speech and noise signal are partitioned into small time frames. Within each time frame, the conventional SII is determined, yielding the speech information available to the listener at that time frame. Next, the SII values of these time frames are averaged, resulting in the SII for that particular condition. Using Speech Reception Threshold (SRT) data from the literature, the extension to the present SII model can give a good account for SRTs in stationary noise, fluctuating speech noise, interrupted noise, and multiple‐talker noise. The predictions for sinusoidally‐intensity modulated (SIM) noise and real speech or speech‐like maskers are better than with the original SII model, but are still not accurate. For the latter type of maskers, informational masking may play a role.
22
Chapter 2
I. Introduction In daily life, speech is not always equally intelligible due to the presence of background noise. This noise may mask part of the speech signal such that not all speech information is available to the listener. In order to be able to predict the speech intelligibility under such masking conditions, French and Steinberg (1947), Fletcher and Galt (1950), and later Kryter (1962) initiated a calculation scheme, known as the Articulation Index (AI), which at present still is used by a number of investigators (Rankovic, 1998, 2002; Hogan and Turner, 1998; Müsch and Buus, 2002; Brungart, 2001; Turner and Henry, 2002; Dubno et al., 2002, 2003). In 1984, Pavlovic and others (Dirks et al., 1986; Kamm et al., 1985; Pavlovic, 1984, 1987; Pavlovic and Studebaker, 1984; Pavlovic et al., 1986; Studebaker et al., 1987, 1994) started to re‐examine the AI calculation scheme, which has led to a new method accepted as the ANSI S3.5‐1997 (1997). Since its revision in 1997, the method is named the Speech Intelligibility Index (SII). For a given speech‐in‐noise condition, the SII is calculated from the speech spectrum, the noise spectrum and the listener’s hearing threshold. Both speech and noise signal are filtered into frequency bands. Within each frequency band the factor Audibility is derived from the Signal‐to‐Noise Ratio (SNR) in that band indicating the degree to which the speech is audible. Since not all frequency bands contain an equal amount of speech information (i.e., are not equally important for intelligibility), bands are weighted by the so‐called Band‐ Importance function. The Band‐Importance function indicates to which degree each frequency band contributes to intelligibility. It depends on the type of speech material involved (e.g., single words or sentences), and other factors. Finally, the SII is determined by accumulation of the Audibility across the different frequency bands, weighted by the Band‐Importance function. The resulting SII is a number between zero and unity. The SII can be seen as the proportion of the total speech information available to the listener. An SII of zero indicates that no speech information is available to the listener; an SII of unity indicates that all speech information is available. Model parameters have been chosen such that the SII is highly correlated to intelligibility. The SII model has been developed to predict the average speech intelligibility for a given speech‐in‐noise condition; it does not attempt to predict the intelligibility of the individual utterances (phonemes or words) of a speech fragment. Also, speech
23
Extended Speech Intelligibility Index redundancy or contextual effects, which are inherent to meaningful speech, are captured in the SII model by choice of the model parameters. Higher speech redundancy simply results in less information (i.e., a lower value for the SII) required for understanding the speech message. Within the context of the present paper, an important observation is that the existing SII model does not take into account any fluctuation in the masking noise, since the SII is computed from the long term speech and noise spectrum. Therefore, the SII is independent of the amount of fluctuations in the noise signal. Numerous papers have reported on experiments dealing with speech intelligibility in fluctuating noise. In almost all cases, normal‐hearing listeners perform better in conditions with fluctuating noise compared to those with stationary noise of the same RMS level (Miller, 1947; Miller and Licklider, 1950; Licklider and Guttman, 1957; de Laat and Plomp, 1983; Duquesnoy, 1983; Festen, 1987, 1993; Festen and Plomp, 1990; Gustafsson and Arlinger, 1994; Bacon, et al., 1998; Peters et al., 1998; Brungart, 2001; Versfeld and Dreschler, 2002; Dubno, 2002; Nelson et al., 2003). In many cases, this finding has been phenomenologically explained by stating that the listener is “able to catch glimpses of the speech during the short silent periods of the masking noise” (Howard‐Jones and Rosen, 1992, 1993; Festen, 1993; Peters et al., 1998). Recently, Oxenham and co‐workers (Oxenham and Plack, 1997; Plack and Oxenham, 1998; Oxenham et al., 2004) proposed that the nonlinear behavior of the basilar membrane enables increased gain during the silent periods, allowing increased audibility. In hearing‐impaired subjects, this non‐linear behavior is less or even absent, which results in decreased audibility during absence of masking noise. So far, the SII model has been validated only for stationary masking noises, for which it works well. However, it fails to predict speech intelligibility accurately in case of fluctuating noise maskers (Festen and Plomp, 1990; Houtgast et al., 1992; Versfeld and Dreschler, 2002). Other methods, such as the Speech Transmission Index (STI, Steeneken and Houtgast, 1980), or even the speech‐ based STI (van Wijngaarden, 2002) also fail at this point. To our knowledge, there is still no method that can predict the speech intelligibility in fluctuating noise accurately. Yet, since most real‐life noises do exhibit strong variations over time, there is a great interest in a procedure that is able to predict speech intelligibility in fluctuating noises adequately.
24
Chapter 2 In the present paper, an extension to the SII model is proposed in order to be able to predict the speech intelligibility not only in stationary noise, but also in fluctuating noise. The extension consists of an approach where, for a given condition, both speech and noise signal are partitioned into small time frames. Within each time frame, the conventional SII is determined, yielding the speech information available to the listener at that time frame. Next, the SII values of these time frames are averaged, resulting in the SII for that particular noise type. It is hypothesized that this averaged SII is closely related to the speech intelligibility for that condition. In the next section, an outline of the existing SII model is given. It is followed by a detailed description of the extensions to the existing model, which is introduced to allow predictions of the speech intelligibility in fluctuating noises as well. In extending the SII model, attention has been given to stay as close as possible to the original SII model, thus making as few adaptations as possible. In the choice of the model parameters, this paper concentrates on experiments where speech intelligibility has been assessed with the method of the so‐called Speech Reception Threshold (SRT), as described by Plomp and Mimpen (1979). With this method, short everyday sentences are used as speech materials. In Section II‐C the SRT method is described in some detail. Next, (in section III) data from the literature are used to evaluate the extended SII model. Finally, in Section IV, predictions and limitations of the extended SII model will be discussed.
II. Model description
A. The SII model A detailed description of the SII model is given in ANSI S3.5‐1997 (1997). Here, a brief overview is given, so that in the next section the extensions to the existing model are easier to follow. The SII model basically calculates the average amount of speech information available to a listener. To that extent, the model uses the long‐term averaged speech spectrum and the long‐term averaged noise spectrum as input. Both speech and noise spectrum are defined as the spectrum level (in dB/Hz) at the
25
Extended Speech Intelligibility Index eardrum of the listener. Within the model, an option exists to partition the speech and noise spectrum into octave bands, one‐third‐octave bands, or critical bands. In this paper, spectra are partitioned into critical bands (given in Table I of the ANSI S3.5‐1997 standard) although the other two options are equally valid. Within each critical band, the spectrum level is separately determined for both speech and noise. Next, correction factors are taken into account for effects such as upward spread of masking for both speech and noise, inaudibility due to the auditory threshold for pure tones, and distortion due to excessive high speech or noise levels. Then, within each frequency band, the difference between the speech and noise level (signal‐to‐noise ratio or SNR) is calculated and this value is multiplied with the so‐called Band‐Importance function, which results in the proportion of information in that band that is available to the listener. The Band‐Importance function may depend on the type of speech materials (e.g., sentences or words), or level. Finally, these values are added, yielding the Speech Intelligibility Index (SII), or the amount of speech information available to the listener. For normal‐hearing listeners, the SII has proven to be closely related to the average intelligibility in a given condition where speech is masked by a stationary noise masker (Pavlovic, 1987).
B. Extension to the SII model Since the SII model uses the long‐term averaged speech and noise spectrum as input, all temporal characteristics of these signals are lost. As mentioned in the Introduction, large differences in intelligibility exist between masking noises that differ from each other solely with respect to temporal fluctuations (e.g., steady versus fluctuating noise). In this section, an extension is presented that does take the temporal characteristics of the masking noise into account. In essence, the SII model is adapted such that the SII is calculated within small time frames, after which the average SII is calculated. A block diagram of the calculation scheme is presented in Figure 2.1. Both speech and noise are analyzed separately for the SII calculation. Although, in principle, regular speech could be used as the speech input signal, speech‐shaped noise (i.e., stationary gaussian noise with the long‐term average spectrum of speech) was used. The main reason for this is that in combination with stationary noise as a noise masker, all SII values are identical to those obtained with the existing SII
26
Chapter 2 model. This prerequisite is not easily fulfilled when normal speech signals would be used. Speech Noise Speech Noise Critical‐band filter bank CB 21 CB 21 Envelope estimator CB 20 CB 20 Frequency dependent CB 19 CB 19 time window Threshold of hearing CB 2 CB 2 SII (t) CB 1 CB 1 Figure 2.1 Schematic overview of the calculation scheme for the extended SII model. A detailed description is given in the main text. The input speech signal (stationary gaussian noise with the long‐term average spectrum of speech) and input noise (in this example interrupted noise with the long‐ term average spectrum of speech) are separately filtered by a 21 Critical‐ Band (CB) filter bank. The envelope of the input speech and noise are estimated in every CB (1‐21); the instantaneous intensity is estimated in a frequency dependent time window, as indicated by the shaded bars (CB1=35ms to CB21=9.4ms). Every 9.4 ms an SII is calculated as described by ANSI S3.5‐1997. For each of the approximately 200 steps (of 9.4ms), the instantaneous SII(t) is determined (sentence of about 2 seconds ). Lastly, the SII for that speech‐in‐noise condition is determined by averaging across all instantaneous SII(t) values.
27
Extended Speech Intelligibility Index The SII is in principle designed to predict the average intelligibility of speech in noise and not the intelligibility of individual words or phonemes. In any case, the SII is badly defined in case of silent periods occurring within the normal speech signal because, regardless of the masking noise, the SII will always be zero. Thus, even when a speech signal is presented at a clear level without any masking noise, the SII based on regular speech never will reach unity, due to the inherent silent periods in the speech signal. Moreover, problems will occur if one considers the silent periods between sentences. It is clear that large differences in SII may occur when the silent periods between sentences vary, whereas the actual intelligibility should not be different. The most straightforward approach to determine the SII within small time frames is to window the speech and noise signal at a given point in time, to calculate the frequency spectrum (by means of a Fast Fourier Transform, FFT), and to derive an SII from the resulting speech and noise spectrum and the threshold of hearing. However, in order to be able to track the perceptually relevant fluctuations over time, the window length should be small enough. This means that the time window should have a duration of several milliseconds, which is the temporal resolution for normal‐hearing listeners based on gap detection thresholds in the higher frequency bands (Plomp, 1964; Shailer and Moore, 1983, 1987; Glasberg and Moore, 1992; Eddins et al., 1992; Oxenham and Moore, 1994, 1997; Moore et al., 1996; Plack and Oxenham, 1998; Moore, 1997). Unfortunately, such a short time window leads to the signal‐ analytical problem that the level in the lower frequency bands is not estimated accurately. On the other hand, a longer time window leads to a poorer grasp of the temporal variations of the signal. It is known that the temporal resolution of the auditory system is frequency dependent (Shailer and Moore, 1983, 1987). Time constants (i.e., integration times) for the lower frequency bands are larger than those for the higher bands. To overcome the analysis problems on the one hand, and to stay close to the characteristics of the auditory system with respect to temporal resolution on the other hand, the signal was first filtered into 21 critical bands, and the window length was chosen to be relatively short in the higher bands and relatively long in the lower bands. Since in the original SII calculations the frequency bands are essentially non‐overlapping (after all, the intensity within each filter band was
28
Chapter 2 derived from the frequency spectrum), a FIR filter bank of order 200 (600 dB/oct.) was used to filter the entire speech and noise signal into the separate bands. Within each band, the temporal envelope was determined by means of a Hilbert Transform. At a given time frame, rectangular windows were used with window lengths ranging from 35 ms at the lowest band (150 Hz), to 9.4 ms at the highest band (8000 Hz). These window lengths were taken from Moore (1997, Chapter 4) for gap detection and have been multiplied by 2.5. The factor 2.5 was chosen to provide a good fit to the present data‐set, as will be discussed below. The windows were aligned such that they ended simultaneously. Within each time frame the intensity was determined, and these, together with the absolute threshold for hearing were used as input to calculate the instantaneous SII, for that given time frame. To calculate the SII, the so‐called Speech Perception In Noise (SPIN) weighting function (ANSI S3.5‐1997, 1997, Table B.1) was used. This choice seems to be valid, since the speech materials of Plomp and Mimpen (1979) are closely related to the SPIN materials with respect to sentence length and redundancy. Last, the SII for the speech‐in‐noise condition under consideration was determined by averaging across all instantaneous SII values.
C. Speech Reception Threshold In the present paper, the proposed extension to the SII model was evaluated using existing data from the literature. The data differ from each other with respect to a number of variables that all can have an effect on intelligibility, hence on the parameter settings of the SII model. For example, it is known that the type of speech material (monosyllables, words, sentences, etc.), open or closed response set, and native or non‐native language acquisition can have a large effect on intelligibility (Bosman and Smoorenburg, 1995; Drullman and Bronkhorst, 2000; van Wijngaarden, 2003). Next, similarity between masker and target, e.g., in the case where both target and masker consist of a male voice (Bronkhorst and Plomp, 1992; Bronkhorst, 2000), has a detrimental effect on the actual threshold (i.e., the signal‐to‐noise ratio that results in just‐intelligible speech). Also, the experimental paradigm influences threshold to a large extent. The adaptive SRT‐procedure according to Plomp and Mimpen (1979), and the Just to Follow Conversation (Hygge et al., 1992; Larsby and Arlinger, 1994) result in different threshold levels for the same speech material. Additionally,
29
Extended Speech Intelligibility Index differences in data acquisition (e.g., strictness of sentence scoring) may have an effect on threshold level. Furthermore, different presentation methods (through headphones, loudspeakers, monaural, binaural, diotic, or dichotic presentation) evidently affect threshold level. If one considers masking noises bearing silent periods, it is likely that, even within a group of normal‐hearing subjects, differences in hearing level may affect audibility, and thus intelligibility. Finally, when dealing with spectral differences between masker and target, the method used for calibrating signal levels (e.g., RMS, dBA) may have a clear effect. To enable a comparison between data obtained in different studies, in the present study only thresholds are used that were obtained with the so‐called Speech Reception Threshold (SRT) method for sentences, as described by Plomp and Mimpen (1979). Speech materials consist of simple everyday sentences, having a length of 8 to 9 syllables (Plomp and Mimpen, 1979; Nilsson et al., 1994; Versfeld et al., 2000). The SRT is defined as the signal‐to‐noise ratio (SNR) needed for 50 % sentence intelligibility. The SRT is estimated as described by Plomp and Mimpen (1979): A list of 13 sentences, unknown to the listener, is monaurally presented via headphones. The masking noise is presented at a fixed level, whereas the sentence level is varied adaptively. The first sentence starts at a very unfavorable SNR, and is repeated each time at a 4‐dB higher level until the listener is able to repeat every word of this sentence exactly. The SNR of the twelve remaining sentences is varied adaptively with a step size of 2 dB using a one‐up, one‐down procedure. The SNR of the next sentence is increased by 2 dB after an incorrect response and decreased by 2 dB after a correct response. The average adjusted SNR of sentence 5 through 13 plus the estimated SNR that would have been used for the 14th sentence is adopted as the SRT for that particular noise condition. With the speech material of Plomp and Mimpen (1979), normal‐hearing listeners require an SNR in stationary speech‐shaped noise of –5 to –4 dB, which corresponds to an SII between 0.3 and 0.4 (Steeneken, 1992; Bronkhorst, 2000; Noordhoek, 2000; Versfeld and Dreschler, 2002; van Wijngaarden, 2002, 2003). This means that roughly one‐ third of the speech information is required to the normal‐hearing listener (i.e., the SII is between 0.3 and 0.4) to reach the SRT for these sentences
30
Chapter 2
III. Model predictions
A. Steady‐state speech noise Speech intelligibility in stationary speech‐shaped noise can be well predicted by the existing SII model. There are numerous papers dealing with the SRT in stationary speech noise, and all report for normal‐hearing listeners at a fixed noise level between 60 and 80 dBA an SRT for sentences of approximately –4.5 dB (de Laat and Plomp, 1983; Middelweerd et al., 1990; Festen, 1987; Festen and Plomp, 1990; ter Keurs et al., 1993; Versfeld and Dreschler, 2002; Neijenhuis, 2002). For speech in stationary speech noise, an SRT of –4.5 dB results for the existing SII model in an SII value of 0.35.
Figure 2.2 Representation of the SII with the extended SII model for a speech‐in‐noise sample of 2 seconds. The upper panel represents a speech signal of a female speaker. The middle panel represents a stationary speech‐shaped masking speech noise. The noise has been scaled to 60 dBA. The target has been scaled to 55.5 dBA, which results in an SNR of –4.5 dB. The lower panel displays the resulting instantaneous SII as a function of time. The SII averaged across time is equal to 0.35.
31
Extended Speech Intelligibility Index Figure 2.2 displays the results of a calculation with the extended SII model for speech in stationary speech noise. The upper panel in Figure 2.2 displays the waveform of a speech signal representation (that is— a stationary speech‐ shaped noise signal instead of an actual speech signal, as discussed in the previous section) with a duration of two seconds, presented at a level of 55.5 dBA. Here, speech noise was taken from Versfeld et al. (2000) for the female speaker. The middle panel shows a 2‐s sample of the stationary speech‐shaped noise masker derived from the same female speaker, at a level of 60 dBA. The lower panel in Figure 2.2 shows the resulting instantaneous SII, where the SII has been determined every 9.4 ms. Due to the fact that speech and noise signal are uncorrelated (different noise samples), small fluctuations in the instantaneous SII occur. It is easy to see that the SII, averaged across the 2‐s sample is between 0.3 and 0.4. In fact, the average is 0.35, which is identical to the value obtained by the existing SII model. Many conditions with speech in stationary noise have been studied, and all calculations show that neither speech type nor noise type result in differences between the existing SII model and the present extended SII model. In conclusion, the extended SII model yields exactly the same results as the existing SII model, as long as a stationary masking noise is used.
B. Speech noise with a speech‐like modulation spectrum As discussed above, the existing SII model is not able to correctly predict intelligibility for speech in modulated noise. This section deals with speech intelligibility for speech in noise with a speech‐like spectrum and a single‐ speaker modulation spectrum. The generation of this type of noise is described by Festen and Plomp (1990). With normal‐hearing subjects, several papers report for this condition an SRT around –12 dB (Festen and Plomp, 1990; ter Keurs et al., 1993; Versfeld and Dreschler, 2002; Neijenhuis, 2002), when the noise level is between 60 and 80 dBA. Computations with the existing SII model yield a score of 0.089, which is far too low.
32
Chapter 2
Figure 2.3 Representation of the SII with the extended SII model for a speech‐in‐noise sample of 2 seconds. The upper panel represents a speech signal of a female speaker. The middle panel represents a fluctuating speech‐shaped masking speech noise, as used by Festen and Plomp (1990). The noise has been scaled to 60 dBA. The target has been scaled to 48 dBA, which results in an SNR of –12 dB. The lower panel displays the resulting instantaneous SII as a function of time. The SII averaged across time is equal to 0.35. Figure 2.3 displays the results of the calculations with the extended SII model, similar to the previous section. The upper panel displays the waveform of a speech signal (again, taken as a stationary speech‐shaped noise signal) with a duration of two seconds, presented at a level of 48 dBA. The middle panel shows a 2‐s sample of the modulated speech noise masker, at a level of 60 dBA. The lower panel in Figure 2.3 shows the resulting instantaneous SII, where, in contrast to the findings in Figure 2.2, the SII value greatly varies over time. It ranges from values close to zero (at points in time where the speech is entirely masked by the masking noise) to values near unity (at points where the masking noise is momentarily absent). The lower panel thus denotes the amount of speech information available to the listener as a function of time. Averaging across time results in an SII score of 0.35. Because large fluctuations
33
Extended Speech Intelligibility Index exist over time, a suitably long period has to be chosen to average across. The time interval required to reach stable values for the SII depends on the periodicity, or alternatively, randomness, of the signal as well as on the modulation frequencies in the masking signal. With the present type of masking noise, where the modulations are most prominent near 4 Hz, a period of 2 seconds appears to be long enough to reach a between samples standard deviation for the SII of 0.0056. Increasing the period to 4 seconds decreases the standard deviation of the SII to 0.0030. 1.0 0.9
Stationary noise Fluctuating noise
0.8 0.7 SII
0.6 0.5 0.4 0.3 0.2 0.1 0.0 -30
-25
-20
-15
-10
-5
SNR (dB)
0
5
10
15
20
Figure 2.4 SII as a function of SNR as calculated with the Extended SII model. Filled symbols denote calculations with a stationary noise masker with the long‐term spectrum of the female target speaker. Open symbols denote calculations with a fluctuating noise masker with the long‐term spectrum of the female target speaker and a speech‐like modulation spectrum. The level of the noises was set to 60 dBA. Figure 2.4 displays the SII as a function of the SNR. Here, the masking noise has been kept fixed at 60 dBA, and the level of the speech has been varied between
34
Chapter 2 30 and 80 dBA (thus between SNRs of –30 and +20 dB). With stationary speech noise (denoted as filled symbols in Figure 2.4) the SII starts to deviate from zero as the SNR reaches a value of –15 dB and increases almost linearly with the SNR up to a value of +15 dB. At this value, the speech level is about 75 dBA, and the distortion factor in the SII model prevents the SII from reaching unity. The behavior of the SII as a function of SNR with stationary noise is identical for the existing and the extended SII model. Differences between the two models arise when fluctuating noise is used as a masker. Since the existing SII model does not take the amplitude modulations in the noise masker into account, the SII as calculated with the existing SII model will be identical to that calculated for stationary noise. The SII as a function of SNR for fluctuating noise predicted by the extended SII model is given with open symbols in Figure 2.4. Even at very low signal‐to‐noise ratios, there is still some speech information available to the listener and the SII exceeds zero. Increasing the SNR causes the SII to increase, but the slope of the function is not as steep as that calculated for speech in stationary noise. Again, at higher speech levels, the distortion factor of the SII model causes the function to level off, such that the SII does not reach unity. An important observation seen in Figure 2.4 is that a constant SII value of 0.35 (the information required to reach threshold) results in an SRT of –4.5 dB for stationary masking noise and –12 dB for fluctuating masking noise.
C. Interrupted speech noise De Laat and Plomp (1983) measured SRTs for sentences in interrupted (gated) speech noise with a duty cycle of 50 %. Modulation frequency was 10 Hz. Masking noise was presented at 65, 75, or 85 dBA. Figure 2.5 displays the calculations with the extended SII model, similar to Figures 2.2 and 2.3. The upper and middle panel show the speech signal and masking noise signal, respectively. Signal and noise level are 42 dBA and 65 dBA, respectively. The SNR thus is –23 dB. The lower panel shows the SII as a function of time. As seen earlier, the SII is close to zero when the masking noise is present, and is close to unity when the masking noise is absent. Due to the longer integration times in the lower frequency bands, the SII does not change as rapidly as the interrupted noise, but rather smears out over time. Again, the SII averaged across time is equal to 0.35.
35
Extended Speech Intelligibility Index
Figure 2.5 Representation of the SII with the extended SII model for a speech‐in‐noise sample of 2 seconds. The upper panel represents a speech signal of a female speaker. The middle panel represents an interrupted speech‐shaped masking speech noise, as used by de Laat and Plomp (1983). The noise has been scaled to 65 dBA. The target has been scaled to 42 dBA, which results in an SNR of –23 dB. The lower panel displays the resulting instantaneous SII as a function of time. The SII averaged across time is equal to 0.35.
36
Chapter 2
1.0 0.9 0.8 0.7
Stationary noise 65 dB(A) 10 Hz Int. noise 65 dB(A) 10 Hz Int. noise 75 dB(A) 10 Hz Int. noise 85 dB(A)
SII
0.6 0.5 0.4 0.3 0.2 0.1 0.0 -50 -45 -40 -35 -30 -25 -20 -15 -10 -5
0
5 10 15 20
SNR (dB)
Figure 2.6 SII as a function of SNR as calculated with the Extended SII model. Filled symbols denote calculations with a stationary noise masker with the long‐term spectrum of the female target speaker at a level of 60 dBA. Open squares, circles, and triangles denote calculations with the interrupted noise masker with the long‐term spectrum of the female target speaker where the level of the noise was set to 65, 75, and 85 dBA, respectively. Figure 2.6 displays the SII as a function of SNR for stationary speech noise (filled symbols), and for the three conditions with 10 Hz interrupted noise used in de Laat and Plomp (1983, open symbols; noise at 65, 75 and 85 dBA). At low SNRs (between –15 and –35 dB), speech is entirely masked at moments when the masking noise is present, and it is audible in the gaps. Due to the gaps in the masking noise, values for the SII are relatively independent of SNR and are still quite large, in the order of 0.3. At even lower SNRs (below –35 dB), SII eventually decreases to zero, due to the fact that the speech signal will fall below the absolute threshold. Absolute threshold here has been taken equal to 0 dBHL. At an SNR of –15 and larger, portions of the speech signal start to exceed the noise signal, and SII increases. Again, at high speech levels, distortion occurs which causes the function to level off. De Laat and Plomp (1983) found
37
Extended Speech Intelligibility Index an SRT of –23 dB, ‐26 dB, and ‐29 dB at a presentation level of the noise of 65 dBA, 75 dBA, and 85 dBA, respectively. Figure 2.6 shows that for these conditions a large variation in the SNR causes only a slight variation in the SII. At time frames where the noise signal is present, no speech information is available; but at time frames where the noise masker is absent, the amount of speech information available is determined by the degree of temporal resolution (i.e., forward and backward masking) as well as by the absolute threshold of hearing. Nevertheless, while computations with the existing SII model give an SII of zero, the extended SII model results in values near 0.35. 1.0 0.9
SIM 4 Hz SIM 8 Hz SIM 16 Hz SIM 32 Hz Stationary noise
0.8 0.7 SII
0.6 0.5 0.4 0.3 0.2 0.1 0.0 -30
-25
-20
-15
-10
-5
0
5
10
15
20
SNR (dB)
Figure 2.7 SII as a function of SNR as calculated with the Extended SII model. Filled symbols denote calculations with a stationary noise masker with the long‐term spectrum of the female target speaker at a level of 75 dBA. Open squares, circles, diamonds, and triangles denote calculations with SIM noise as a masker at a level of 75 dBA, and a modulation frequency of 4, 8, 16, and 32 Hz, respectively.
38
Chapter 2
D. Sinusoidally Intensity‐Modulated speech noise Festen (1987) measured the SRT for sentences in 100 % Sinusoidally Intensity‐ Modulated (SIM) speech noise. At a presentation level of the noise of 75 dBA he found SRTs of –7.5 dB, ‐9 dB, ‐10 dB, ‐10.2 dB, and ‐4 dB for modulation frequencies of 4, 8, 16, 32 and “infinity” Hz (steady state), respectively. Figure 2.7 displays the SII as a function of SNR for stationary speech noise (filled symbols), and for four conditions with SIM noise used in the study of Festen (1987, open symbols). Computations with the extended SII model, given an SII of 0.35, result in SRTs of –10, ‐9, ‐8, ‐6,3, and –4 dB for the above‐mentioned conditions. The predicted SRT in a 4 Hz SIM noise with the extended SII model seems to be lower compared to SRT values obtained by Festen (1987). Furthermore, the predicted SRT in a 16 Hz or a 32 Hz SIM noise with the extended SII model seems to be higher compared to SRT values obtained by Festen (1987). Although the SRT values obtained with the extended SII model indicate an improvement over the existing model (which predicts an SRT of –4 dB for all conditions), there are still some deviations. So far, no explanation can be given for this result.
E. Multiple‐talker noise There are numerous papers dealing with the SRT for speech in the presence of one or more competing talkers (e.g., Festen and Plomp, 1990; Bronkhorst and Plomp, 1992; Bronkhorst, 2000; Drullman and Bronkhorst, 2000; Brungart, 2001; Brungart et al., 2001, 2002). It is generally observed that the SRT becomes worse as the number of competing voices increases (Miller, 1947; Carhart et al., 1969; Bronkhorst and Plomp, 1992), eventually resulting in the SRT for stationary speech noise. Bronkhorst and Plomp (1992) measured the SRT for sentences masked by speech‐shaped noise modulated by the envelope derived from one, two, four, or six interfering speakers. Observed SRTs were –9.7, ‐9.9, ‐7.2, and ‐ 6.4 dB, respectively. The stimuli, i.e. speech and fluctuating speech noise, were recorded with a KEMAR manikin and presented monaurally to the subjects.
39
Extended Speech Intelligibility Index
1.0 1 Talker speech shaped Noise 2 Talkers speech shaped Noise 4 Talkers speech shaped Noise 6 Talkers speech shaped Noise Stationary noise
0.9 0.8 0.7 SII
0.6 0.5 0.4 0.3 0.2 0.1 0.0 -30
-25
-20
-15
-10
-5
0
5
10
15
20
SNR (dB)
Figure 2.8 SII as a function of SNR as calculated with the extended SII model. Filled symbols denote calculations with a stationary noise masker with the long‐term spectrum of the female target speaker. Open squares, circles, diamonds, and triangles denote calculations with noise derived from a single, two, four, and six speakers speech shaped noise. The level of the noises was set to 65 dBA. Figure 2.8 displays for the four conditions of Bronkhorst (1992) calculations of the extended SII model as a function of the signal‐to‐noise ratio where it was attempted to simulate Bronkhorst and Plomp (1992) speech shaped noises. It shows that at an SII value fixed at 0.35, the SRT increases from –12 dB (for a single interfering speech shaped noise) to –6 dB (for six interfering speech shaped noises). Although the masking noises were regenerated, since the original masking noises of Bronkhorst and Plomp (1992) were not available, the trend is similar to that reported in the original study.
40
Chapter 2
0
Steady state 6 Talkers 2 Talkers
SRT Predicted (dB)
-5
SIMinf.Hz
SIM32Hz
4 Talkers
SIM16Hz
-10
Fluctuating
SIM8Hz
•
SIM4Hz
1 Talker
-15
-20 Interrupted 10Hz
-25 -25
-20
-15 -10 SRT Observed (dB)
-5
0
Figure 2.9 For a number of different masking noises, the SRT (dB) predicted with the Extended SII model is plotted as a function of the observed SRT (dB). Conditions are denoted in short in the figure.
IV. Discussion Figure 2.9 displays the relationship between the observed SRT (i.e. as measured in actual experiments) and the SRT as predicted by the extended SII model for all conditions described in the previous section, as well as some other conditions that will be discussed below. SRTs were calculated by taking the hearing loss fixed at 0 dB(HL) at all audiometric frequencies, and by setting the threshold value of the SII to 0.35. Different SRTs were obtained by taking the associated sample of the masking noise. The diagonal indicates the points where the observed and predicted SRT are equal. Points under the diagonal indicate an overestimation (with respect to performance) of the predicted SRT; points above the diagonal indicate that listeners generally perform better than predicted by the extended SII model. All predicted SRT values are within a few decibels of the diagonal, or even lie on the diagonal, indicating that the model
41
Extended Speech Intelligibility Index does well with the present set of data. The extended SII model yields a substantial improvement over the existing model. Since the latter is insensitive to modulations in the masking noise, it thus predicts for practically all conditions an SRT of –4.5 dB. The most important finding of this paper is that average speech intelligibility in fluctuating noise can be modeled by averaging the amount of speech information across time. If the data in Figure 2.9 are considered in detail, some of the results obtained with the SIM‐noises of Festen (1987) seem to deviate to some degree from the diagonal. Festen (1987) found lowest SRTs for modulation frequencies of 16 and 32 Hz. His finding is in contrast with most data from the literature that indicate maximum performance at 10 Hz (Miller and Licklider, 1950; Licklider and Guttman, 1957; Gustafsson and Arlinger, 1994; Trine, 1995; Bronkhorst, 2000; Nelson et al., 2003). The difference in the position of the minimum may be attributable to differences in stimulus type (gated noise versus SIM noise) and speech materials (word versus sentence scoring). There appears to be a large difference in the SRT results (about 16 dB) found by de Laat and Plomp (1983) and Festen (1987) obtained with about the same modulation frequencies [modulation frequency: 10 Hz; SRT: ‐26 dB for de Laat and Plomp (1983), compared to modulation frequency: 8 Hz: SRT ‐10 dB for Festen (1987)]. Festen (1987) suggested that this discrepancy can be due to the relatively broad and deep minimum in the interrupted noise compared to that in the SIM‐noise (Figure 2 from Festen, 1987). The SRT values, obtained with 16‐Hz and 32‐Hz SIM noise are very similar, viz., ‐10 dB, and are 2 to 3 dB better than predicted by the extended SII model. As for now, we have no explanation for this part of Festen’s (1987) data. Increasing the modulation frequency of the SIM noise results in gaps that are sufficiently small such that they start to fall within the time window of the extended SII model (i.e., smaller than 35 ms). This results in a decrease in performance, and finally performance will approach that of stationary noise. This condition is indicated by “SIMinf.Hz” in Figure2. 9, and is close to the diagonal. Decreasing the modulation frequency to 8 Hz also results in a point close to the diagonal. However, a further decrease of the modulation frequency to 4 Hz again results in a deviation from the diagonal. The overestimation of the 4‐Hz SIM noise may be accounted for by the fact that with these slow modulation rates, masking of complete words in a sentence can occur. This phenomenon has already been
42
Chapter 2 observed by Miller and Licklider (1950), who found optimal performance around modulation rates of 10 Hz. The mere fact that complete words are masked implies that the SRT procedure –where every word of the sentence needs to be repeated correctly– is unsuitable for these low modulation frequencies. Indeed, Trine (1995) shows that in the so‐called Just‐to‐Follow‐ Conversation (JFC) procedure, the signal‐to‐noise ratio keeps on decreasing below modulation rates of 8 Hz. In this procedure, the subject is asked to adjust the level of speech in a fixed given noise masker such that he or she is able to “just follow” the speech. This procedure does not require the intelligibility of individual syllables, words, or even sentences. Therefore, the optimum performance for 8 Hz is a procedural artifact. Hence to validate the extended SII model for masking noises comprising modulation rates of, say, 8 Hz and below, procedures other than the SRT‐procedure of Plomp and Mimpen (1979) should be utilized.
A. Effect of informational masking The extended SII model may not be able to predict SRTs accurately in conditions where speech and masking noise interfere at a higher level. One example of such interference is when both target speech and masking noise are derived from the same speaker. In that condition, the listener is confused since he or she does not know which signal represents the target and which components of the signal represents the masker. Festen and Plomp (1990) describe a number of conditions where speech is masked by a single speaker or by multiple speakers. Indeed, performance for speech intelligibility in time‐ reversed masking speech is better than for forward masking speech. This additional masking, on top of energetic masking, is called informational masking (Bronkhorst, 2000; Brungart, 2001; Brungart et al., 2001): The spoken message of real interfering speech accounts for a rise in SRT.
43
Extended Speech Intelligibility Index
0
SRT Predicted (dB)
-5 CB6
-10
SB3 B03
B24 B12
CB3
-15
SB6
B06
B02
-20
-25 -25
-20
-15
-10
-5
0
SRT Observed (dB)
Figure 2.10 The SRT (dB) predicted with the Extended SII model is plotted as a function of the observed SRT (dB) for the noise maskers used in Festen (1993). Conditions are denoted by abbreviations in the figure. In conditions B02 through B24, conditions consisted of speech fragments that were manipulated by shifting individual frequency bands of the noise masker independently over time. In conditions CB3, CB6, SB3, and SB6, half of the speech masker was replaced by stationary speech noise. For further details the reader is referred to the main text. In another experiment, Festen (1993) measured SRTs in other speech‐like maskers. The target speech was uttered by a female speaker (of Plomp and Mimpen, 1979). The interfering speech consisted of comparable sentences from a male voice (Smoorenburg, 1992). In the reference condition, the interfering speech signal consisted of a concatenation of sentences, with no pauses between the sentences. Five other conditions were derived from this reference condition by first dividing the masking speech stream into 2, 3, 6, 12, or 24 separate frequency bands, that next were independently shifted in time. One may see this masker as an addition of 2, 3, 4, 6, 12, or 24 speakers where the speech of
44
Chapter 2 the individual speakers do not overlap in frequency. The result is a masker that sounds very speech‐like. The measured SRTs as well as the SRTs calculated with the extended SII model are displayed in Figure 2.10. Different conditions are denoted as B02, B03, B06, B12, and B24, where the number denotes the number of frequency bands. The extended SII model appears to overestimate the observed SRT values of all conditions by 4 to 5 dB. Although speech and noise masker were well discernable, informational masking may have played a role, since the maskers still resembled running speech. In addition to these conditions, Festen (1993) generated other maskers, where the upper 1/3 octave of each frequency band in the 3‐ and 6‐band speech masker was replaced by noise of the same level as the time average of the original masker. Maskers therefore consisted half of stationary speech‐shaped noise. The modulated part was either synchronous in time (labeled in Figure 2.10 as “CB” for “constant bands”) or shifted in time (labeled in Figure 10 as “SB” for “shifted bands”). As can be seen in Figure 2.10, the extended SII model is able to predict the SRT of all these noise conditions (CB3, CB6, SB3, and SB6) reasonably well, probably due to the fact that the masker is less speech like. In summary, when speech like maskers are used, it is expected that the obtained thresholds are worse than predicted by the extended SII model due to additional (i.e., informational) masking.
B. Steepness of the psychometric function Festen and Plomp (1990) measured entire psychometric functions for speech in stationary and fluctuating noise. Given the larger dynamic range of fluctuating noise, one would expect a larger range in SNR in which the speech is audible, hence a shallower slope for the fluctuating noise masker. Indeed, with normal‐ hearing subjects, at the level for which a score of 50 % is obtained, Festen and Plomp (1990) found a slope of 21.0 %/dB and 11.9 %/dB for stationary noise and fluctuating noise, respectively. The present Figure 2.4, too, shows a shallower slope for fluctuating noise. With the extended SII model, it is possible to predict the slope of the curve obtained with fluctuating noise from that obtained with stationary noise. To that end, it first should be noted that for SNRs from –9 to –1 dB the psychometric curve with stationary noise in Figure 6 of Festen and Plomp (1990) ranges from 0 % to 100 %.
45
Extended Speech Intelligibility Index
percentage of sentences correct
100
80
60
40
20
0 -16 -14 -12 -10
-8 -6 -4 SNR (dB)
-2
0
2
4
Figure 2.11 Percentage of sentences correct as a function of signal‐ to‐noise ratio (dB), for a stationary noise masker (open symbols) and fluctuating noise masker (filled symbols) (replotted from Festen and Plomp, 1990). The two solid curves represent Festen and Plomp’s (1990) fit to the data. The dotted curve is predicted by the extended SII model, based on the curve given by Festen and Plomp (1990) for stationary noise. The dashed curve (without symbols) is identical to the dotted curve, except for a shift of 3.8 dB to the right. Figure 2.4 shows that this SNR range corresponds to a range for the SII of 0.2 to 0.5. An important observation hence is that within the range of 0.2 to 0.5 of the SII, sentence intelligibility changes from 0 % to 100 %. Within that range for the SII, both curves in Figure 2.4 can be well approximated by a linear function. The curve for stationary noise is given by
SII S = (15 + SNRS ) / 30,
(1)
the curve for fluctuating noise is given by
46
Chapter 2
SII F = (27 + SNRF ) / 40.
(2)
Festen and Plomp (1990) describe their curves with a logistic function
p( SNR ) =
1 1+ e
( M − SNR ) / S
,
(3)
where M is the SNR for which the probability on a correct response p(SNR) is equal to 0.5, and S is the steepness of the function at p(SNR)=0.5. For the stationary noise curve in Figure 6 of Festen and Plomp (1990), M=‐4.7 dB and S=1.19 dB (corresponding to 21.0 %/dB as given by Festen and Plomp, 1990). For the fluctuating noise curve, M=‐9.7 dB and S=2.10 dB (corresponding to 11.9 %/dB). The data of Figure 6 of Festen and Plomp (1990) are replotted in Figure 2.11, together with the two functions given by Festen and Plomp (1990), given as solid curves. When SIIS= SIIF, Equations (1) and (2) give the relation between SNRS and SNRF:
SNRS = (21 + 3SNRF ) / 4.
(4)
By insertion of Equation (4) into Equation (3), the shape of the function for fluctuating noise is obtained. This curve is plotted as a dotted line in Figure 2.11. The predicted curve for fluctuating noise has a slope of 15.6 %/dB and a value for M of –13.3 dB. The curve is about 3.8 dB to the left of the data of Festen and Plomp (1990), but has a slope that fits very well to the data of Festen and Plomp (1990), as can be seen when the curve is shifted 3.8 dB to the right, as has been done in Figure 2.11 (dashed curve). The slope fits their data even better than their calculated slope of 11.9 %/dB. The fact that the calculated curve does not fall on top of the data of Festen and Plomp (1990) is due to the fact that Festen and Plomp (1990) shifted their data to the average results.
47
Extended Speech Intelligibility Index
1.0 0.9 0.8 0.7
Col 1 vs Col 2 Col 1 vs Col 3 Col 1 vs Col 4 Col 1 vs Col 5
SII
0.6 0.5 0.4 0.3 0.2 0.1 0.0 -50 -45 -40 -35 -30 -25 -20 -15 -10 -5
0
5 10 15 20
SNR (dB)
Figure 2.12 SII as a function of SNR as calculated with the extended SII model. Filled symbols denote calculations with the absolute threshold set to 0 dB(HL). Open symbols denote calculations with the threshold set to 15 dB(HL). Circles and triangles indicate calculations with a stationary noise masker and squares indicate calculations with interrupted noise masker, respectively, both with the long‐term spectrum of the female target speaker. The level of the noises was set to 65 dBA
C. Effect of absolute threshold With the calculation of the SII, it was assumed that all subjects had normal‐ hearing, that is – thresholds for all frequencies were taken equal to 0 dB(HL). In real life, thresholds deviate to some degree from this value, but with the normal‐hearing group it is generally assumed (ANSI S3.6‐1996, 1996) that the hearing level is equal to or less than 15 dB(HL). Given the dynamic range of speech (30 dB) and the presentation level of the masking noise one can calculate the effect of an elevated threshold. With stationary speech noise as a masker, audibility of average conversational speech starts to play a role only at losses of 50 dB(HL) and larger, as can be calculated with the existing SII model. In contrast, with fluctuating noise and interrupted noise, effects become already
48
Chapter 2 noticeable at thresholds of 30 dB(HL) or 15 dB(HL), respectively. The effect of hearing loss on the SII is depicted in Figure 2.12 for both a stationary noise masker and an interrupted noise masker. As can be seen in this Figure, elevating the threshold from 0 to 15 dB(HL) has no effect on the SII with stationary noise, but has a clear effect with interrupted noise. The two curves with interrupted noise start to overlap near an SNR of –15 dB. For the calculations with the extended SII model, little differences in prediction of the SRT in stationary noise were found by variation of the absolute threshold (HL 0.05). None of the interactions were significant.
59
Informational Masking The difference in SRT between the two conditions with Swedish speech was significant (Tukey’s HSD test, z=2.4, p=0.02) and was on average 2.3 dB. Thus, by time reversing speech, the SRT increases (i.e., performance worsens) from – 13.9 dB to –11.6 dB. The difference between the two conditions with Dutch interfering speech was also significant (Tukey’s HSD test, z=4.28, p