Modeling user search on a website by contextual graphs Patrick Brezillon*, Laure Léger** and Charles Tijus** * LIP6, Case 169, University Paris 6, 104, avenue du Président Kennedy, 75016 Paris, France
[email protected] ** Cognitions Humaine et Artificielle, University Paris 8 2 rue de la Liberté, 93526 St Denis, France
[email protected],
[email protected] RÉSUMÉ.
Ce papier présente un travail sur la comparaison entre un modèle utilisateur et le comportement réel de l’utilisateur qui repose sur trois prémisses. Premièrement, tout système interagissant avec un utilisateur possède un modèle de celui-ci. Deuxièmement, la représentation externe des utilisateurs dépend de l’utilisation qui est faite du système par l’utilisateur. Troisièmement, connaître le type d’utilisation du système dépend du contexte dans lequel la tâche doit être exécutée. L’explicitation du contexte en vue de son utilisation conduit à utiliser les graphes contextuels pour capturer les comportements effectifs des utilisateurs dans une activité de recherche d’information sur un site Web scientifique. Nous avons étendu les capacités d’un système d’aide dans une étude préliminaire basée sur une technique de repérage de mouvements oculaires en couplage avec la représentation en graphes contextuels. Cette approche permet de composer avec un système capable d’acquérir de manière incrémentale de nouvelles connaissances de l’utilisateur, et qui peut ainsi apprendre de nouvelles pratiques développées par les utilisateurs quand il est en échec. ABSTRACT .
This paper presents a work on a comparison between a user model and user’s behavior based on three premises. First, any system includes a representation of its users. Second, the external representation of users in a system is related to how the system is used by users. Third, knowing how to use the system depends on the task context. For making context explicit in order to use it, we use contextual graphs to capture the effective behaviors of users in an activity of information retrieval on a scientific website. We show how such a context-based representation may help to predict the search behavior of visitors to the website pages. We extend the capability of the system by a preliminary study based on a technique of eye tracking coupled with the contextual-graph representation. This approach allows dealing with a system that is able to incrementally acquire new knowledge from the user and learn new practices when the system is in a situation of failure. : Modélisation de l’utilisateur, management des contextes, graphes contextuels, eye-tracking, navigation sur un site Web. MOTS-CLÉS
KEYWORDS :
User modeling, context management, contextual graph, eye tracking, web-site
navigation
Revue. Volume X – n° x/année, pages 1 à X
2
Revue. Volume X – n° x/année
1. Introduction The Internet and World Wide Web are expanding exponentially. As a consequence, the volume of available information is becoming particularly large and the amount of redundant information dramatically magnifies it, even if this ensures the possibility of retrieving any specific item of information rapidly. As a consequence, the user faces a number of information-retrieval problems. There are different aspects of these problems. A first aspect is the lack of knowledge about information location. Finding where a given information piece is located requires supplementary effort, which generally corresponds to an additional task. A second aspect concerns the surface properties of information (e.g. labels used for denoting a piece of information). For example, French people speak of mondialization, when the requested information can be found under the topic of globalization. A third aspect is about the information context, i.e. the meaning that can be inferred from the data. Two different persons may interpret the same data in different ways. A temperature of 24°C in winter is hot in France, but cold in Brazil, because the two contexts are different. Thus, information may not be found (e.g. hot seasons) because its context is not taken into account. A fourth problem concerns the fact that users may have difficulty expressing their queries and afterwards represent them within the imposed formalism of the search engine. Frequently, users do not have a clear idea of their needs. For instance, you may be interested in the role of context in computing matters. A search engine will guide you towards “context-aware applications”, or “context-awareness”, but you will not easily access “ubiquitous computing” because you do not know precisely in which terms the search engine classified this expression with respect to your own keywords. Moreover, users may use synonyms that are closer to, or further from, the desired information from the system point of view. Thus, two concepts may be close in one context and distant in another context. Conversely, we would not expect a Webmaster to face such difficulties when using his own website. For instance, to complete a product order and send it via the delivery centre to customers, the webmaster needs to ask for the customer ID, their address, the number of products, then display how much the customer needs to pay and request their credit card number. The customer, however, first wants to know the price they have to pay. Such a system captures the representation of the Webmaster much more than the representation of the user. This is the well-known gap between logic of functioning and logic of use (Richard, 1983), prescribed and effective tasks or task and activity (Leplat and Hoc, 1983), procedures and practices (Brézillon, 2005), etc. We conducted an experiment involving science museum web sites. The goal was to test the adequacy of what these web sites offered in relation to different users’ demands. An interesting and important feature of the Web is that it operates under the hypothesis of a closed world in which the effective task (practice, etc.) appears as part of the prescribed task (or procedure, etc.). A website proposes a lattice of
Modeling user search by contextual graphs
3
paths and the user can invent for a given goal a given path corresponding to her/him effective task (or practice) within the lattice, but cannot create a non-existent path by modifying the lattice (i.e. the website). Our experiment aimed to study the different ways that a user can develop in order to access information. All the possible paths on a website were identified from the links existing on the different pages. We then defined different types of search task, knowing the minimum distance in terms of clicks from the home page at the start of the scientific website through to the target page where the answer could be found. Participants could use only the mouse and not the keyboard, and thus could not look for the answer using a search engine. Then, we compared the effective path, in which each participant reached the target page, with the prescribed path (the shortest path). The main difference between the users' choice and the optimal path was a difference in context, i.e. the arguments that were taken into account by the participants when choosing one option from many other options. This provided a model of the effective tasks across several participants. Models of both prescribed and effective tasks have been represented within the formalism called Contextual Graphs, which gives a uniform representation of the elements of reasoning and of contexts (Brézillon, 2005). There is an increasingly interest in context within the domain of modeling users' information retrieval. The role of context was studied in the WebCSTI project by linking participants' oculomotor behavior to task context. Participants' oculomotor behavior was recorded using an eye tracking technique. This consisted of recording eye movements whilst the user searched for contextual information on a web page. Thus, we identified the sequence of different areas that the user looked at during the search. Thereby, we inferred the different possibilities the user considered before s/he chose the link to be activated by clicking on it. We finally inferred the path within the contextual graph that best modeled user behavior. Hereafter, the paper is divided in three parts. First, we present the background of our study about the website usability evaluation method that we used, the eye tracking technique and Contextual Graphs for modeling user’s behavior. Second, we discuss the experiment in which we associate users’ effective behaviors in the contextual-graph representation with their oculomotor behaviors. Third we conclude with a discussion on our results, and the interest of coupling Contextual Graphs and oculomotor behavior. 2. Background 2.1. Website usability evaluation Evaluation of the web interface consists in locating error, redundancy or illogical situation that should be corrected to increase the interface usability. Evaluation consists in an effective confrontation of the logic of use against the logic of functioning.
4
Revue. Volume X – n° x/année
Usability is a key factor of quality of a web application. It concerns the level of facility for using the application. For Nielsen (1993) the system usability should satisfy three criteria: -
The effectiveness which concerns the accuracy and completeness with which user achieve specified goals, - The efficiency, which concerns the cognitive processes to achieve specified goals, and estimates the cognitive resources necessary for this goal, and - The satisfaction, which consists in the comfort and the acceptability of the use of the system. Thus a usable interface facilitates user’s activity to achieve goals (effectiveness), the means to achieve it (efficiency) and provides pleasure or comfort in the use (satisfaction). The effectiveness is generally measured by error rate or by user’s actions. Efficiency is evaluated by temporal measure such as time spent for reading or for information retrieval. Satisfaction is measured by questionnaire where user gives their feeling about the interface. Nielsen (1993) presented five principles that should be respected for increasing the website usability. There are several methods to evaluate the website usability (Baccino et al., 2005; Matera et al., 2006). This evaluation could be performed at different moments of the interface production: during the design, the development or the final interface. Different types of participants may intervene: web designer, web usability specialist, end-user. The type of gathered data could be quantitative or qualitative. Matera et al. (2006) classify these different methods in two classes: -
User testing. The user is confronted to the interface by performing a particular task such as finding particular information, filling an on-line form etc. The analysis concerns the error occurring from the action made by user (mouse click, keyboard use), different links followed by user, the time required to perform the task, etc. In some cases it could be also possible to analyze eye movement made during the task.
-
Usability inspector. Two common techniques could be used: heuristic evaluation and cognitive walkthroughs. The heuristic evaluation (Nielsen and Molich, 1990) consists of inspecting an interface by judging whether the application properties conform to established usability principle. This method allows detecting quickly the major problem of interface usability. The cognitive walkthrough (Blackmon et al., 2002; Polson et al., 1992) consists of simulating the different actions made by the user when s/he interacts with the interface. This allows studying if functions of the interface are efficient for users (see Matera et al., 2006 fore more details of these two methods).
In our work, we confront a usability inspection method to a user testing. This comparison is between the psychologist reality and a computer model. We used a model based on the user context to lead this comparison based on a representation
Modeling user search by contextual graphs
5
by Contextual Graphs (Brézillon, 2005) and a user testing analyzing eye movements made when a user explores a Web page. 2.2 Eye tracking Eye tracking is a method of investigation used in different domains, such as cognitive psychology for analyzing the mental processes involved in reading. Rayner (1998) proposes a large review on eye-tracking use, or eye-movement analysis in cognitive psychology, e.g. concerning marketing by observing if an advertisement's message has been viewed in HCI ergonomics, or concerning website usability by studying how a participant explores a website to determine where information is located. Eye-tracking consists in the recording of eye-movements whilst a participant performs a task. Generally, information retrieval is a key activity on the Web, which involves visual search. In this case using the eye-tracking method consists of analyzing eye-movement whilst participants search for particular information. In this activity, the eye-tracking method allows the exploration of two components of visual search (Goldberg and Kotval, 1999, Jacob and Karn, 2003; Poole and Ball, 2006), namely the exploration of the interface and the processing of objects on the interface. Exploration corresponds to the transition between different areas of the site page, such as the navigation menu, text, URLs, images, video. The eye-tracking method enables the identification of the areas viewed by participants, the areas never explored by them, and the first area to be explored, etc. Interface-object processing leads to the extraction of information from the site. Its goal is to search for particular information in order to decide if the information viewed is the target of our search (our goal), or only a sub-goal of this search: the link that allows us to reach the target. For example, if we search for weather forecast next week-end in Paris, we begin by clicking on the link “weather forecast” before selecting the desired time and place. In this approach, a fixation occurs when eyes fix a specific area of the user interface, and a saccade is a movement between two fixation points. Using eyetracking, we obtain a scanpath that is a sequence of fixation-saccade. Saccades could be progressive, towards an unexplored area, or regressive, towards a previously looked area. Whereas saccades allow eye gaze to move towards an interface area, it is during fixation that information is processed. The more difficult is the information to extract (identify, understand), the longer is the fixation time. The fixation sequence is an indicator of the sequence of areas viewed by the participant before s/he found what s/he was looking for. To summarize, the eye-tracking technique allows us to know where a participant looks, how long s/he looks at a part of the screen and how s/he looks at this part or this object on the interface. The use of eye tracking in the study of users’ behaviors during an information search on the web allows knowing which area of the page the user looks at before deciding to click on a link. Eye-tracking methods lead to
6
Revue. Volume X – n° x/année
identify the different possibilities considered by the user (e.g., the choice between different links), even if s/he clicked only on one link, as well as the items that have been considered as possible targets (Leger et al., 2005). For our study the relevant eye movement data analyzed were the localization of the fixations in terms of the areas of interest of the home page of the website. 2.3 The context-based representation formalism Contextual Graphs A Contextual Graph (CxG) is a context-based representation of how to execute a procedure, i.e. a problem solving. A contextual graph represents the different ways to solve a problem. It is a directed graph, acyclic with one input and one output and a general structure of spindle (Brézillon, 2005). A path in a contextual graph corresponds to a specific way (i.e. a practice) for the problem solving. It is composed of elements of reasoning and of contexts, the latter being instantiated on the path followed (i.e. the values of the contextual elements are required for selecting a branch, i.e. an element of reasoning among several ones). Different solutions can be associated with a unique output, e.g. in information retrieval: you can abandon, copy, or save a page before closing the window, but all of these lead to the same conclusion, the end of the page exploration. A CxG is an acyclic graph because the user's tasks are generally in ordered sequences. For example, the activity “Open a new window when clicking on a link" is always considered at the beginning of an exploration operation, and never after clicking. A more drastic divergence in the type of output, e.g. the execution of the task is terminated, as in "Error 104" in information retrieval must be considered at an upper level in which the CxG at hand is a sub-graph on a branch that is an alternative of another path (a contextual element such as “Are the conditions required for task execution present? If yes, go to the CxG, otherwise do not consider this contextual graph.”) The elements of a contextual graph are actions, contextual elements, sub-graphs, activities and parallel action groupings (Brézillon, 2005). The action is the elementary task. A contextual element is a pair of nodes, namely a contextual node (1, N) and a recombination node (N, 1), where N is the number of instances (or practices) of the contextual element. A sub-graph is itself a CxG, and the activity is a particular type of sub-graph identified by human actors as a recurrent structure in CxGs. The temporal branching expresses the fact that several groups of actions must be accomplished, but the order in which action groups must be considered is not important, or even could be done in parallel, however all actions must be accomplished before continuing. This is a kind of complex contextual element, in the same way that an activity is a kind of a complex action. In order to consider the relevance of contextual graphs for modeling participants’ behaviors, we mapped ocular-fixation sequences onto the contextual graph built from the considered scientific website. In this case, eye-tracking allowed to know which areas of the homepage a participant had considered and if the sequence of
Modeling user search by contextual graphs
7
ocular fixations corresponded to a path in the contextual graph. Indeed, if the path concerns contextual elements contained in the homepage such as links or different areas of the homepage (text, picture images, etc.) and if the sequence of fixations revealed that the participant looked at these contextual elements before clicking, then the corresponding path can be associated with the participant's behavior. In one of the experiments, the answer to the question could be reached in two ways. Thus, it was important to determine the probability of use for each way. This could lead to improvements of the website, not only from the user's viewpoint, but from the designer’s viewpoint too. 3. Identification of users’ behavior from contextual graph and eye tracking techniques WebCSTI was a project that brings together cognitive psychologists, computing researchers, and researchers in semiotics. This project aimed to allow institutions that disseminate scientific and technical information to evaluate the use of their websites and to understand the dynamics of their field. One of our tasks in this large project was twofold. First, we analyze sequences of ocular fixations, eye pauses on web pages for the purposes of information processing, in order to model how participants browsed the Web pages of the site. Second, we associate eye fixations with participants’ behaviors, which were modeled within the contextual graph formalism. Nine scientific websites were selected for modeling how users browse websites containing scientific and technical information. Our study concerns one of the nine scientific websites. Users’ behaviors were modeled from an experiment with 27 participants that had to answer different questions by browsing the website (only with the mouse) starting from the homepage. Only nine participants performed a particular information retrieval on the website chosen for the experiment. An initial interview allowed judging the level of the participant’s expertise on Internet use. Participants in the experiment were selected based on their experience in web search, but not in particular on scientific web search. Eye movements of the nine participants were recorded. The combination of eye fixations and their sequences allowed identifying different areas of the homepage that participants fixed before making the decision to click on a link. This observation was then associated with participants’ behavior and represented within a contextual graph. 3.1 A Case Study: searching for information within a Web Science Site The Web Science Site is a public website that we studied in 2006 (the Web site is now totally different). It belongs to the network of French Centers of Scientific, Technical and Industrial Culture. About twenty people work at this center “for the discovery and understanding of scientific phenomena, technological principles, industrial applications and know-how”. The activities of the Center are wide-
8
Revue. Volume X – n° x/année
ranging: exhibitions, workshops, education, publications, movies, and contributions to the “Fête de la Science” (a national event in France). The objectives of this scientific website are: -
To respond to educational enquiries; To support the dissemination of technical and scientific information; To promote the technical and scientific abilities of a region of France.
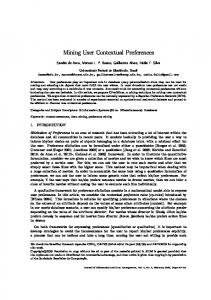
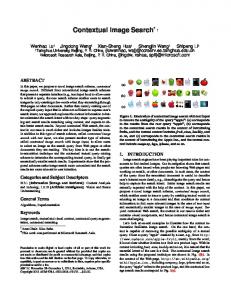
Figure 1. Homepage of the Web Scientific Site in 2006 There were different issues to consider. First, the website was more for regular visitors than new visitors. For instance, the home page (see Figure 1) contained a link to “Hangar 20” (i.e. Repository 20), whose name was not self-explanatory with regards to its content. Second, the website was not constructed by professionals. For example, there was a long list of emails that can be retrieved by any softbot. Third, some strange behaviors were observed when loading web pages. For example, when a new window was opened after a click on a link, the homepage appeared first briefly (2-3 seconds) before the required page. This seriously limited an automatic analysis of the website. Fourth, the site map was organized in width first (i.e. there was a long list of items and a depth of 3 maximum). As a consequence, information on the site was poorly organized and badly structured. A part of our study concerned participants’ behaviors when answering the question (a one-click question but participants did not know this): “What is the price of a simple ticket for Arthur’s Workshop?” The name “ Arthur’s Workshop” (Atelier d’Arthur in Figure 2) did not appear on the homepage (Figure 1), and there are two ways to reach the answer on the target page in one click, but semantically intractable from the homepage. Figure 2 displays the target page with the answer that can be
Modeling user search by contextual graphs
9
obtained by scrolling down or by clicking on “opening times”, a link located in the menu on the left-hand side.
Figure 2. The target page where the solution has been highlighted with a rectangle frame that does not appear on the user interface. We conducted our Protocol in two steps. First, we proceeded in an exhaustive analysis of the website in order to determine all the paths leading to the target page displaying the answer from the homepage. Thus, we were sure that participants’ behaviors would be represented in the prescribed-task model. Second we studied a group of participants by analyzing, on the one hand, their behaviors and representing them within Contextual Graphs, and, on the other hand, by recording the movement of their eyes with the eye-tracking equipment. An important point in our study is that we adopted participants’ viewpoint, not the viewpoint of an external observer, which means that we computed the possible paths according to the participants’ goal. Contextual Graphs allowed us to represent any search completed by the participants: correct procedures in one or several clicks as well as failures, the wrong assumptions made by participants and to compute differences between the prescribed task and the observed effective tasks. However, our main findings pointed out that the task of searching for an item of information must interest and motivate participants, and that participants used their experience and expectations about the website to guide their search. 3.2 Analysis with contextual graphs The target page, which contained the answer, was accessible from the website homepage in two ways, namely from “Hangar 20” and “Horaires” (see Figure 1). For instance, the information that ”Atelier d’Arthur” was in ''Hangar 20'' is unknown for a visitor coming for the first time. However, we were more concerned in our study by the syntactical aspects than the semantic ones.
10
Revue. Volume X – n° x/année
We conducted two complementary studies using the contextual-graph formalism. The first study concerned the effective behavior of some participants. The second study tried to determine the set of all possible behaviors in an exhaustive way, i.e. all the possible paths from the homepage, with some trails leading to the answer, others not. First, the contextual graph of effective behaviors corresponds to a model of observed paths within the website, while the contextual graph of prescribed behaviors (the two paths leading effectively to the answer in one click) is a subset of observed paths. Second, a path in a contextual graph represents the reasoning involved in testing a hypothesis. If this hypothesis fails (or the solution is reached in more than one click), then a new hypothesis must be formulated and a new path will be followed within the contextual graph. Thus, each path represents one way for answering the question, and a given user may use different paths, in successive trials, before reaching the solution on the target page. 3.3 The contextual graph of effective behaviors Figure 3 represents the contextual graph of the effective behaviors of participants.
C1: Do you know where to look for? Yes 2: Easy to find? Yes 1: Click on "Time schedule, Prices, Parking" 2: Scroll down in the window No 3: Click on "Hangar 20" 4: Look for "Arthur's Workshop" 5: Click on "More" No 6: Look for "Arthur's workshop" 3: Is there "Arthur's workshop"? Yes 4: Is there a "Prices" item? Yes 7: Read the price for a single ticket No 8: Note the lack of information 9: Abandon the hypothesis No 5: Is there something like "Workshop"? Yes 10: Click on "Events" 11: Look for "Arthur's workshop 12: Note the lack of information 13: Abandon the hypothesis No 6: Is there "Events"? No 14: Note the lack of information 15: Abandon the hypothesis
Modeling user search by contextual graphs Yes
11
16: Click on "Events" 17: Look for "Arthur's workshop" 7: Is there a "Prices" item? Yes 18: Read the price for a single ticket No 19: Note the lack of information 20: Abandon the hypothesis
21: Read the price for a single ticket
Figure 3. The contextual graph of participants’ effective behaviors. The main results observed on participants’ behaviors are: -
A price is a (relatively) stable information at a general level. Thus, the answer should neither be in the news or exhibitions pages nor in the satellite exhibitions like “Hangar 20”, “Cap Archéo” or “Fête de la Science”.
-
The terms “Arthur’s Workshop” and “Prices” did not appear on the homepage; it is possible that “location” was strongly related to “Prices” because we have to pay only if we go effectively to the museum. Thus, “price” and “location” would be on the same page.
-
Variations in participants’ behaviors were at the level of contextual elements (Brézillon, 2007). For example, “In my professional area, a workshop is a oneday event and thus like an exhibition” or “Workshop in places as a museum is a word used for children’s activities, thus the desired information would be given on the teachers’ page”. We thus had a kind of user-centered contextual indexing that could help to guide the organization of information on the website.
-
Knowing that the number of clicks must be minimal, this influences participants' choice of a strategy. For one click, the participant will try to associate the key elements of the question, here, the price, as directly as possible with information on the homepage, because the answer was supposed to be on the “following web page”. This could mean that the participant associated “price” with “contact”, because it was certainly the contact that establishes the price of the ticket. Other strategies could be the use of a search engine, to find a synonym, or to find a similar category.
-
Half of the eight paths lead to the answer in one or two clicks (because you know that you click once to go on the site-map page and then need another click to reach “Atelier d’Arthur” part, if you find it), while the other half corresponded to wrong assumptions.
3.4 The contextual graph of prescribed behaviors Figure 4 represents the contextual graph of the prescribed procedures.
12
Revue. Volume X – n° x/année
1: Knowing where to look for? Yes 2: Which item? Time schedule and prices 1: Click on Time schedule and prices Hangar_20 2: Click on Hangar_20 Event location 3: Click on event location Teacher entrance 4: Click on teacher entrance Agenda 5: Click on agenda Time Schedule 6: Click on Time Schedule 3: Type of move on the page? scrolling bar 7: Go down to find "Atelier d'Arthur" on item 8: Click on item "Atelier d'Arthur" 9: Click on "More about..." 10: Read the price for individuals No 4: Is there a site map? No 11: Look for item "Atelier d'Arthur" 5: Is an item "Atelier d'Arthur" visible? Yes 6: Do you see a price? Yes 12: Read price for an individual No 7: Is there a link? Yes 13: Click on item "Atelier d'Arthur" No 14: Revise hypothesis for another place No 8: Is there the word "Atelier" (workshop)? Yes 15: Click on the item "events" 16: Identify the impasse (Wine workshop) 17: Modify the hypothesis No 9: Is there the word "event"? Yes 18: Click on the item "events" 19: Identify the impasse ("Wine Workshop") 10: Do you see a price? Yes 20: Read price for an individual No 11: Is there a link? Yes 21: Click on item "Atelier d'Arthur" No 22: Revise hypothesis for another place No 23: Revise hypothesis on location Yes 24: Click on item "site map" 25: Look for "Atelier d'Arthur"
Modeling user search by contextual graphs
13
26: Click on item "Atelier d'Arthur" 27: Look for individual price
Figure 4. The contextual graph of prescribed procedures. For prescribed tasks or procedures, we represented all the ways of navigating through the website in a contextual graph. This corresponded to an “intelligent” site map for prescribed procedures. Among all these paths, there were all the solutions for reaching the answer on the target page. Again, our concern was the syntax and not the semantics of the website's design. The following observations can be made from this study: -
It was not possible to automate the study, because the way in which the website was built does not allow this. For example, opening the content of a link in a new window had the side effect of opening the home page for a few seconds first. - The site map was a good abstraction of the website, but did not help the participant because of the site's flat organization. The site organization was designer-oriented, not user-oriented. - Putting items like prices and opening times together allowed the designer to reduce the depth of the website; mixing syntax and semantics was confusing for the participant, and the use of synonyms did not help the participant. - The choice of key words in the question (i.e. the way in which the question is formulated) was crucial. Prices and Arthur’s Workshop did not have the same impact on participants’ search. - Looking first for Arthur’s Workshop implied an additional click to find Prices through En savoir + (To know more). - Of the twenty-one paths that existed on the website, fifteen paths lead to the answer by up to three clicks. The contextual graph in Figure 3 is included within the contextual graph of prescribed behaviours (Figure 4). 3.5 Eye movement analysis in association with the contextual graphs A path in the contextual graph corresponds to the test of a hypothesis. This test was elaborated from information gathered by the participant on the web page. For each path in the contextual graph starting from the homepage, it was possible to identify different areas to be clicked. We correlated these different ways in the graph with the different areas on the homepage that the participant looked at before clicking. These areas were (ordered from the most to the least important area): Event (événement), opening times/price list (horaire/tarif), teacher access (accès enseignant), Hangar 20 (Hangar 20), site map (plan du site), Opening times in the lower menu (menu horaire), agenda (agenda), event location (localisation d’un événement), Hangar 20 menu (Hangar 20 menu). The same link could be located twice as Hangar 20 (as a link and an item within a menu). This division of areas on the homepage allowed us to identify if a fixation involved one of these areas or not
14
Revue. Volume X – n° x/année
and trace for each participant the scan path (the sequence of fixations) defined by a sequence of fixed areas. For each participant, we then compared this scan path (translated into a sequence of fixated areas) to the paths described in the contextual graphs. Three paths in the contextual graph were identified. These paths lead to the target page with the answer to the question (called Path-1, Path-2 and Path-3 in Figure 4). We were able to compare each participant's scan path to the three paths of the contextual graph and identify among these paths, the major path followed by each participant. We computed to what extent the behavior of the entire group of participants was represented within the contextual graphs in the same ordered set of actions. This comparison was made using correlation analysis (Bravais-Pearson r test, see Howell, 1998) to obtain the correlations between ocular scan paths and paths predicted from the contextual graph for each participant. For each participant, we obtained three correlation scores (one for each of the three paths). A higher score corresponds to the closest path followed by the participant. These correlation scores are presented in Table 1. Table 1. Correlation (Bravais-Pearson r value) between the three main paths in Figure 4 and participants' eye tracking while searching for information on a website. Users U1 U2 U3 U4 U5 U6 U7 U8 U9
PATH-1 0,38 0,20 -0,61 -0,20 -0,37 0,33 -0,76 -0,22 -0,22
PATH-2 -0,09 0,05 0,98 0,55 0,91 -0,13 0,61 0,88 0,76
PATH-3 -0,09 -0,10 -0,08 0,10 -0,05 -0,04 0,61 -0,42 -0,34
The participants' behaviors were then matched with paths within the CxGs. When participants’ eyes stop on zones to be clicked without clicking, this meant that participants did not recognize it as a proper link. The required information was hard to find because the website was not userfriendly. Thus, the task was similar to problem solving. Paths PATH-2 and PATH-3 correspond to the paths of participants who did not know where to find the information after the contextual Node PATH-1 “Do you get any idea of where to find the information: no”.
Modeling user search by contextual graphs
15
Eight out of nine participants followed paths that matched the PATH-2 and PATH-3 paths. The different correlations showed that five participants followed PATH-2 in the contextual graphs, while two participants followed another path PATH-1. For one participant (U7 in Table 1) we could not decide between two paths, and for another participant (U2 in Table 1) we did not see the emergence of a path. The r value of .20 was not high enough to enable us to decide which of the corresponding paths was closest for this participant. This shows that by assembling results obtained with Contextual Graphs and those obtained by the eye-tracking technique, it is possible to determine how to change a website to improve its ergonomics. Indeed, path PATH-3 in the CxG graph made reference to counterintuitive links. Participants supposed that the information “ticket price for Arthur’s Workshop” was to be found within general information about tickets, or within specific information about a permanent museum activity. This was asserted by clicks on general information links or on links denoting location (e.g. Hangar 20). As they did not find the information, from many possible links, participants choose to select “Events”, which finally belonged to PATH-2, and was the correct link to activate. We think that this behavior is related to a counterfactual reasoning: “if the information was not about a permanent activity.” 4. Discussion and conclusion This study allows relating the cognitive walkthrough made with the model of user’s behavior represented by the contextual graph when navigating on the web site to real user’s behavior studied by the oculomotor behavior. This usability inspection and user testing combination address a great disadvantage of the cognitive walkthrough. Accounting for user’s behavior allows identifying action effectively made by the end-user. A contextual graph is the representation of a problem solving by one or several users having to accomplish the same task (i.e. a given problem solving). A microcollaboration appears by the refinement of the contextual graph when a practice (i.e. a path in the contextual graph) is enriched by ramifications from addition of a contextual element. It would be possible to consider a “macro-collaboration” when several persons with different roles and tasks work in coordination if (1) the task of each person can be described by a contextual graph, and (2) the collaboration between persons can be represent as interactions between different contextual graphs: An action executed by a person in a contextual graph corresponds to the action of another person in another contextual graph, each contextual graph representing the accomplishment of their specific task. For the study of a user interacting with a “closed world”, such as a web site in which the user cannot create either new links or new pages, our approach is interesting because all the effective behaviors considered are within the set of
16
Revue. Volume X – n° x/année
prescribed behaviors. Thus, the problem at hand for having a smart system, is to reduce the set of effective behaviors to the best subset of prescribed behaviors. As users' behaviors depend to her/his understanding of how the task might be accomplished, studies on the use of the Web have to take into account (1) the designer of a website, (2) the user viewing the website, and (3) how the user’s task can be accomplished. This study points out the importance to separate clearly the user from the task realization and thus identify four key elements (i.e. the user, the task, the website, and the website designer) that characterized the context of users’ behaviors. First, the task directing the user on a website will constrain the way in which the user will explore that site. The quality of the user’s understanding of the question. A user can ask a very narrow question with specific key words, or may just want to “surf” the Web with no clear idea of what s/he is looking for (Brézillon, 2005). Thus, the way in which a question is asked, and the references used (e.g. prices or Arthur’s workshop), will constrain users’ reasoning. Second, search is affected by the level of users’ interest in the task, which is a different matter to the level of their understanding. Knowing the price of an exhibition is certainly more important than knowing the name of the organizers of the exhibition for the user’s viewpoint. This was particularly true in this study participants having access only to the mouse, not the keyword or search engines. However, in usual situations it is often easier to ''Google'' the answer (i.e. get the answer from an external viewpoint) than use local help support. In the WebCSTI project, we showed that Google provides the answer to a three-click question directly (i.e. similar to one click). Third, users’ navigation is related heavily on their experience of the Web, and website organization in general. Here, users’ expectations are important. In usability studies, it is shown that the top right hand quarter of the window is the first area that users look at. The position of information items in the window depends on their specificity (e.g. the left column contains the first-level items in the menu, while second-level items appear in another place). Any originality in site organization will lead the user to make an effort to look for information. After the lost in space, this is the lost in a page. Again, logic of functioning is not logic of use (Richard, 1983). Fourth, going on a website to search for information is one of the user's main activities. For instance, when writing a paper and wanting to introduce a reference, a writer may temporarily interrupt her/his work to look on the Web (or in her/his folder) for the exact reference. This means that generally one arrives on a website with a question associated with its context that gives a meaning to the question and provides elements for building the answer. For example, looking for Museum address will depend on information about When do I plan to visit the Museum? and Have I time to go and visit the Museum?, etc. Brezillon and Pomerol (1999) showed that the difference between contextual knowledge and a proceduralized context comes from the fact that a proceduralized context is a subset of contextual
Modeling user search by contextual graphs
17
knowledge that is assembled, organized and structured to address the focus at hand, here, the question in a kind of chunk of contextual knowledge. 6. References Baccino, T., Bellino, C. and Colombi, T. (2005). Mesure de l’utilisabilité des interfaces. Paris: Hermès. Blackmon, M. H., Polson, P.G., Kitajima, M., and Lewis, C. (2002). Cognitive Walkthrough for the Web. Proceedings of human factors in computing systems, CHI 2002 (pp. 463470) New York: ACM. Brézillon, P. (2005). Task-realization models in Contextual Graphs. In A. Dey, B.Kokinov, D. Leake, and R. Turner (Eds.), Modeling and Using Context (CONTEXT-05), (pp. 55-68). Berlin: Springer Verlag, LNCS 3554. Brézillon, P. (2007). Context Modeling: Task model and model of practices. In B. Kokinov, D.C. Richardson, T. Roth-Berghofer, and L. Vieu (Eds.), Modeling and Using Context (CONTEXT-07), (pp. 122-135). Berlin: Springer Verlag, LNAI 4635. Brézillon, P. and Pomerol, J.-C. (1999). Contextual knowledge sharing and cooperation in intelligent assistant systems. Le Travail Humain, 62, 223-246. Goldberg, J.H. and Kotval, X.P. (1999). Computer interface evaluation using eye movements: methods and constructs. International Journal of Industrial Ergonomics, 24, 631-645. Howell, D.C (1998). Méthodes statistiques en sciences humaines. Quatrième Edition.Bruxelles: DeBoeck. Jacob, R.J.K and Karn, K.S (2003). Eye-tracking in human-computer interaction and usability research: Ready to deliver the promises. In J. Hyona, R. Radach and H. Deubel (Eds), The Mind’s eye: Cognitive and applied aspects of eye movement research, pp. 573-605. Amsterdam: Elsevier. Léger, L., Tijus, C. and Baccino, T. (2005). Effect of the task, visual and semantic context on word target detection. In A. Dey, B.Kokinov, D.Leake, and R.Turner (Eds.), Modeling and Using Context (CONTEXT-05), (pp. 278-291). Berlin: Springer Verlag, LNCS 3554 Leplat, J. and Hoc, J.M. (1983). Tâche et activité dans l’analyse psychologique des situations. Cahiers de Psychologie Cognitive 3, 49–63. Matera, M., Rizzo, F. and Carughi, T. (2006). Web usability: principles and evaluation methods. In E. Mendes and N. Mosley (Eds), Web Engineering (pp 143-180). Berlin: Springer Verlag,. Nielsen, J. (1993). Usability Engineering. San Diego: Morgan Kaufman, Academic Press. Nielsen, J., and Molich, R. (1990). Heuristic evaluation of user interfaces. Proceeding of ACM CHI'90 Conference. (Seattle, WA, 1-5 April), pp. 249-256. Polson, P.G., Lewis, C., Rieman, J., and Wharton, C. (1992). Cognitive Walkthroughs: A Method for Theory-Based Evaluation of User Interfaces. International Journal of ManMachine Studies, 36, 741-773.
18
Revue. Volume X – n° x/année
Poole, A and Ball, L.J. (2006). Eye tracking in human-computer interaction and usability research: Current status and future prospects. In C. Ghaoui (Ed.), Encyclopedia of human computer interaction (pp. 211-219). Pennsylvania: Idea Group:. Rayner, K.(1998). Eye movements in reading and information processing: 20 years of research. Psychological Bulletin, 124(3): 372-422. Richard, J.-F. (1983) Logique du fonctionnement et logique de l'utilisation. Rapport de Recherche INRIA no 202.