Ŕ periodica polytechnica Civil Engineering 55/2 (2011) 147–160 doi: 10.3311/pp.ci.2011-2.07 web: http:// www.pp.bme.hu/ ci c Periodica Polytechnica 2011
Modelling aspects of interface interlock in composite floors Noémi Seres / László Dunai
RESEARCH ARTICLE Received 2010-05-18, revised 2010-11-24, accepted 2011-03-10
Abstract The subject of the ongoing research work is to analyze the composite action of the structural elements of composite floors by experimental and numerical studies with a special focus on the rolled embossments on the steel surface. The mechanical and frictional interlocks result in a complex behaviour and failure under horizontal shear. This is why the design characteristics can be determined only by standardized experiments. The aim of the current research is to determine the longitudinal shear resistance for composite floors, by applying advanced numerical model. The paper has a focus on the basic numerical models with particular considerations on the concrete model and on the numerical model of rolled embossments. Keywords composite floor · rolled embossment · concrete damage · numerical modelling · ANSYS Acknowledgement This work is connected to the scientific program of the “Development of quality-oriented and harmonized R+D+I strategy and functional model at BME” project. This project is supported by the New Hungary Development Plan (Project ID: TÁMOP4.2.1/B-09/1/KMR-2010-0002).
Noémi Seres Department of Structural Engineering, Budapest University of Technology and
Economics, M˝uegyetem rkp. 3, H-1111 Budapest, Hungary, Hungary e-mail:
[email protected] László Dunai Department of Structural Engineering, Budapest University of Technology and Economics, M˝uegyetem rkp. 3, H-1111 Budapest, Hungary, Hungary
Modelling aspects of interface interlock in composite floors
1 Introduction
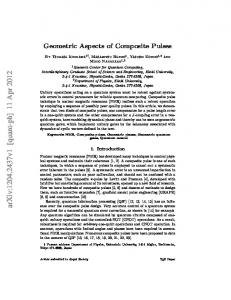
Composite floor is widely used in the building industry in the last decades. The casting of concrete is carried out on corrugated steel plate (as permanent formwork) which is supported by floor beams. The efficiency of the composite slabs depends on the composite action between the steel and concrete structural members. The interlock on the contact surface is firstly based on an adhesive rigid bond which is generated by the set of cement on the steel surface. This interlock is lost as soon as interface slip occurs. Then the longitudinal shear is transferred by friction and/or mechanical bonds. A typically applied mechanical bond is the rolled embossment on the steel surface Fig. 1/a [1]. Both friction and mechanical bond result in complicated interacting phenomena what can hardly be handled by the classical design methods of shear connectors. Standards manage horizontal shear strength calculation by using test based design characteristics in the design equations. Two methods for the verification of composite slabs are given in EN 1994-1-1 [2]: the m − k method and the partial shear connection method. These methods are based on a test program composed of full scale slab specimens [3] (four point bended, one-way slab elements). To simplify those tests, small scale specimens are also proposed by push-out and pull-out tests [4]. The test arrangements can be seen in Fig. 1/b and 1/c. Performance tests are necessary since each steel deck profile has its own unique shear transferring mechanism. The purpose of the tests is to provide data for the ultimate strength design equations. In particular, a series of tests is needed in order to provide ultimate experimental shear resistance for linear regression analysis of the pertinent parameters affecting the shearbond capacity. To simplify the design methodology numerical models has been recently proposed in order to capture the failure phenomenon [5–7]. The layout of the models is practically the same regardless of the used finite element program. The concrete is modelled by solid elements, the steel part is modelled by shell elements and the interlock is modelled by different interface elements. Despite they show good accuracy with experimental results they suffer from the drawback that they need a large experimental background to characterize the ma-
2011 55 2
147
Fig. 1. (a) Composite floor structure [1] (b) full scale [3] and (c) small scale specimens [4].
terial properties and the behaviour of the mechanical interlock. The small scale test especially needs precise manufacturing process and special loading conditions [1]. Improving the possibilities from the modelling side, the main point of the model is the characterization of the interface interlock. Once the local behaviour is well captured and implemented, the global model behaves well, too. Since the embossed type mechanical bond produces a complex failure under horizontal shear the phenomenon can be followed by a complex model. The analysis separates here in two directions: (1) concrete failure of the global structure and concrete damage around the rolled embossments and (2) failure of the steel sheeting and the steel embossment. An extensive study is completed by the authors on the steeltype failure, which occurs when the steel part is relatively weak comparing to the concrete part and the failure hereby is governed by steel embossment yielding and failure. Excluding the concrete damage, an experimental and numerical analysis is accomplished on an individual enlarged embossment [8]. On the basis of the verified model a parametric numerical study is completed to determine the effect different parameters on the behaviour. The current paper has a special focus on the concrete-type failure. The finite element program ANSYS is chosen for modelling, wherein a specific concrete material model and the associated element type is available. The applicability of this material model is tested on different structural elements and at different scales: on a global structure of a beam and on a local model of a rolled embossment. The results of the analyses are compared with experimental results of reinforced concrete beams and results of traditional pull-out test of composite profile ribs, respectively. The beam model is first built and checked based on a published experimental investigation [9], then the same model is applied and compared by an experimental investigation made by the authors [10]. After the concrete material model is proved to be appropriate, it is applied on the local models of rolled embossments. The steel embossment is modelled together with the surrounding concrete block under loading conditions of the real structural case. Since the main point is to analyze concrete failure the steel part of the model is kept linear elastic for most of the time. The local model is built with two different embossment geometries: 148
Per. Pol. Civil Eng.
rectangular and circular, whereof the rectangular geometry is simplified, and the rough geometry is used to control the applicability of the previously calibrated material model. The circular embossment is built with refined geometry. For the sake of runtime and model flexibility the circular model is then simplified and the relationship between the different geometric qualities is analyzed. Based on the modelling experiences a proposal for the global composite model is derived and the further research steps are defined. 2 Modelling strategy
The rolled embossments are extruded in the steel sheet by cold-forming operation. The embossments increase the roughness of the surface and insure the transfer of the longitudinal shear after the adhesive bond is lost between the steel and concrete surfaces. Various embossment shapes and sizes exist, which influence the slip resistance of the composite floor. The global failure of a composite slab under bending typically belongs to longitudinal shear failure due to the damage of the interlock between the structural members. The local failure of the interface interlock originates from two components: (1) steel yielding and (2) local crushing of concrete around embossment ends that has a softening effect on the embossments’ effective geometry [11]. Accordingly, those two phenomena are needed to follow by the numerical model to get correct prediction for the embossment’s behaviour. The consideration of the steel yielding in numerical models is a common and well-known problem. When nonlinear effects like concrete damage, contact problems and plastic behaviour, are jointly considered in one model, the calculation may result in several difficulties to be solved. According to the strategy of the research the numerical models are built and checked in three levels: 1st : concrete material model, 2nd : composite connection (local) model, 3r d : composite global model. The models of 1st and 2nd level aim to resolve and the combination of them aims to give the basis for the 3r d model level, which is to be used for the development of the numerical simulation based design method. The element types and material models related to the model levels are summarized in Table 1. The paper introduces the models of the 1st and 2nd level. The models are developed in ANSYS Multiphysics [12] environment. The computational method uses the Newton-Raphson iteraNoémi Seres / László Dunai
Tab. 1. Applied finite elements and material models Structural members
Concrete part
Steel sheeting
Reinforcement
Material
Model level
Element type* "SOLID65"
Isotropic,
1st
8-node-volume
kinematic
element
hardening
"SHELL63"
Linear elastic
2nd
1st
model
and
and
"SHELL181"
Linear elastic-
4-node-shell
perfectly
element
plastic
"LINK8"
Linear elastic-
2-node-spar
perfectly
element
plastic
Connections "TARGE174" Surface contact (adhesive bond and friction)
and 2nd
"CONTA170" surface-to-
Isotropic Coulomb
surface contact
friction
pair
* The notation of the element types are according to ANSYS.
tion technique in the nonlinear analysis. The convergence of the solution is checked on the basis of the Euclidean norm of unbalanced force vector by applying a tolerance of convergence of 0.1%. In the geometric nonlinear analysis large displacements and strains are considered. Automatic time stepping is used which cut a time step size in half whenever equilibrium iterations fail to converge and automatically restart from the last converged sub-step. If the halved time step again fails to converge, bisection will again cut the time step size and restart, continuing the process until convergence is achieved or until the minimum time step size is reached. 3 Reinforced concrete modelling 3.1 Reinforced concrete beam model – test #1
In the modelling of the composite floor connection, the finite element modelling of concrete behaviour is significant. To test the material model such a structure is needed which fulfils the following requirements: well-known behaviour for the simple comparison of the results, concrete and steel components to analyze the concrete behaviour and the steel-concrete interaction. Regarding the conditions a simply supported reinforced concrete beam is chosen for the analysis. Accordingly, an experiment on an ordinary reinforced concrete beam [9] is found as verification background for the concrete material model (Fig. 2). The SOLID65 element is chosen to model the beam with geometry of 155x240x2800 mm. The element is defined by eight nodes and isotropic material properties and it is usually applied in three dimensional modelling of brittle solids, especially in concrete application and modelling of reinforced composites. Modelling aspects of interface interlock in composite floors
To assign the concrete material properties the uniaxial tensile ( f t ) and compressive strength ( f c ), and additionally the shear transfer coefficients for open and closed cracks are the required input data. The material is initially considered isotropic. The cracking is modelled as a smeared band and it brings a modification in the stress-strain relationship by introducing a plane of weakness in a direction normal to the crack face [12]. Typical shear transfer coefficients range from 0 to 1, with 0 representing a smooth crack (complete loss of shear transfer) and 1 representing a rough crack (no loss of shear transfer). When the brittle failure of the material under tension/compression can be neglected the cracking / crushing capability of the material can be disabled by defining f t / f c by the value -1 (this option of the material model improves the convergence). The failure surface for concrete is identified by the WillamWarnke criterion [13]. The mathematical model of this failure surface is smooth and convex; it gives close fit of experimental data in the operation range and it is defined by a small number of parameters which are determined from standard test data [13]. When applying concrete material properties, a total of five input strength parameters are needed to define a 3D failure surface ( f t , f c , f cb , f 1 and f 2 whereof the first two parameters are detailed above and the last three parameters are the biaxial compressive strength, the compressive strength for a state of biaxial and triaxial compression superimposed on hydrostatic stress state, respectively). A 2D failure surface; however, can be specified with a minimum of two constants: f t and f c . Different models are worked out for testing the change of those parameters of the concrete material model, which are defined in Table 2. The compressive and tensile strength of the beam model are set to experimental values (69 N/mm2 and 5.1 N/mm2 ). The setup and meshing of the model is shown in Fig. 3/a. The reinforcement can be discrete or smeared. In the first case, it is defined apart, as 3D tension/compression spar element (Link8 element, see in Table 1). In the second case, the reinforcement is defined by modified material property (Fig. 3/b and Fig. 3/c). The Solid65 element has up to three rebar materials which are capable of tension and compression, but not shear. Rebar specifications, which are input as real constants, include the volume ratio of the reinforcement and its orientation angles. The load, according to the experimental data of [9] is applied in a four-point-bending arrangement by a displacement control. The maximum value of displacement is chosen by the maximum midspan deflection of the experimental beam (emax = 30 mm). In the case of models 1/a – 1/d the load is applied in 1 mm steps, but convergence problem occurred and the run terminated when tensile crack appeared. The runtime of the models is found significantly large. By the evaluation of the model results the following observations are derived: • the beam models 1/b and 1/c give exactly the same results which leads to the conclusion that the type of the failure surface does not affect the results,
2011 55 2
149
Fig. 2. Details of the published experiment [9].
Fig. 3. (a) Setup of the numerical model, (b) discrete and (c) smeared reinforcement. Tab. 2. Characteristics of concrete models of test #1 Input data
1/a
1/b
1/c
1/d
1/e
1/f
1/g
Concrete compressive strength
-1*
69
69
69
69
-1*
-1*
Concrete tensile strength
5.1
5.1
5.1
5.1
5.1
5.1
5.1
Shear transfer coefficient for open crack
0
0
0
0.1
1
1
0.15
Shear transfer coefficient for closed crack
0
0
0
0.9
1
1
0.3
Failure surface
2D
2D
3D
2D
2D
2D
2D
Reinforcement (d = discrete, s = smeared)
d
d
d
s
d
d
d
30 mm uniform
Mesh size Geometry of the beam
• using smeared reinforcement instead of discrete have an influence only on the runtime of the model but not on the behaviour. The runtime reduces since there are not additional elements to represent the reinforcement; the programming of the smeared reinforcement, however, is found complicated, • the value of the shear transfer coefficients should be adjusted to reach convergence after cracks appear. Having these observations two new models are built (1/e and 1/f in Table 2). The quarter of the single span beam is modelled to reach a reduced runtime and the load is applied in smaller loadsteps to keep the velocity of crack propagation low. The maximum and minimum loadstep is emax /100 and emax /10 000, respectively, during the nonlinear analysis. The starting value of 150
Per. Pol. Civil Eng.
full
full
full
half
quarter
coarse quarter
quarter
the loadstep is set to emax /1 000. The calculation starts with this value and is increased and reduced automatically between the maximum and minimum values, if needed by the convergence. Bisection is enabled, if the minimum loadstep value does not reach convergence. The longitudinal reinforcement cannot assume shear, so the cracked concrete cross-section is taken into account in the shear transfer (open and closed cracks, too). The shear transfer coefficients can be varied between 0-1. Those values express the shear transfer capacity of the cracked concrete cross-section compared to the undamaged concrete cross-section. Its value can be calibrated by experimental results, if the numerical stability exists. Recently researchers dealing with numerical modelling of reinforced concrete beam structures used a wide range of values for Noémi Seres / László Dunai
the shear transfer coefficients. The common value of this magnitude for open crack is in the range of 0.05-0.5 and for closed crack in the range of 0.6-0.9 [14–16]. However, other authors proposed e.g. 0.12 or 0.22 [17–19] for closed cracks. As a conclusion of the extensive literature review, it is found that no exact suggestion exists for setting these parameters. In this case, the maximum value is considered due to the reason of numerical stability. The quarter beam model composed of 2 240 solid elements and 3 135 nodes; the total number of the degrees of freedom is 9 405. The runtime is 4.5 hours on a computer characterized by 3.6 GHz Pentium 4 dual-processor, 2GB RAM. The used maximum and minimum loadsteps are emax /104 and emax /30 000 (due to bisection), respectively. The average of the loadstep sizes is emax /4090 under the total of 1517 steps. The results of 1/e and 1/f models are compared to experimental results in Fig. 4. The behaviour of the beam and the numerical models are linear till the first crack appears (at the load level of 16 kN). When crack appears on the model a “disturbed” phase (Fig. 4, magnified part) can be seen on the curve, that is followed by a quasi-linear phase till the yielding of the reinforcement (at the load level of 62 kN). After yielding of the reinforcement the load carrying capacity does not increase. If the crushing capability of concrete material is not considered it does not decrease either. The model 1/f shows the case when the descending phase can be observed after crushing. Note that in the published paper the descending branch is not presented. As a conclusion: models 1/a – 1/d show that the type of failure surface has no significant effect on the models’ behaviour. Alike, the type of reinforcement (discrete or smeared) has no effect on the ultimate load or on the behaviour of the models. The numerical results of 1/e and 1/f both show good accordance with experimental results. Due to the small loadsteps the crack propagation becomes traceable. Despite the model with smeared reinforcement requires less computation time, its programming is more complicated. For the sake of simplicity and to keep the models’ flexibility for further geometrical or physical changes, the discretely reinforced model is used in the next steps of the research. To analyze the effect of the shear transfer coefficients the 1/g model is built on the basis of 1/e model. The computational time is found considerably high on the beam model 1/f, so a literature review is completed to find an appropriate mesh size to reduce computation time but keep the accuracy of the results. Several suggestions exist in the literature from 25 mm fine uniform mesh [16] to coarser meshes: 50, 75 mm [15] and 80 mm in the longitudinal direction [9]. Since no exact value is advised the mesh is performed so that 1 volume is meshed by 1 element. The coarse mesh gives accurate results: it does not affect the behaviour but the runtime becomes less, so this mesh size is applied further on the 1/g model. Changing the value of the shear transfer coefficient it is observed that it has only a slight effect on the behaviour of the Modelling aspects of interface interlock in composite floors
model, however, it has a certain minimum value where under the model does not converge. In the case of the 1/g model it is 0.15 and 0.3 for open and closed cracks, respectively (Table 2). It is also observed that the loadstep size could be increased. The model achieved the maximum displacement load (30 mm) under 23 loadsteps, the average of the step sizes is emax /21.78. With the increased load steps the load displacemet curve becomes smoother and the slope of the final branch (after the yielding of the steel bars) slightly decreases (Fig. 4). Note that the model with the finer mesh (1/e) does not converge with the same large loadsteps. The maximum and minimum loadsteps wherewith convergence is reached is emax /50 and emax /100, respectively and the runtime reduces to 40 minutes. To conclude the mesh size has an effect on the maximal/minimal loadstep size. 3.2 Reinforced concrete beam model – test #2
A reinforced concrete beam model is built in the frame of the research detailed in [10]. This specimen is selected as a test #2 for concrete modelling. The RC beam with geometry of 150x150x700 mm is built from grade C25/30 concrete. The test is executed at the age of 16 days of the beam, when the compressive strength and the Young’s modulus of the concrete are 37 N/mm2 and 37.123 GPa, respectively. The reinforcement at the tension zone composes of 2x6 mm diameter of grade B600A steel bars and the reinforcement at the compression zone composes of 2x3 mm of grade B240A steel bars. The shear strength is provided by stirrups (B240A, 3 mm diameter) distributed by 35 mm. The notation of the grade of the materials is according to the Eurocode. The material properties are applied on the model by the material test results because it is found in [9] that the model is sensitive to the Young’s modulus of the concrete and the yield strength of the steel bars. The load is applied in four-point-bending arrangement under displacement control. By the results of the experimental analysis, the first cracks and the yielding of the reinforcement are observed at the load levels of 20.5 kN and 41.03 kN, respectively. The experimental load carrying capacity of the beam is 45.5 kN. Taking advantage of the symmetry the quarter of the single span beam is modelled. The same element type and material model for concrete and reinforcement is applied as in the model 1/e: the 3D solid element SOLID65 to model concrete, and LINK8 spar element to model the reinforcement with a linear elastic – perfectly plastic material model. Two mesh sizes and small loadsteps (like in test #1) are used: (i) a uniform 20 mm mesh is applied first on the model and then (ii) the coarsest mesh possible, when one volume is meshed by one element, so the mesh size is defined by the position of the reinforcement and the distribution of the stirrups. The model and the meshes are shown in Fig. 5. The model with the fine mesh shows increasing load carrying capacity after the yielding of the steel as it is shown in 4 (curve 2) and the model had almost an hour runtime. The model with coarse mesh on the other hand gives a good approximation for the load carrying capacity and the runtime significantly 2011 55 2
151
Fig. 4. Numerical results of RC beam – test #1: (a) force-deflection curve (b) start of cracking (magnified).
Fig. 5. Numerical model and mesh of RC beam – test #2: (a) elements (b) uniform fine mesh (c) coarsest mesh (d) the mesh which gives the best fit for the
experiment.
Fig. 6. Numerical results of RC beam – test #2: (a) force-deflection curve (b) crack pattern: (b.1) first cracks (b.2) final crack pattern.
152
Per. Pol. Civil Eng.
Noémi Seres / László Dunai
reduces to ∼10 min. The final branch is still increasing, but its slope becomes much lower (4, curve 3). The best fit between the experimental and numerical force-displacement curves (4, curve 4) is found when the mesh in the cross-section is controlled by the edges of the volume elements of which the model composes. In the longitudinal direction every volume element is divided in two elements. The effect of the change of the shear transfer coefficient is analyzed on the best-fit-model in the range of 1.0 – 0.3, but the change of this material parameter only slightly modifies the results. The effect of shear is significant in the structure, because of the high height/span ratio of the short beam (h beam >lbeam /(10÷12)). In this case the fine mesh gives an artificial stiffness increment to the model and leads to a spurious load-displacement relationship at the final branch. From the point of view of runtime, the coarse mesh turns the beam models time efficient and saves computational time and in the same time the accuracy of the results is kept. To follow the assumptions of the test #1 the loadsteps are increased to accelerate the calculation. Large loadsteps are applies on the model with coarse mesh. Good agreement is found with the original load-displacement curve (4, curve 3 and 5) by setting the maximum and minimum loadstep to emax /10 and emax /230, respectively (emax is the maximum displacement by experimental results). The magnitude of the shear transfer coefficients can be adjusted with experimental results, but in the case of the actual investigation its effect is negligible. Also it is found that care should be taken when setting the mesh density, when the effect of shear is important in the structure. The final phase of the numerical load-displacement curve remains ascendant. Note that in [9] the numerical curve shows the same character, as well. The common property of the beams is that the bond between the reinforcement and the concrete is considered perfect, which means that no bond slippage occurs. It is assumed that the consideration of the before mentioned effect could create the descending part of the load-displacement curve at the end, but the results are accurate enough with this simplification of the model, too. As a result of the accomplished parametric tests an adequate material model for concrete is calibrated by two experimental results [9] and [10]. The applicability of concrete material model is verified by comparing it by test #1 and test #2. The requested loadsteps to insure convergence after the tensile crack appears is determined. The shear transfer coefficients are set by the experimental results. Based on these results, the concrete material model is found to be appropriate to follow the concrete behaviour, and it can be built in the local model of the rolled embossment. 4 Local model of embossment
In the next step of the modelling process, local model is developed to follow the behaviour of the rolled embossments. The steel plate has a pattern of rolled embossments. According to Modelling aspects of interface interlock in composite floors
the strategy of the research, only one embossment is modelled to describe the behaviour, which is later extended for all of the embossments. The failure process of one individual embossment is followed by a complex model which includes both the nonlinearity of the steel and the concrete damage. 4.1 Fictive embossment
The arrangement of the composite connection to be analysed is shown in Fig. 7/a. To check the applicability of the local model, the geometry of the embossment is chosen as a rectangular dishing type, according to a published experimental research [3]. The concrete block’s geometry is 65x65x45 mm and the block’s width is determined by the arrangement of the embossments (Fig. 7/b). It can be noted, however, that the model is fictive, because the geometry is simplified, and the rounding on the edges is not considered. Thus a quantitative comparison of the numerical and experimental results cannot be made, but the behaviour tendencies and the failure modes can be determined. The load is applied as uniformly distributed surface load on the back face of the concrete block (Fig. 7/a). The purpose of the analysis is to push off the concrete block from the steel sheeting and observe the ultimate behaviour and failure. In the model, as interface element, a surface-to-surface contact pair is employed: the Conta173 is used to represent contact and sliding between 3D target surfaces (Targe170) and a deformable surface, defined by this element. These elements are applicable to 3D structural and coupled field contact analyses. It has the same geometrical characteristics as the solid or shell element face with which it is connected. Contact occurs when the element surface penetrates one of the target segment elements on a specified target surface. Isotropic Coulomb friction is applied in the model which is specified by a single coefficient of friction. The Solid65 element with crushing capability is applied to model concrete and the Shell63 linear elastic shell element for the steel sheeting. The local model of mechanical bond is numerically stable due to the contacts on the shell-solid interface. Since the concrete failure is proved to be a mesh sensitive problem in the analysis of the reinforced concrete beam specimens, a mesh sensitivity analysis is carried out on the fictive model. It is found that the load carrying capacity shown by the model increases when increasing the mesh size (Fig. 8). Reference value to compare the load carrying capacity results for one embossment does not exist, so the only point of view about setting this parameter is to keep the model time efficient and to be able to follow progressive crack propagation. By those assumptions the mesh size is set to maximum 20 mm for further analyses. The behaviour of rolled embossment in the numerical model can be analyzed by the force-displacement curve, as shown in Fig. 9. The force is defined as the sum of the horizontal reaction forces and the displacement is measured accordingly in the same 2011 55 2
153
Fig. 7. Local model’s geometry and arrangement (b) embossments on the plate.
direction. The crack propagation and the plate deformation are presented in Fig. 10. The force-displacement relationship remains quasi-linear despite the failure belongs to the appearance and propagation of the concrete cracking/crushing behind the embossment at the loaded side. The crack appears first around the edges of the embossment (points 1 to 2 on the curve) then it propagates on the interlocking concrete surface and also it spreads towards the loaded face until the maximum load is reached. Then the force falls back to a lower level. The degradation of the concrete on the loaded side of the embossment leads to failure. It is important to notice that the crack propagation’s direction is meshdependent: cracks are spreading not just on the loaded face and in the direction of the loading but also cracks are running upwards and sideways apart. The ultimate load and displacement are 7.964 kN and 0.057 mm, respectively. The magnitude of the ultimate load cannot be quantitatively evaluated, since any experimental value or calculation formula exists to compute the resistance of it. The failure mode that the model produces, however, can be supported by an experimental investigation of a pull-out test [20].
Fig. 8. Mesh sensitivity of the fictive local model.
The test specimen and the specimen parts (profile steel rib and the surrounding concrete block) after the failure are shown in Fig. 11. In this test the local crushing of the concrete near the embossments led to final slip and failure of the specimen, whereof the concrete damage can be seen in Fig. 11/c.
154
Per. Pol. Civil Eng.
4.2 Parametric study on the fictive embossment
The design of composite slabs is currently based on performance test information (full or small scale tests) for a particular sheeting profile. A parametric investigation of the embossed local model is executed by an experimental analysis of small scale specimens [21]. The aim of the published experiments was to determine the effect of different shape, size and location of rolled embossments and different steel thicknesses. The aim of the parametric investigation is to generate the same type of geometric changes (depth, length and sheeting thickness), and analyze the behaviour. The experimental observations showed that the longitudinal shear resistance of the test specimens is significantly affected by the depth of the embossments and the length of the embossment is an influential factor, too. However, when the embossments reach a certain length (∼40-50 mm), the influence is not significant for higher values. Additionally it is found by the experiments that the sheeting thickness has a significant effect on the stiffness of the tested specimens. A parametric investigation is completed by changing the depth, the length of the embossment and by changing the sheeting thickness of the steel plate as it is seen Fig. 12. When one geometric parameter is changed on the model the other measures of the embossment are fixed according to the original geometry of the fictive embossment. The amount of concrete cover is kept constant around the embossment in every analyzed case. It means that the length (B) of the concrete block is enlarged, when increasing the length of the embossment and the depth (H ) is reduced when decreasing the depth of the embossment. The results of depth and length analysis are summarized in Fig. 13. It is observed that the models show to the same type of concrete failure and propagation but the load carrying capacity increases, when the length/depth of the embossment increases. The results of sheeting thickness analysis give the expected results. Six different plate thicknesses are applied on the model. The curves show the same global behaviour but the initial stiffness increases by increasing the sheeting thickness. The results of the analysis can be seen in Fig. 14.
Noémi Seres / László Dunai
Characteristic points [kN]
[mm]
(1)
1.256
0.010
(2)
3.238
0.023
(3)
7.964
0.057
(4)
4.885
0.058
Fig. 9. Force-displacement curve of the local model.
(1) First cracks
(2) Crack propagation
(4) Cracks after maximum force
(3) Cracks at maximum force
Plate deformation at final stage
Fig. 10. Crack patterns and plate deformation of the local model.
Fig. 11. (a) Test specimen (b) profile deck rib (c) concrete block after the test [20].
Modelling aspects of interface interlock in composite floors
2011 55 2
155
Fig. 13. Results of the different depth and length parameters.
Fig. 14. Effect of the sheeting thickness on the initial stiffness.
of a cracked zone on the loaded concrete face. Continuous crack propagation leads then to failure. As it is noticed by the fictive local model, the direction of the crack propagation shows meshdependency by this refined model, as well. The ultimate force and displacement is 1.184 kN and 0.03 mm, respectively. 4.4 Effect of friction coefficient on the behaviour of circular embossment
Fig. 12. Embossment’s parameters.
4.3 Circular embossment
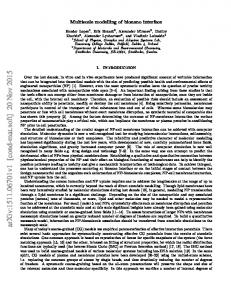
Having an experience on the basic behaviour of the fictive model, a refinement of the local model is completed. The embossment is chosen based on a published experiment [22]. The details of the embossment are presented in Fig. 15/a-c. The arrangement of the numerical model is the same as in the case of the fictive local model. The finite element mesh of the circular local model is shown in Fig. 15/d. A crushing concrete material with shear transfer coefficient set to 0.3 and linear elastic-perfectly plastic steel material are applied in the model. The results of the model are presented in Fig. 16. The first crack appears at a load level of 0.215 kN at the upper back part of the embossment at the loaded side. Then the crack spreads around and towards the loaded face. At the point (2) a vertical jump is observed on the curve which belongs to the appearance
156
Per. Pol. Civil Eng.
After the basic numerical model is built, a parametric study is accomplished on it, by changing the coefficient of friction between the steel sheeting and the concrete block. The coefficient of friction is a scattered physical magnitude [11]. It characterizes the quality of the contact surfaces, and it is affected by a large number of uncontrolled factors like cement type, dosing of concrete, type and size of aggregates, setting up and curing processes, moisture level, etc. Different values of dry friction coefficients can be chosen from 0.2 to 0.6 depending on the parameters mentioned above. Since the deterministic input parameter of the contact finite element is the coefficient of friction, it is important to determine its effect on the model behaviour. Four coefficients of friction are chosen for analysis: 0.3-0.4-0.5-0.6. The results are summarized in Fig. 17, and the curves show that the stiffness of the local model is increasing when the friction of coefficient increases.
Noémi Seres / László Dunai
Fig. 15. Embossment details [22]: (a) cross-section; (b) side view; (c) detail; (d) finite element model.
Characteristic points [kN] [mm] (1) 0.215 0.004 0.516 0.011 (2) 0.494 0.011 (3) 1.184 0.030
1,4
(a)
(3)
1,2 Force [kN]
1 0,8 0,6
(2)
0,4
(1)
0,2
(b.1) First crack
0 0
0,01
0,02
0,03
0,04
Displacement [mm]
(b.2) Crack propagation
(b.3) Final crack pattern and
(c) sheet deformation
Figure 1: (a) Force – displacement curve of the Fig. 16. (a) Force – displacement curve of the circular embossment, (b) crack patterns andcircular (c) steel embossment, deformation. (b) crack patterns and (c) steel deformation.
Besides, the character of the curves does not change. 4.5 Refined model vs. simplified model
As it is shown in the mesh sensitivity analysis of the fictive embossment, the mesh size has a significant influence on the load carrying capacity result of an embossment. The mesh of the refined model, however, is not flexible for size changing since the geometry defines a certain mesh density. The question arises if it is possible to apply a simplified geometry instead of the refined one (Fig. 18/a) which has the basic features of the refined model but omits the rounding of the edges (Fig. 18/b). To find the relationship between the refined and the simplified geometry the simplified model is built with similar mesh density to be able to compare the results. The force-displacement diagrams of the refined and simplified model together are shown in Fig. 19. On this same figure the crack patterns and the plate deformation for the comparison are presented, too. The ultimate load on the simplified model is 1.15 kN which gives good agreement with the precise models’ ultimate load (1.18 kN). The crack pattern in the final stage shows good accordance, as well. Difference can be seen, however, in the ductility and the stiffness of the models. When the stresses of the steel plate are analyzed it is found that the simplified model shows lower stresses then the refined Modelling aspects of interface interlock in composite floors
Fig. 17. Effect of coefficient of friction.
Fig. 18. (a) Refined geometry and (b) simplified geometry of the circular
embossment.
model but the stress distribution is similar. Both models showed stresses beyond the yielding limit (235 N/mm2 ): the maximum stress value is 302 and 421 N/mm2 on the simplified and on the
2011 55 2
157
(b.1) Crack pattern
,4 (2)
(1) (a)
,2
1,2
,8
1 Force [kN]
1
,6
,4
(b.1) Crack pattern
1,4
Refined geometry, linear steel
0,8 0,6
Simplified geometry, linear steel
Refined geometry, nonlinear steel
0,2
0
Refined geometry, linear steel
Simplified geometry, linear steel
0,4
,2
(2)
(1)
Refined geometry, (b.2) Crack pattern nonlinear steel
0
0
0,01
0,02
0
Displacement [mm]
.1) Plate deformation
0,03
0,01
0,040,02
0,03
(b.2) Crack pattern
0,04
Displacement [mm]
(c.1) Plate deformation
(c.2) Plate deformation
(c.2) Plate deformation
Fig. 19. (a) Force-displacement, (b) crack pattern and (c) deformation of the plate of the refined and the simplified circular embossment.
del is governed by the concrete failure, and the steel failure is negligible. Models are developed for the simulation of rolled embossments and the observed numerical difficulties due to the material nonlinearity and the local and global models’ behaviour (and concrete elements’ behaviour) are solved. As the result of the numerical modelling completed up to present an adequate concrete and reinforced concrete model is obtained (1st model level) by calibrating it with two experiments. A numerical local model is worked out (2nd model level) for fictive rolled embossments where the basic behaviour modes are determined. A para1: Stress distribution and plastic zones on the (a) simplified geometry and (b) refined Fig. 20. Stress distribution and plastic zones on the (a) simplified geometry metric study is accomplished as well, according to published geometry of the circular embossment. and (b) refined geometry of the circular embossment. experiments [21] and the tendencies are well shown by the local models. Refined embossment geometry is worked out and refined model, respectively. The stress distribution of the models the relationship between the simplified and the refined geomeis shown in Fig. 20. After a bilinear-isotropic hardening steel try is determined. Having the observations on the models the material model and the associative Shell181 element is applied following conclusions are derived: Reinforced concrete beam models: on the refined model it is found that the influence of the steel (a) Plastic zone
(b) Plastic zone
behaviour has a slight influence on the ultimate load (Fig. 19), because the dominant failure model is governed by the concrete failure, and the steel failure is negligible. 5 Conclusions
In this paper, the basic numerical models (RC beam and rolled embossment) are calibrated for testing the concrete material model defined by the Willam-Warnke failure criterion. The suitable element type SOLID 65 is associated with the material model whereof the cracking and crushing features are used. The input isotropic material parameters are the Young’s modulus and the Poisson’s ratio. The failure surface is specified with two material parameters: the uniaxial tensile and compressive strengths. The shear transfer through the cracked/crushed concrete elements is given by additional material properties (the shear transfer coefficients).
158
Per. Pol. Civil Eng.
• the small loadsteps in every case insure numerically stable analysis. In the current research the applied minimum loadstep size is emax /10 000. The loadstep size, however, can be increased. Using larger loadstep values result in smoother load-displacement curve and shorter runtime then in case of using small loadsteps. • the shear transfer coefficients of the concrete model have a slight effect on the concrete models’ behaviour: the coefficients are to be used for detailed model calibration, their magnitude can be adjusted to experimental results; • the FE model of the short beam is mesh sensitive, the mesh size influences the behaviour of the model. When the shear becomes governing in the behaviour a denser mesh leads to spurious stiffness increment; • in general a coarse FE mesh (in the current research means Noémi Seres / László Dunai
one volume is meshed by one element) gives good results and produces a time efficient analysis. Local models – general: • the failure mode of the local models was primary conducted by concrete failure and the effect of steel yielding was negligible;
References 1 Composite floor deck, Product: Comflor 100, Tegral Metal Forminl Ltd, 2010, available at www.tegralmetalforming.com. 2 EN 1994-1-1: Design of composite steel and concrete structures - Part 1.1 :General rules and rules for buildings, 2004. 3 Marimuthu V, Seetharaman S, Jayachandran A A, Chellappan A, Banndyopadhyay T K, Dutta D, Experimental studies on composite deck slabs
to determine the shear-bond characteristic (m-k) values of the embossed profiled sheet, Journal of Constructional Steel Research 63 (2007), 791–803,
• the failure mode can be justified by experiments of pull-out test results [20]; • the local models are found mesh sensitive, the mesh size influences the load carrying capacity;
DOI 10.1016/j.jcsr.2006.07.009. 4 Crisinel M, Marimon F, A new simplified method for the design of composite slabs, Journal of Constructional Steel Research 60 (2004), 471–491, DOI 10.1016/S0143-974X(03)00125-1. 5 Vlejkovic´ M, Influence of load arrangement on composite slab behaviour and recommendations for design, Journal of Constructional Steel Research
• with the denser mesh the ultimate load decreases (note, that the tendency is not strict);
45 (1998), 149–178, DOI 10.1016/S0143-974X(97)00055-2. 6 Eldib M E A-H, Maaly H M, Beshay A W, Tolba M T, Modelling and anal-
• the geometrical shape of the mesh influences the direction of the crack propagation;
(2009), 1236–1248, DOI 10.1016/j.jcsr.2009.01.002. 7 Tsalkiditis T, Avdelas A, The unilateral contact problem in composite
• the tendencies from changing physical and geometrical parameters on the model show good agreement with experimental results of pull-out tests [21]. Local models – refined vs. simplified models: • a simplified local model (with similar mesh density) shows the same failure mode, ultimate load and crack pattern then the refined model; • the simplified model shows higher stiffness, lower ductility and lower stresses in the steel sheeting; • the simplified model is accurate enough if the target of the calculation is the ultimate load, and if the concrete behaviour governs the failure. Further studies: A further goal of the research is to avoid the observed mesh sensitivity in the local models. To be able to create accurate local models of rolled embossments without using simplifications in the geometry to get better data for the ultimate load and crack propagation seems to use higher scale material model for the local embossment models. This model scale is the mesoscale where the internal structure of the material is considered: the concrete is modeled by the coarse aggregates, the surrounding mortar matrix and by the interface elements on the aggregatematrix boundary. Recently researchers proposed several types of models in two fields for this material scale: discontinuous and continuous models e.g. [23–27]. Generally it can be told that this field of material modelling is a dynamically developing and promising research area and its models give very good accordance with experimental results. Further ambition is to improve the local models with mesoscale material model.
ysis of two way composite slabs, Journal of Constructional Steel Research 65
slabs: Experimental study and numerical treatment, Journal of Constructional Steel Research 66 (2010), 480–486, DOI 10.1016/j.jcsr.2009.10.012. 8 Seres N, Dunai L, Experimental and numerical studies on concrete encased embossments of steel strips under shear action for composite slabs with profiled steel decking, Steel and Composite Structures 11 (2011), 39–58. ISSN: 1229-9367. 9 Fanning P, Nonlinear models of reinforced and post tensioned concrete beams, Electronic Journal of Structural Engineering 2 (2001), 111–119, available at www.ejse.org. 10 Seres N, Numerical modelling of interface interlock of composite floors with profile deck, MSc Thesis, Budapest University of Technology and Economics, Budapest, Hungary, 2007. 11 Ferrer M, Marimon F, Crisinel M, Designing cold-formed steel sheets for composite slabs: An experimentally validated FEM approach to slip failure mechanics, Thin-Walled Structures 44 (2006), 1261–1271, DOI 10.16/j.tws.2007.01.010. 12 ANSYS Release 10.0 Documentation, Ansys Inc., 2007. 13 Willam K J, Warnke E P, Constitutive model for the triaxial behaviour of concrete, ISMES (Bergamo, Italy), Proceedings of the International Association for Bridge and Structural Engineering, 1975, pp. 1–30. 14 Queiroz F D, Vellasco P C G S, Nethercot D A, Finite element modelling of composite beams with full and partial shear connection, Journal of Constructional Steel Research 63 (2007), 505–521, DOI 10.1016/j.jcsr.2006.06.003. 15 Özcan D M, Bayraktar A, Sahin A, Haktanir T, Türker T, Experimental and finite element analysis on the steel fiber-reinforced concrete (SFRC) beams ultimate behavior, Construction and Building Materials 23 (2009), 1064–1077, DOI 10.1016/j.conbuildmat.2008.05.010. 16 Padmarajaiah S K, Ramaswamy A, A finite element assessment of flexural strength of prestressed concrete beams with fiber reinforcement, Cement and Concrete Composites 24 (2002), 229–241, DOI 10.1016/S09589465(01)00040-3. 17 Kachlakev D I, Finite element analysis and model validation of shear deficient reinforced concrete beams strengthened with GFRP laminates, 2002, www.quakewrap.com. 18 Santhakumar R, Chandrasekaran E, Dhanaraj R, Analysis of retrofitted reinforced concrete shear beams using carbon fiber composites, Electronic Journal of Structural Engineering 4 (2004), 66–74, available at www.ejse. org. 19 Santhakumar R, Dhanaraj R, Chandrasekaran E, Behaviour of retrofitted reinforced concrete beams under combined bending and torsion: A
Modelling aspects of interface interlock in composite floors
2011 55 2
159
numerical study, Electronic Journal of Structural Engineering 7 (2007), 1–7, available at www.ejse.org. 20 Freire J, Analysis on the behaviour of the composite slabs under concentrated loads: Experimental tests and numerical simulations, MSc Thesis, Technical University Lisbon, 2009. 21 Mäkeläinen P, Sun Y, The longitudinal shear behaviour of a new steel sheeting profile for composite floor slabs, Journal of Constructional Steel Research 49 (1999), 117–128, DOI 10.1016/S0143-974X(98)00211-9. 22 Burnet M J, Oehlers D J, Rib shear connectors in composite profiled slabs, Journal of Constructional Steel Research 57 (2001), 1267–1287, DOI 10.1016/S0143-974X(01)00038-4. 23 Rousseau J, Frangin E, Marin P, Daudeville L, Multidomain finite and discrete elements method for impact analysis of a concrete structure, Engineering Structures 31 (2009), no. 11, 2735–2743, DOI 10.1016/j.engstruct.2009.07.001. 24 Leite J P B, Slowik V, Apel J, Computational model of mesoscopic structure of concrete for simulation of fracture processes, Computers and Structures 85 (2007), 1293–1303, DOI 10.1016/j.compstruc.2006.08.086. 25 Caballero A, Lopez C M, Carol I, 3D meso-structural analysis of concrete specimens under uniaxial tension, Computer Methods in Applied Mechanics and Engineering 195 (2006), 7182–7195, DOI 10.1016/j.cma.2005.05.052. 26 Ciancio D, Carol I, Cuomo M, Crack opening conditions at ’corner nodes’ in FE analysis with cracking along mesh lines. Consistent tangent formulation for 3D interface modelling of cracking/fracture in quasi-brittle materials, Engineering Fracture Mechanics 74 (2007), 1963–1982, DOI 10.1016/j.engfracmech.2006.10.005. 27 Eckardt S, Adaptive heterogeneous multiscale models for the nonlinear simulation of concrete, PhD Thesis, Bauhaus Universität Weimar, Weimar, Germany, 2009.
160
Per. Pol. Civil Eng.
Noémi Seres / László Dunai