Modelling Bounded Rationality In Agent-Based Simulations using the Evolution of Mental Models Bruce Edmonds, Centre for Policy Modelling Manchester Metropolitan University Aytoun Building, Aytoun Street, Manchester, M1 3GH, UK. Tel. +44 61 247 6479 Fax. +44 61 247 6802 E-mail:
[email protected] URL: http:/www.fmb.mmu.ac.uk/~bruce Abstract A technique for modelling economic agents with bounded and procedural rationality is presented. In this technique an agent has a population of mental models which evolve. This evolution is its learning process. This is embedded within an agent architecture which then exhibits several qualitative characteristics relevant to modelling human-like agents. Two example models using this technique are presented. The first is of agents attempting to learn their own utility function in the presence of structural change. The second is an extension of Brian Arthur’s ‘El Farol Bar’ model where evolutionary learning and communication is added.
1
Introduction
There are many possible ways of modelling economic agents. These traditionally fall into one of two camps, dating from Simon’s distinction between substantive and procedural rationality: this is often characterised as those with bounded rationality and those with no such bounds (although this is not strictly correct [24]). Although the latter type is more analytically tractable we are interested in the former type. The purpose of this paper is to report a particular approach to simulating economic agents with procedural and bounded rational agents such that their behaviour matches some of the broad qualitative characteristics of people. In particular it aims to capture a context-dependent, resource-bounded, open-ended, satisficing cognition such as might be feasible in a real agent1. The approach taken is to introduce these characteristics using evolutionary techniques. By using an approach to modelling learning that is close to that used in genetic programming (GP) [17], we open up a new range of possibilities in the credible modelling of such agents. Here an agent in the simulation has a population of candidate beliefs (or models) of its environment which evolve. This evolution is its learning mechanism. As well as differing from traditional economic models of agency, this also contrasts with agent modelling approaches that use “crisp” logic-like beliefs, and those approaches that only involve some inductive learning. In particular multiple and frequently inconsistent beliefs are held as a resource for future model development. In this way I simultaneously embrace Simon’s emphasis on the importance of the learning process and reject the sequential symbol processing picture of cognition he adopted. 1. Thus I have similar aims to [14].
After describing the basic model, I will then describe two examples that use these techniques: the first is of agents attempting to learn the form of a function in the presence of structural change and the second is an extension of a model of Brian Arthur’s (the ‘El Farol Bar’ model) where evolutionary learning and communication has been added.
2
Modelling Boundedly Rational Economic Agents
If you seek to model real economic agents then, unless you make some very sweeping assumptions, the entities in your software model will also need the broad characteristics of the real agents. This is in contrast to main-stream economics where, by and large, the agency nature of the agents is ignored, in favour of trying to capture their behaviour en masse. The purpose of an agent in such a model is also different from agents that are designed with a particular purpose in mind or for exploration of the most effective and flexible algorithm for a set of problems. In such modelling one seeks for as much veracity as is possible given the usual limitations of time, cost and technique and one does not necessarily look to design them to be efficient, general, or consistent in their beliefs. In particular we are interested in agents who: • do not have perfect information about their environment, in general they will only acquire information through interaction with the dynamically changing environment; • do not have a perfect model of their environment; • have limited computational power, so they can’t work out all the logical consequences of their knowledge; • have other resource limitations (e.g. memory); In addition to these bounds on their rationality, other characteristics are included, namely: • the mechanisms of learning dominate the mechanisms of deduction in determining their action; • they tend to learn in an incremental, path-dependent [3] (or “exploitative” [26]) way rather than attempting a global search for the best possible model; • even though they can’t perform inconsistent actions, they often entertain mutually inconsistent models. There are several possible ways of using evolving populations to simulate a community of economic agents: 1. each member of the evolving population corresponds to one agent; 2. each agent could be modelled by a whole evolving population; 3. the whole population could be modelled by the whole evolving population but without an individually intended agent gene correspondence. Method (1) has been used in several models of agents which evolve (e.g. [15, 29]), here the genetic development has nothing to do with the nature of an agent’s cognitive processes but helps determine its goals or strategies. Method (3) above is popular in economics (e.g. [2, 4]), but unless such a model predicts pertinent properties of real populations of agents, it is a bit of a fudge, and means that the observable behaviour and content of individual entities in the model do not have a clear referent in what is being modelled. This makes it far less useful if one wants to use such models to gain a detailed insight into the internal dynamics of populations. Method (2) actually addresses the cognitive process as the agent corresponds to a
population of mental models. This has been done before in a limited way in [25], but here agents have a fixed menu of possible models which do not develop.
3
The Agent Architecture
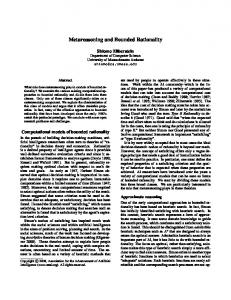
For the above (and other) reasons Scott Moss and I have developed a paradigm of modelling the learning that such agents engage in, as itself a process of modelling by the agents. In particular the importance of agents being able to induce the form as well as the parameterisation of their models. For more on this framework see [21]. Although economic agents primarily develop though a process of incremental learning they also use some deductive procedures. In real economic agents these processes may be arbitrarily mixed as well as developed and abstracted over different layers of an organisation. Here we will only look at a model which effectively separates out learning and deduction with an essentially unitary agent structure. The agent works within a given a priori body of knowledge (e.g. accounting rules). The agent may well make deductions from this in a traditional way and apply these to the current hypotheses. This body of a priori knowledge may also determine the syntax of the models the agent starts with, its principal goals, default actions, fitness functions and the operations to be applied to its models. Typically much of this a prior knowledge can be made implicit in the syntax of the agent’s models (which is the approach I have tended to take). The agent here has many models of its environment. Once started the agent incrementally develops and propagates these models in parallel according to a fitness function2 which is based on its memory of past data and effects of its actions, as well as the complexity and specificity of its models. It then selects the best such model according to that measure. From the best such model and its goals it attempts to determine its action using a search-based, deductive or quasi-deductive mechanism. It then takes that action and notes the effects in the environment for future use. The setup is illustrated below in figure 1. The development of these models (i.e. the learning) is modelled by an evolutionary process on this population of internal models. Important restrictions on such agents include the fact that it may have only limited information gained as the result of inter-action with its environment and that any action costs it so that it can not indulge in an extensive exploratory search without this being weighed against the benefit being gained (this is especially true given the course temporal graining of typical economic simulations).
2. A process of tournament selection that avoids having a single fitness function is also possible.
Goals
a priori beliefs restriction of models
Agent
Populations of Models (fittest in bold) Evaluation of Fitness Memory of Past Data and Actions
Machinery to decide an Action (inference)
Environment Observations
Actions
Figure 1: Basic Structure of a Simplified Economic Agent
4
Adapting the GP Paradigm
Among evolutionary techniques, the paradigm of GP [17] is particularly appropriate, due to the structure of the genome3. In GP the genes are tree-structures, which conform to a pre-defined syntax but otherwise can be of any shape or size. This makes them appropriate for representing a very wide range of models including expressions in formal languages and networks. These techniques, however, can not be blindly applied. For example, the efficiency of the learning process is only a secondary concern when seeking to model economic agents by their software cousins, but many of the other features of this approach for modelling learning in an economic agent are appropriate, namely: • the population of programs can represent a collection of multiple, competing models of the world with which it is concerned; • there is always at least one maximally fit individual model that can be used to react to events and from which appropriate deductions can be made – so that agents can ‘flip’ between models as appropriate; • the models are incrementally developed by the learning mechanism; • the fitness measure can be tailored to include aspects such as cost and complexity as well as the extent of the agreement with known data; • the language of representation of the models can be very general and expressive. In using the evolutionary paradigm in this sort of modelling we tend to: • represent the agent by a whole evolving population - each gene corresponding to one of its alternative models; • populations of agents are thus modelled as populations of evolving populations (i.e. populations of populations), with an intended agent to evolving population correspondence (e.g. [24]); • give the agents only small populations of models, representing limited memory; • base the fitness function on either its error in modelling known past data or the utility the agent would have gained in the past if it has used this model but also with other 3. GP researchers tend to call it a chromosome, presumably to indicate its complex nature.
factors such as the size of model and its predictivity (precision and range of applicability); • restrict the variation operators so towards an exploitative learning process, for example by restricting to such as generalisation, specialisation, averaging, combining and mutating; • and give them only a limited inferential ability to use its best model to choose its action. This paradigm needs to be integrated with an agent-based approach and adapted to relate to credible models of economic agents. In particular the cross-over operator is somewhat arbitrary when simulating the development of models in economic agents (although undeniably efficient). Also, when applied to large populations this introduces a globality to the search which is unrealistic. The fundamental difference between these agents and, say, logic-based agents, is that the updating of internal belief structures is done in a competitive evolutionary manner using a continuously variable fitness measure rather than in a “crisp” consistency preserving manner. This is appropriate in situations of great uncertainty caused by a rationality that is not able to completely “cope” with its environment but is more restricted in its ability. In the first example presented below (Section 5.2) we use a process of combining old models together as branches from a new node and introducing randomly generated small new models. This produces more realistic results, for example it allows for better fitting by parameterisation. The second application (Section 5.3) uses a more traditional GP setup using the cross-over operator, but with a low level of cross-over compared to propagation, applied to very small populations and with the addition of some new random models each generation.
5
Applications
Two example models are presented which use the techniques described above. Both are designed as investigations into possible processes between and within agents. The first example, where an agent is trying to learn a function (its own utility function) where that function may change (in form as well as parameterisation), is an attempt to capture the characteristic ‘path-dependent’ learning noticed in humans. The second attempts to capture some aspects of emergent sociality amongst co-evolving agents.
5.1 Implementation of the Models These models were both realised in a language called SDML (Strictly Declarative Modelling Language) - a programming language that has been specifically developed in-house for this type of modelling. This is a declarative object-oriented language with features that aid (and are optimized for) the modelling of social, organisational and economic agents. It is particularly suited for these models because is provides facilities for the easy programming of multi-layered object-orientated structures (so the programming of populations of genes within a population of agents is easy) with several levels of time (in this case weeks and days). For more details on this see [23] or http://www.cpm.mmu.ac.uk/sdml.
5.2 Example 1- utility learning agent facing structural change 5.2.1 General Description A simple application of the above approach is that of an economic agent that seeks to maximise its utility by dividing its spending of a fixed budget between two goods in each time
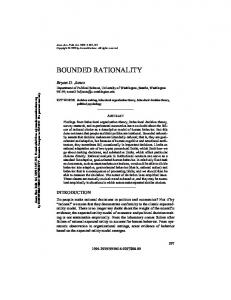
period. Unlike classical economic agents, this one does not know its utility function (even its form) but tries to induce it from past experience. To do this it attempts to model its utility with a function using the following nodes: +, -, *, % (division unless divisor is zero), max, min, log, exp, average, ifle1thenelse (a three-argument function which takes the second value if the first value is less than 1 and the third value thereafter, i.e. it is a graft of two functions at a point determined by a third - a sort of functional cross-over.), and terminals: a selection of random constants and variables representing the amounts bought of the two products. The advantage in this model is that we can introduce a severe structural change in the agent’s utility function and observe the result (imagine the agent has suddenly developed an allergy to the combination of the two products concerned). Initially, each agent is given a population of randomly generated models using the above nodes and terminals to a given fixed depth. Each subsequent time period it: 1. carries over its previous functional models; 2. produces some new ones by either combining the previous models with a new operator or by growing a new random one; 3. it then evaluates all its current models according to the minimum error of past data against what they would have predicted using past known data on amount it spent and the utility it gained (considerations such as the depth of the model are also factors in the fitness function); 4. it then selects the best models in terms of fitness for carrying over in the next period 5. it finds the fittest such model; 6. the action is determined by a limited binary search for the spending pattern that the model predicts will return the best utility, the cost of action inference is thus represented by the number of binary search refinements.; 7. finally it takes that action and observes its resulting utility. 5.2.2 Results Limiting the depth of the models created to 10, We preformed 10 runs over 100 time periods for each type of agent. The three types were characterised by the memory they were given and the number of new models they created each time period: respectively 10, 20 and 30. We call these 10-memory, 20-memory and 30-memory agents, they represent agents with different bounds on their rationality. The results were then averaged over these 10 runs. The first graph shows the (RMS) error of the agent’s best model of the utility function compared with the actual function (figure 2). It shows a great improvement between the 10-memory agent’s and 20-memory agents, but only a marginal improvement between 20 and 30-memory agent’s, suggesting the existence of a sort of minimum capacity for this task.
1.6
96
91
86
81
76
71
66
Time Periods
61
56
51
46
41
1
0
36
0.2
31
0.4
26
0.6
21
0.8
16
1
6
Error (RMS)
1.2
11
AAAA AAAA AAAA AAAA AAAA AAAA AAAA AAAA AAAA AAAA AAAA AAAA AAAA AAAAAAAAAAAA 10 AAAA AAAA AAAA AAAA AAAA AAAA AAAA AAAA AAAA AAAAAAAAAAAA 20 AAAA AAAA AAAA AAAA AAAA AAAA AAAA AAAA 30 AAAA AAAA AAAA AAAA AAAA AAAA AAAA AAAA AAAA AAAA AAAA AAAA AAAA AAAA AAAA AAAA AAAA AAAA AAAA AAAA AAAA AAAA AAAA AAAA AAAA AAAA AAAA AAAA AAAA AAAA AAAA AAAA AAAA AAAA AAAA AAAA AAAA AAAA AAAA AAAA AAAA AAAA AAAA AAAA AAAA AAAA AAAA AAAA AAAA AAAA AAAA AAAA AAAA AAAA AAAA AAAA AAAA AAAA AAAA AAAA AAAA AAAA AAAA AAAA AAAA AAAA AAAA AAAA AAAA AAAA AAAA AAAA AAAA AAAA AAAA AAAA AAAA AAAA AAAA AAAA AAAA AAAA AAAA AAAA AAAA AAAA AAAA AAAA AAAA AAAA AAAA AAAA AAAA AAAA AAAA AAAA AAAA AAAA AAAA AAAA AAAA AAAA AAAA AAAA AAAA AAAA AAAA AAAA AAAA AAAA AAAA AAAA AAAA AAAA AAAAAAAA AAAA AAAA AAAA AAAA AAAA AAAA AAAA AAAA AAAA AAAA AAAA AAAA AAAA AAAA AAAA AAAA AAAA AAAA AAAA AAAA AAAA AAAA AAAA AAAA AAAA AAAA AAAA AAAA AAAA AAAA AAAA AAAA AAAA AAAA AAAA AAAA AAAA AAAA AAAA AAAA AAAA AAAA AAAA AAAA AAAA AAAA AAAA AAAA AAAA AAAA AAAA AAAA AAAA AAAA AAAA AAAA AAAA AAAA AAAA AAAA AAAA AAAA AAAA AAAA AAAA AAAA AAAA AAAA AAAA AAAA AAAA AAAA AAAA AAAA AAAA AAAA AAAA AAAA AAAA AAAA AAAA AAAA AAAA AAAA AAAA AAAA AAAA AAAA AAAA AAAA AAAA AAAA AAAA AAAA AAAA AAAA AAAA AAAA AAAA AAAA AAAA AAAA AAAA AAAA AAAA AAAA AAAA AAAA AAAA AAAA AAAA AAAA AAAA AAAA AAAA AAAA AAAA AAAA AAAA AAAA AAAA AAAA AAAA AAAA AAAA AAAAAAAA AAAA AAAA AAAA AAAA AAAA AAAA AAAA AAAA AAAA AAAA AAAA AAAA AAAA AAAA AAAA AAAA AAAA AAAA AAAA AAAA AAAA AAAA AAAA AAAA AAAA AAAA AAAA AAAA AAAA AAAA AAAA AAAA AAAA AAAA AAAA AAAA AAAA AAAA AAAA AAAA AAAA AAAA AAAA AAAA AAAA AAAA AAAA AAAA AAAA AAAA AAAA AAAA AAAA AAAA AAAA AAAA AAAA AAAA AAAA AAAA AAAA AAAA AAAA AAAA AAAA AAAA AAAA AAAA AAAA AAAA AAAA AAAA AAAA AAAA AAAA AAAA AAAA AAAA AAAA AAAA AAAA AAAA AAAA AAAA AAAA AAAA AAAA AAAA AAAA AAAA AAAA AAAA AAAA AAAA AAAA AAAA AAAA AAAA AAAA AAAA AAAA AAAA AAAA AAAA AAAA AAAA AAAA AAAA AAAA AAAA AAAA AAAA AAAA AAAA AAAA AAAA AAAA AAAA AAAA AAAA AAAA AAAA AAAA AAAA AAAA AAAA AAAA AAAA AAAA AAAA AAAA AAAA AAAA AAAA AAAA AAAA AAAA AAAA AAAA AAAA AAAA AAAA AAAA AAAA AAAA AAAA AAAA AAAA AAAA AAAA
1.4
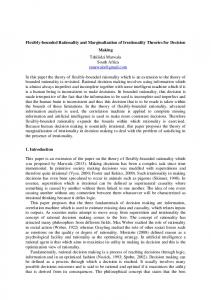
Figure 2: Error in Agent’s Best Model for Different Memories, Averaged Over 10 Runs When you look at the utilities achieved by the agents with different memories (figure 3), you see that a memory capacity (above 10) does not significantly increase the average utility over time, but it does dramatically effect the reliability of the utility it gains. If this were a firm with the utility being its profits, this reliability would almost as important as its average profit level.
Utility Gained / Maximum Possible
1 0.95 0.9 0.85 0.8 0.75 0.7 0.65 0.6 0.55
AAAA AAAA AAAA AAAA AAAA AAAA AAAA AAAA AAAA AAAA AAAA AAAA AAAA AAAA AAAA AAAA AAAA AAAA AAAA AAAA AAAA AAAA AAAA AAAA AAAA AAAA AAAA AAAA AAAA AAAA AAAA AAAA AAAA AAAA AAAA AAAA AAAA AAAA AAAA AAAA AAAA AAAA AAAA AAAA AAAA AAAA AAAA AAAA AAAA AAAA AAAA AAAA AAAA AAAA AAAA AAAA AAAA AAAA AAAA AAAA AAAA AAAA AAAA AAAA AAAA AAAA AAAA AAAA AAAA AAAA AAAA AAAA AAAA AAAA AAAA AAAA AAAA AAAA AAAA AAAA AAAA AAAA AAAA AAAA AAAA AAAA AAAA AAAA AAAA AAAA AAAA AAAA AAAA AAAA AAAA AAAA AAAA AAAA AAAA AAAA AAAA AAAA AAAA AAAA AAAA AAAA AAAA AAAA AAAA AAAA AAAA AAAA AAAA AAAA AAAA AAAA AAAA AAAA AAAA AAAA AAAA AAAA AAAA AAAA AAAA AAAA AAAA AAAA AAAA AAAA AAAA AAAA AAAA AAAA AAAA AAAA AAAA AAAA AAAA AAAA AAAA AAAA AAAA AAAA AAAA AAAA AAAA AAAA AAAA AAAA AAAA AAAA AAAA AAAA AAAA AAAA AAAA AAAA AAAA AAAA AAAA AAAA AAAA AAAA AAAA AAAA AAAA AAAA AAAA AAAA AAAA AAAA AAAA AAAA AAAA AAAA AAAA AAAA AAAA AAAA AAAA AAAA AAAA AAAA AAAA AAAA AAAA AAAA AAAA AAAA AAAA AAAA AAAA AAAA AAAA AAAA AAAA AAAAAAAA AAAA AAAA AAAA AAAA AAAA AAAA AAAA AAAA AAAA AAAA AAAA AAAA AAAA AAAA AAAA AAAAAAAA AAAA AAAA AAAA AAAA AAAA AAAA AAAA AAAA AAAA AAAA AAAAAAAA AAAA AAAA AAAA AAAA AAAA AAAA AAAA AAAA AAAAAAAA AAAA AAAA AAAA AAAA AAAA AAAA AAAA AAAA AAAA AAAA AAAA AAAA AAAA AAAA AAAA AAAA AAAA AAAA AAAA AAAA AAAA AAAA AAAA AAAA AAAA AAAA AAAA AAAA AAAA AAAA AAAA AAAA AAAA AAAA AAAA AAAA AAAA AAAA AAAA AAAA AAAA AAAA AAAA AAAA AAAA AAAA AAAA AAAA AAAA AAAA AAAA AAAA AAAA AAAA AAAA AAAA AAAA AAAA AAAA AAAA AAAA AAAAAAAA AAAAAAAA AAAA AAAA AAAA AAAA AAAA AAAA AAAA AAAA AAAA AAAA AAAA AAAAAAAAAAAA AAAA AAAA AAAA AAAA AAAA AAAA AAAA AAAA AAAA AAAA AAAA AAAA AAAA AAAA AAAA AAAA AAAA AAAA AAAA AAAA AAAA AAAA AAAA AAAA AAAA AAAA AAAA AAAA AAAA AAAA AAAA AAAAAAAA AAAA AAAA AAAA AAAA AAAA AAAA AAAA AAAA AAAA AAAA AAAA AAAA AAAA AAAA AAAA AAAA AAAA AAAA AAAA AAAA AAAA AAAA AAAA AAAA AAAA AAAA AAAA AAAA AAAA AAAA AAAA AAAA AAAA AAAA AAAA AAAA AAAA AAAA AAAA AAAA AAAA AAAA AAAA AAAA AAAA AAAA AAAA AAAA AAAA AAAA AAAA AAAA AAAA AAAA AAAA AAAA AAAA AAAA AAAA AAAA AAAA AAAA AAAA AAAA AAAA AAAA AAAA AAAA AAAA AAAA AAAA AAAA AAAA AAAA AAAA AAAA AAAAAAAA AAAA AAAA AAAA AAAA AAAA AAAA AAAA AAAA AAAA AAAAAAAA AAAA AAAA AAAA AAAA AAAA AAAA AAAA AAAA AAAA AAAA AAAA AAAA AAAA AAAA AAAA AAAAAAAA AAAA AAAA AAAA AAAA AAAA AAAA AAAA AAAA AAAA AAAA AAAA AAAA AAAA AAAA AAAA AAAA AAAA AAAA AAAA AAAAAAAA AAAA AAAA AAAA AAAAAAAA AAAA AAAA AAAA AAAA AAAA AAAA AAAA AAAAAAAA AAAA AAAAAAAA AAAA AAAA AAAA AAAA AAAA AAAA AAAA AAAA AAAA AAAA AAAA AAAA AAAA AAAA AAAA AAAA AAAA AAAA AAAA AAAA AAAA AAAA AAAA AAAA AAAA AAAA AAAA AAAA AAAA AAAA AAAA AAAA AAAA AAAA AAAA AAAAAAAA AAAAAAAA AAAA AAAA AAAA AAAA AAAA AAAA AAAA AAAA AAAA AAAA AAAA AAAA AAAA AAAA AAAA AAAAAAAAAAAAAAAA AAAA AAAA AAAA AAAA AAAA AAAA AAAA AAAA AAAA AAAA AAAA AAAA AAAA AAAAAAAA AAAA AAAAAAAA AAAA AAAA AAAA AAAAAAAA AAAA AAAA AAAA AAAA AAAA AAAA AAAA AAAA AAAA AAAA AAAAAAAA AAAA AAAA AAAA AAAA AAAA AAAA AAAA AAAA AAAA AAAA AAAA AAAA AAAA AAAA AAAA AAAA AAAA AAAA AAAA AAAA AAAA AAAA AAAA AAAA AAAA AAAA AAAA AAAA AAAA AAAA AAAAAAAAAAAA 10 AAAA AAAA AAAA AAAA AAAA AAAAAAAAAAAA AAAA AAAAAAAAAAAA AAAA 20 AAAA AAAA AAAA AAAA AAAA AAAA 30 AAAA AAAA AAAA AAAA AAAA AAAA AAAA AAAA AAAA AAAA
96
91
86
81
76
71
66
Time Periods
61
56
51
46
41
36
31
26
21
16
6
11
1
0.5
Figure 3: Utility Ratio Achieved for Agents with Different Memories, Averaged over 10 Runs The model does show traits found in the real world. For example, one phenomenon that is observed is that agents sometimes get “locked” into inferior models for a considerable length of time (as in [3]) - the model implies an inferior course of action, but this course of action is such that the agent never receives disconformation of its model. Thus this remains its best model in terms of the limited data it has, so it repeats that action. If, for example, some consumers find a satisfactory brand at an early stage in the development of their tastes and then they may never try any others - their (limited) experience will never disconfirm their model of what would give them most satisfaction, even when they would like other brands better.
To illustrate the sort of learning processes that can be modelled using this set-up, I imposed a severe structural break on the environment half way through (date 50). The utility function of the agent alternates between a traditional convex utility curve (the easy curve) to a concave one with two local maxima (the hard curve), see figure 4.
utility
easy curve
hard curve
Quantity bought of product 1 Figure 4: The Two Utility curves (product 2 = 100 - product 1) I ran the set-up with agents of different memory capacities (5, 10, 20 and 30 models) and maximum complexity of models (a depth of 5 and 10). I ran the simulation 10 times over 100 dates for each type of agent, averaging the results. I also performed these experiments with the utility curve switching from the hard curve to the easy and vice versa. This is not the place to give the full results of this model but to give a flavour of some of the results I show the utility gained by agents with a memory of 5 and 20 models respectively where the utility curve they are learning swaps suddenly from the easy to the hard (figure 5) and visa versa (figure 6). There are also corresponding graphs for the error in their best models (figure 7 and figure 8, respectively). Note how the dynamics are not symmetrical; the first utility curve it encounters conditions the agent for when this changes. The agents had considerably more success (in terms of utility gained) going from easy to hard rather than vice versa.
1 0.9 0.8
Relative Utility
0.7 0.6 0.5 0.4 0.3 0.2
AAAA AAAA AAAA AAAA AAAA AAAA AAAA AAAA AAAA AAAA AAAA AAAA AAAA AAAA AAAA AAAA AAAA AAAA AAAA AAAA AAAA AAAA AAAA AAAA AAAA AAAA AAAA AAAA AAAA AAAA AAAA AAAA AAAA AAAA AAAA AAAA AAAA AAAA AAAA AAAA AAAA AAAA AAAA AAAA AAAA AAAA AAAA AAAA AAAA AAAA AAAA AAAA AAAA AAAA AAAA AAAA AAAA AAAA AAAA AAAA AAAA AAAA AAAA AAAA AAAA AAAA AAAA AAAA AAAA AAAA AAAA AAAA AAAA AAAA AAAA AAAA AAAA AAAA AAAA AAAA AAAA AAAA AAAA AAAA AAAA AAAA AAAA AAAA AAAA AAAA AAAA AAAA AAAA AAAA AAAA AAAA AAAA AAAA AAAA AAAA AAAA AAAA AAAA AAAA AAAA AAAA AAAA AAAA AAAA AAAA AAAA AAAA AAAA AAAA AAAA AAAA AAAA AAAA AAAA AAAA AAAA AAAA AAAA AAAA AAAA AAAA AAAA AAAA AAAA AAAA AAAA AAAA AAAA AAAA AAAA AAAAAAAA AAAA AAAA AAAA AAAA AAAA AAAA AAAA AAAA AAAA AAAA AAAA AAAA AAAA AAAA AAAA AAAA AAAA AAAA AAAA AAAA AAAA AAAA AAAA AAAA AAAA AAAA AAAA AAAA AAAA AAAA AAAA AAAA AAAA AAAA AAAA AAAA AAAA AAAA AAAA AAAA AAAA AAAA AAAA AAAA AAAA AAAA AAAA AAAA AAAA AAAA AAAA AAAA AAAA AAAA AAAA AAAA AAAA AAAA AAAA AAAA AAAA AAAA AAAA AAAA AAAA AAAA AAAA AAAA AAAA AAAA AAAA AAAA AAAA AAAA AAAA AAAA AAAA AAAA AAAA AAAA AAAA AAAA AAAA AAAA AAAA AAAA AAAA AAAA AAAA AAAA AAAA AAAA AAAA AAAA AAAA AAAA AAAA AAAA AAAA AAAA AAAA AAAA AAAA AAAA AAAA AAAA AAAA AAAA AAAA AAAA AAAA AAAA AAAA AAAA AAAA AAAA AAAA AAAA AAAA AAAA AAAA AAAA AAAA AAAA AAAA AAAA AAAA AAAA AAAA AAAAAAAA AAAA AAAA AAAA AAAA AAAA AAAA AAAA AAAA AAAA AAAA AAAA AAAA AAAA AAAA AAAA AAAA AAAA AAAA AAAA AAAA AAAAAAAAAAAA AAAA AAAA AAAA AAAA AAAA AAAA AAAA AAAA AAAA AAAA AAAA AAAA AAAA AAAA AAAA AAAAAAAA AAAA AAAA AAAA AAAA AAAA AAAA AAAA AAAA AAAA AAAA AAAA AAAA AAAA AAAA AAAA AAAA AAAA AAAA AAAA AAAA AAAA AAAA AAAA AAAA AAAA AAAA AAAA AAAA AAAA AAAA AAAA AAAA AAAA AAAA AAAA AAAA AAAA AAAA AAAA AAAA AAAA AAAA AAAA AAAA AAAA AAAA AAAA AAAA AAAA AAAA AAAA AAAA AAAA AAAA AAAA AAAA AAAA AAAA AAAAAAAA AAAA AAAA AAAA AAAA AAAA AAAA AAAA AAAA AAAA AAAA AAAA AAAA AAAA AAAA AAAA AAAA AAAA AAAA AAAA AAAA AAAA AAAA AAAA AAAA AAAA AAAA AAAA AAAA AAAA AAAA AAAA AAAA AAAA AAAA AAAA AAAA AAAA AAAA AAAA AAAA AAAA AAAA AAAA AAAA AAAA AAAA AAAA AAAA AAAA AAAA AAAA AAAA AAAA AAAA AAAA AAAA AAAA AAAA AAAA AAAA AAAA AAAA AAAA AAAA AAAA AAAA AAAA AAAA AAAA AAAA AAAA AAAA AAAA AAAA AAAA AAAA AAAA AAAA AAAA AAAA AAAA AAAA AAAA AAAA
AAAAAAAA 5
20
0.1
96
91
86
81
76
71
66
61
56
51
46
41
36
31
26
21
16
11
6
1
0 Date
Figure 5: The utility of 20-model and 5-model agents going from easy to hard utility curves
1 0.9 0.8
Relative Utility
0.7 0.6 0.5 0.4 0.3 0.2
AAAA AAAA AAAA AAAA AAAA AAAA AAAA AAAA AAAA AAAA AAAA AAAA AAAA AAAA AAAA AAAA AAAA AAAA AAAA AAAA AAAA AAAA AAAA AAAA AAAA AAAA AAAA AAAA AAAA AAAA AAAA AAAA AAAA AAAA AAAA AAAA AAAA AAAA AAAA AAAA AAAA AAAA AAAA AAAA AAAA AAAA AAAA AAAA AAAA AAAA AAAA AAAA AAAA AAAA AAAA AAAA AAAA AAAA AAAA AAAA AAAA AAAA AAAA AAAA AAAA AAAA AAAA AAAA AAAA AAAA AAAA AAAA AAAA AAAA AAAA AAAA AAAA AAAA AAAA AAAA AAAA AAAA AAAA AAAA AAAA AAAA AAAA AAAA AAAA AAAA AAAA AAAA AAAA AAAA AAAA AAAA AAAA AAAA AAAA AAAA AAAA AAAA AAAA AAAA AAAA AAAA AAAA AAAA AAAA AAAA AAAA AAAA AAAA AAAA AAAA AAAA AAAA AAAA AAAA AAAA AAAA AAAA AAAA AAAA AAAA AAAA AAAAAAAA AAAA AAAA AAAA AAAA AAAA AAAA AAAA AAAA AAAA AAAA AAAA AAAA AAAA AAAA AAAA AAAA AAAA AAAA AAAA AAAA AAAA AAAA AAAA AAAA AAAA AAAA AAAA AAAA AAAA AAAA AAAA AAAA AAAA AAAA AAAA AAAA AAAA AAAA AAAAAAAA AAAA AAAA AAAA AAAA AAAA AAAA AAAA AAAA AAAA AAAA AAAA AAAA AAAA AAAA AAAA AAAA AAAA AAAA AAAA AAAA AAAA AAAA AAAA AAAA AAAA AAAA AAAA AAAA AAAA AAAA AAAA AAAA AAAA AAAA AAAA AAAA AAAA AAAA AAAA AAAA AAAA AAAA AAAA AAAA AAAA AAAA AAAA AAAA AAAA AAAA AAAA AAAA AAAA AAAA AAAA AAAA AAAA AAAA AAAA AAAA AAAA AAAA AAAA AAAA AAAA AAAA AAAA AAAA AAAA AAAA AAAA AAAA AAAA AAAA AAAA AAAA AAAA AAAA AAAA AAAA AAAAAAAA AAAAAAAA AAAA AAAA AAAA AAAA AAAA AAAAAAAA AAAA AAAA AAAA AAAA AAAA AAAA AAAA AAAA AAAA AAAA AAAA AAAA AAAA AAAA AAAA AAAA AAAA AAAA AAAA AAAA AAAA AAAA AAAA AAAA AAAA AAAA AAAA AAAA AAAA AAAA AAAA AAAA AAAA AAAA AAAA AAAA AAAA AAAA AAAA AAAA AAAA AAAA AAAA AAAA AAAA AAAA AAAA AAAA AAAA AAAA AAAA AAAA AAAA AAAA AAAA AAAA AAAA AAAA AAAA AAAA AAAA AAAA AAAA AAAA AAAA AAAA AAAA AAAA AAAA AAAA AAAA AAAA AAAA AAAA AAAA AAAA AAAA AAAA AAAA AAAA AAAA AAAA AAAA AAAA AAAA AAAA AAAA AAAA AAAA AAAA AAAA AAAA AAAA AAAA AAAA AAAA AAAAAAAA AAAA AAAA AAAA AAAA AAAA AAAA AAAA AAAA AAAA AAAA AAAA AAAA AAAA AAAA AAAA AAAA AAAA AAAA AAAA AAAA AAAA AAAAAAAA AAAA AAAA AAAA AAAA AAAA AAAA AAAA AAAA AAAA AAAA AAAA AAAA AAAA AAAA AAAA AAAA AAAA AAAA AAAA AAAA AAAA AAAAAAAA AAAA AAAA AAAA AAAA AAAA AAAA AAAA AAAA AAAA AAAA AAAA AAAA AAAA AAAA AAAAAAAA AAAA AAAA AAAA AAAA AAAA AAAA AAAA AAAA AAAA AAAA AAAA AAAA AAAA AAAA AAAA AAAA AAAA AAAAAAAA AAAA AAAA AAAA AAAA AAAA AAAA AAAA AAAA AAAA AAAAAAAA AAAA AAAAAAAA AAAA AAAA AAAA AAAA AAAA AAAA AAAA AAAAAAAA AAAAAAAA AAAA 5 AAAA AAAA AAAA AAAA AAAA AAAA AAAA AAAA AAAA AAAA AAAA AAAA AAAA AAAA AAAA AAAA AAAA AAAA AAAA AAAA AAAA AAAA AAAA AAAA AAAA AAAA AAAA AAAA AAAA AAAA 20 AAAA AAAA AAAA AAAA AAAA AAAA AAAA AAAA AAAA AAAA AAAA AAAA AAAA AAAA AAAA AAAA AAAA AAAA AAAA AAAA AAAA AAAA AAAA AAAA AAAA AAAA AAAA AAAA AAAA AAAA AAAA AAAA AAAA AAAA AAAA AAAA
0.1
96
91
86
81
76
71
66
61
56
51
46
41
36
31
26
21
16
11
6
1
0 Date
Figure 6: The utility of 20-model and 5-model agents going from hard to easy utility curve
AAAA AAAAAAAA AAAAAAAA AAAA 5
20
96
91
86
81
76
71
66
61
56
51
46
41
36
31
26
21
16
11
6
AAAA AAAA AAAA AAAA AAAA AAAA AAAA AAAA AAAA AAAA AAAA AAAA AAAA AAAA AAAA AAAAAAAA AAAA AAAA AAAA AAAA AAAA AAAA AAAA AAAA AAAA AAAA AAAA AAAA AAAA AAAA AAAA AAAA AAAA AAAA AAAA AAAA AAAA AAAA AAAA AAAA AAAA AAAA AAAA AAAA AAAA AAAA AAAA AAAA AAAA AAAA AAAA AAAA AAAA AAAA AAAA AAAA AAAA AAAA AAAA 0.6 AAAA AAAA AAAA AAAA AAAA AAAA AAAA AAAA AAAA AAAA AAAA AAAA AAAA AAAA AAAA AAAA AAAA AAAA AAAA AAAA AAAA AAAA AAAA AAAA AAAA AAAA AAAA AAAA AAAA AAAA AAAA AAAA AAAA AAAA AAAA AAAA AAAA AAAA AAAA AAAA AAAA AAAA AAAA AAAA AAAA AAAA AAAA AAAA AAAA AAAA AAAA AAAA AAAA AAAA AAAA AAAA AAAA AAAA AAAA AAAA AAAA AAAA AAAA AAAA AAAA AAAAAAAA AAAA AAAA AAAA AAAA AAAAAAAA AAAA AAAA AAAAAAAA AAAA AAAA AAAA AAAA AAAA AAAA AAAA AAAA AAAA AAAA AAAA AAAAAAAA AAAA AAAA AAAA AAAA AAAA AAAA AAAA AAAA AAAAAAAA AAAA AAAA AAAA AAAA AAAA AAAA AAAA AAAA AAAA AAAA AAAA AAAA AAAA AAAA AAAA AAAA AAAA AAAA AAAA AAAA AAAA AAAA AAAA AAAA AAAA AAAA AAAA AAAA AAAA AAAA AAAA AAAA AAAA AAAA AAAA AAAA AAAA AAAAAAAA 0.5 AAAA AAAA AAAA AAAA AAAA AAAA AAAA AAAA AAAA AAAA AAAA AAAA AAAA AAAA AAAA AAAA AAAA AAAA AAAA AAAA AAAA AAAA AAAA AAAA AAAA AAAA AAAA AAAA AAAA AAAA AAAA AAAA AAAA AAAA AAAA AAAA AAAA AAAA AAAA AAAA AAAA AAAA AAAA AAAA AAAA AAAA AAAA AAAA AAAA AAAA AAAA AAAA AAAA AAAA AAAA AAAA AAAA AAAA AAAA AAAA AAAA AAAA AAAA AAAA AAAA AAAA AAAA AAAA AAAA AAAA AAAA AAAA 0.4 AAAA AAAA AAAA AAAA AAAA AAAA AAAA AAAA AAAA AAAA AAAA AAAA AAAA AAAA AAAA AAAA AAAA AAAA AAAA AAAA AAAA AAAA AAAA AAAA AAAA AAAA AAAA AAAA AAAA AAAA AAAA AAAA AAAA AAAA AAAA AAAA AAAA AAAA AAAA AAAA AAAA AAAA 0.3 AAAA AAAA AAAA AAAA AAAA AAAA AAAA AAAA AAAA AAAA AAAA AAAA AAAA AAAA AAAA AAAA AAAA AAAA AAAA AAAA AAAA AAAA AAAA AAAA AAAA AAAA AAAA AAAA AAAA AAAA AAAA AAAA AAAA AAAA AAAA AAAA AAAA AAAA AAAA AAAA AAAA AAAA AAAA AAAA AAAA AAAA AAAA AAAA AAAA AAAA AAAA AAAA AAAA AAAA 0.2 AAAA AAAA AAAA AAAA AAAA AAAA AAAA AAAA AAAA AAAA AAAA AAAA 0.1 AAAA AAAA AAAA AAAA AAAA AAAA AAAA AAAA AAAA AAAA 0 AAAA
1
RMS Error
0.7
Date
Figure 7: The RMS Error of the best model of 20-model and 5-model agents going from easy to hard utility functions
0.7
AAAAAAAAAAAA AAAAAAAAAAAA 5
20
96
91
86
81
76
71
66
61
56
51
46
41
36
1
0
31
0.1
26
0.2
21
0.3
16
0.4
11
RMS Error
0.5
AAAA AAAA AAAA AAAA AAAA AAAA AAAA AAAA AAAA AAAA AAAA AAAA AAAA AAAA AAAA AAAA AAAA AAAA AAAA AAAA AAAA AAAA AAAA AAAA AAAA AAAA AAAA AAAA AAAA AAAA AAAA AAAA AAAA AAAA AAAA AAAA AAAA AAAA AAAA AAAA AAAA AAAA AAAA AAAA AAAA AAAA AAAA AAAA AAAA AAAA AAAA AAAA AAAA AAAA AAAA AAAAAAAA AAAA AAAA AAAA AAAA AAAA AAAA AAAA AAAA AAAA AAAA AAAA AAAA AAAA AAAA AAAA AAAA AAAA AAAA AAAA AAAA AAAA AAAA AAAA AAAA AAAA AAAA AAAA AAAA AAAA AAAA AAAA AAAA AAAA AAAA AAAA AAAA AAAA AAAA AAAA AAAA AAAA AAAA AAAA AAAA AAAA AAAA AAAA AAAA AAAA AAAA AAAA AAAA AAAA AAAA AAAA AAAA AAAA AAAA AAAA AAAA AAAAAAAA AAAA AAAA AAAA AAAAAAAA AAAA AAAA AAAA AAAA AAAA AAAA AAAA AAAA AAAA AAAA AAAA AAAA AAAA AAAA AAAA AAAA AAAA AAAA AAAA AAAA AAAA AAAA AAAA AAAA AAAA AAAA AAAA AAAA AAAA AAAA AAAA AAAA AAAA AAAA AAAA AAAA AAAA AAAA AAAA AAAA AAAA AAAA AAAA AAAA AAAA AAAA AAAA AAAA AAAA AAAA AAAA AAAA AAAA AAAA AAAA AAAA AAAA AAAA AAAA AAAA AAAA AAAA AAAA AAAA AAAA AAAA AAAA AAAA AAAA AAAA AAAA AAAA AAAA AAAAAAAA AAAA AAAA AAAA AAAA AAAA AAAA AAAA AAAA AAAA AAAA AAAA AAAA AAAA AAAA AAAA AAAA AAAA AAAA AAAA AAAA AAAA AAAA AAAA AAAA AAAA AAAA AAAA AAAA AAAA AAAA AAAA AAAA AAAA AAAA AAAAAAAA AAAA AAAA AAAA AAAA AAAA AAAA AAAA AAAA AAAA AAAA AAAA AAAA AAAA AAAA AAAA AAAA AAAA AAAA AAAA AAAA AAAA AAAA AAAA AAAA AAAA AAAA AAAA AAAA AAAA AAAA AAAA AAAA AAAA AAAA AAAA AAAA AAAA AAAA AAAA AAAA AAAA AAAA AAAA AAAA AAAA AAAA AAAA AAAA AAAA AAAA AAAA AAAA AAAA AAAA AAAA AAAA AAAA AAAA AAAA AAAA AAAA AAAA AAAA AAAA AAAA AAAA AAAA AAAA AAAA AAAA AAAA AAAA AAAA AAAA AAAA AAAA AAAA AAAA AAAA AAAA AAAA AAAA AAAA AAAA AAAA
6
0.6
Date
Figure 8: The RMS Error of the best model of 20-model and 5-model agents going from hard to easy utility functions
To give a flavour of the sort of models these agents develop, in run 1 of the 30-memory agent batch the agent achieved the following model by date 75: [average [[divide [[add [[constant 1.117] [amountBoughtOf 'product-2']]] [average [[amountBoughtOf 'product-2'] [constant 4.773]]]]] [min [[amountBoughtOf 'product-2'] [ifle1thenelse [[average [[amountBoughtOf 'product-2'] [constant 4.773]]] [constant 1.044] [add [[constant 1.117] [amountBoughtOf 'product-2']]]]]]]]]. The extent of the fit learnt by the agent is shown in figure 9.
90
32 75
100
Amount Spent on Product 1
80
0
0
70
1 0.5
60
1.5
50
2
40
3 2.5
30
Utility
3.5
20
4
AAAAAAAA AAAA AAAA AAAAAAAA AAAA AAAAAAAA AAAA AAAA ideal AAAAAAAA AAAAAAAA AAAA AAAAAAAA AAAAAAAAAAAA AAAA AAAA AAAA AAAA AAAA AAAA AAAA AAAA model at date AAAAAAAA AAAAAAAA AAAAAAAA AAAA AAAA AAAA AAAA AAAA AAAA AAAAAAAA AAAA AAAA AAAA model at date AAAAAAAAAAAA AAAA AAAA AAAA AAAAAAAA AAAA AAAAAAAA AAAA AAAA AAAA AAAAAAAA AAAA AAAAAAAA AAAA AAAA AAAA AAAA AAAA AAAA AAAA AAAA AAAA AAAA AAAA AAAA AAAA AAAA AAAA AAAA AAAA AAAA AAAA AAAA AAAA AAAA AAAAAAAA AAAA AAAA AAAA AAAA AAAA AAAA AAAA AAAA AAAA AAAA AAAAAAAA AAAA AAAA AAAA AAAA AAAA AAAA AAAA AAAA AAAAAAAA AAAA AAAA AAAA AAAA AAAAAAAA AAAA AAAA AAAA AAAA AAAA AAAA AAAA AAAA AAAAAAAAAAAAAAAA AAAAAAAA AAAA AAAA AAAA AAAA AAAA AAAA AAAA AAAA AAAA AAAA AAAA AAAAAAAA AAAA AAAA AAAA AAAA AAAAAAAA AAAA AAAA AAAA AAAA AAAA AAAA AAAAAAAA AAAA AAAA AAAA AAAA AAAA AAAA
10
5 4.5
Figure 9: Learnt vs. Actual Utility Functions, Run 1 of 30-memory Agents The purpose of this simulation is not to be an efficient maximiser of utility, but to model the learning of economic agents in a more credible way. It will only be vindicated (or otherwise) when compared to real data about these processes. This poses a problem: it is difficult to test for processes as distinct from states – almost any learning algorithm will eventually (given enough time and tuning) cluster around the optima. consequently testing via measures of the centrality of the distribution is unlikely to be very revealing. However, in a dynamic process the spread of behaviours around their average compared to time and simulation size might well do this (for an example of this see Section 5.3.1 below). However, the model does show traits found in the real world. I will highlight two.
Firstly, one phenomenon that is observed is that agents sometimes get “locked” into inferior models for a considerable length of time - the model implies an inferior course of action, but this course of action is such that the agent never receives disconformation of its model. Thus this remains its best model in terms of the limited data it has, so it repeats that action. If, for example, some consumers find a satisfactory brand at an early stage in the development of their tastes and then they never try any others - their (limited) experience will never disconfirm their model of what would give them most satisfaction, even when they would like other brands better. Secondly, the biasing effect of prior learning is clearly shown when change occurs. Agents achieved significantly higher utilities on the easy curve when they learnt this first. Learning about the hard curve first biased their learning about the easy curve (figure 5 and figure 6). This does capture some of the context-dependency that are observed with human agents – past learning does significantly influence future performance. In particular that it is easier to learn some things if you start with easy examples [11].
5.3 Example 2 - Communication, Learning and the El Farol Bar Problem 5.3.1 The El Farol Bar Model In 1994, Brian Arthur introduced the ‘El Farol Bar’ problem as a paradigm of complex economic systems. In this model a population of agents have to decide whether to go to the bar each thursday night. All agents like to go to the bar unless it is too crowded (i.e. when more that 60% of the agents go). So in order to optimise its own utility each agent has to try and predict what everybody else will do. The problem is set up so that any model of the problem that is shared by most of the agents is self-defeating. For if most agents predict that the bar will not be too crowded then they will all go and it will be too crowded, and vice versa. Brian Arthur modelled this by randomly giving each agent a fixed menu of potentially suitable models to predict the number who will go given past data (e.g. the same as two weeks ago, the average of the last 3 weeks, or 90 minus the number who went last time). Each week each agent evaluates these models against the past data and chooses the one that was the best predictor on this data and then uses this to predict the number who will go this time. It will go if this prediction is less than 60 and not if it is more than 60. As a result the number who go to the bar oscillates in an apparently random manner around the critical 60% mark (like figure 13), but this is not due to any single pattern of behaviour - different groups of agents swap their preferred model of the process all the time. Although each agent is applying a different model at any one time chosen from a different menu of models, with varying degrees of success, when viewed globally they seem pretty indistinguishable, in that they all regularly swap their preferred model and join with different sets of other agents in going or not. None takes up any particular strategy for any length of time or adopts any identifiably characteristic role. Viewed globally the agents in this model appear to be acting stochastically and homogeneously, despite the fact that the whole system is completely deterministic4 and each agent is initialised with a different repetoire of models. Zambrano [31] has interpreted this by saying that agents in this simulation are acting, en masse, as if they were using the mixed strategy predicted by game theory as the Nash equilibrium (namely choose a random number between 0 and 100 and go if it is 60 or below). That this is not the case can be established by looking at the variation in the agents behaviour as the simulation size increases – if they were 4. Deterministic once the agents have been ‘dealt’ their models and a random initial history generated.
acting collectively as if they were using such a mixed strategy the standard deviation of their attendance would decrease markedly as a proportion of the total size as that size increased (the SD would be npq , where n was the simulation size). This is not the case, as the results gained from runs of Arthur’s Model show. I re-ran the model 24 times over 500 dates for each of the following sized populations: 10, 18, 31, 56, 100, 180, 310, 560, 1000, 1800, 3100, 5600, 10000, 18000, 31000 and 100000 (with different initial histories and model selections for agents each time). In figure 10 we clearly see that the spread of levels of attendance is retained at large populations, suggesting that some sort of globally coupled chaos is occurring and not (predominately) a stochastic process. See [16] for the identification and exploration of such systems. Standard Deviation / Population Size
0.16 0.14 0.12 0.1 0.08 Number Attending
0.06
Game-theoretic Attendance
0.04 0.02 0 10
100
1000
10000
100000
Number of Agents in Simulation
Figure 10: Scaled Spread of Attendances against Population Size5 Also it is noticable that in this model,although the agent population is not significantly biased in its predictions when averaged, the individual agent’s predictions were not converging to the ‘truth’ because the trend in the spread of their prediction error’s did not reduce (as a proportion of the population size) with larger populations (figure 11). Thus in an important respect these agents were not acting in aggregate as if they each had the essentially correct model of their economy. Thus Arthur’s model goes beyond mainline economic models; we shall see that if we further extend it with evolutionary learning and communication that other such traits will emerge, such as heterogeneity.
5. The lines either side of the line showing SD of prediction error shows the spread over the 24 runs at each size.
Standard Deviation of Predictions
10000 Pred Sd Av-Sd Pred Sd Av Pred Sd Av+Sd Theoretical
1000
100
10
1 10
100
1000
10000
100000
0.1 Total Number of Agents
Figure 11: The Spread of the Agents Predictive Errors vs. Theory 5.3.2 Extending the El Farol Model I extend Arthur’s model by adding learning using an adapted GP process and by introducing communication with other agents before making their decision whether to go to the El Farol Bar. Each of the agents’ models of the environment is composed of a pair of expressions: one to determine the action (whether to go or not) and a second one to determine their communication with other agents. The action can be dependent upon both the content and the source of communications received from other agents. Although the beliefs and goals of other named agents are not explicitly represented by the agent, they emerge implicitly in the effects of the their’ models. The two parts of each model are expressions from a two-typed language specified (by the programmer) at the start6. A simple but real example is shown in figure 12 below. Translated this example means: that it will say that it will go to the El Farol Bar if the trend predicted over observed number going over the last two weeks is greater than 5/3 (the total population was 5 in this example); but it will only actually go if it said it would go or if barGoer-3 said it will go. talk:
[greaterThan [trendOverLast [2]] [divide [5] [3]]]
action:
[OR [saidBy ['barGoer-3']] [ISaid]]
Figure 12: A simple example model The agent gains utility by going to the El Farol Bar when it is not too crowded. Thus each agent is competitively developing its models of what the other agents are going to do.
6. Strictly this is a Strongly Typed GP [20].
Number who went (out of 10)
5.3.3 Results and A Case Study From the Model In the output of the model the attendance at the bar fluctuates unevenly about the critical number of patrons (see the example plot in figure 13).
Time (in notional weeks)
Figure 13: Number of people going to El Farol’s each week in a typical run
SD of fitness of agent’s models
The average fitness of the agents’ models fluctuates wildly at the beginning but as the simulation progresses they settle down somewhat but not down to zero. The deviance between different models of the same agent reduces only slightly (figure 14).
Time (in notional weeks)
Figure 14: The change in variance (in standard deviations) of the Agents’ population of models over time in (another) typical run The graph of the utilities gained shows that different agents predominate at different times during the simulation with no one agent permanently dominating the others (figure 15).
gained by agents (smoothed) utility
Time (in notional weeks)
Figure 15: (smoothed) utility gained by agents over time What is perhaps more revealing is the detail of what is going on, so I will exhibit here a case study of the agents at the end of a typical simulation. Here I have chosen a 5-agent simulation at date 100. In this simulation the agents judge their internal models by the utility they would have achieved over the previous 5 time periods. Each agent had 40 mental models of average depth of 5 generated from the language of nodes and terminal specified in figure 16. possible nodes for talk gene: greaterThan lessThan previous times plus minus divide averageOverLast quote boundedByPopulation wentLag trendOverLast randomIntegerUpTo saidByLastWeek possible terminals for talk gene: wentLastTime maxPopulation IPredictedLastWeek 1 2 3 4 5 possible nodes for action gene: AND OR NOT saidBy possible terminals for action gene: randomDecision ISaidYesterday IWentLastWeek T F 'barGoer-1' 'barGoer-2' 'barGoer-3' 'barGoer-4' 'barGoer-5' 1 2 3 4 5
Figure 16: Possible nodes and terminals of the tree-structured genes The formal languages indicated in figure 16 allow for a great variety of possible models, including arithmetic projections, stochastic models, models based on an agents own past actions, or the actions of other agents, logical expressions and simple trend projections. The utility that agents get is 0.4 if they go when it is too crowded, 0.5 if they stay at home and 0.6 if they go when it is not too crowded (where too crowded means greater than 60% of the total population). The best (and hence active) genes of each agent are summarised in figure 17. I have simplified each so as to indicate its immediate logical effect only. The actual genes contain much logically redundant material which may put in an appearance in later populations due to the activity of cross-over in producing later models. Also it must be remembered that other alternative models may well be selected in subsequent weeks, so that the behaviour of each agent may ‘flip’ between different modes (represented by different models) depending on the context of the other agent’s recent behaviour.
talk-1: averageOverLast(numWentLast) > previous(trendOverLast(numWentLast)) action-1: wentLastTime talk-2: trendOverLast(numWentLast) - 2 * numWentLag(2) > numWentLag(numWentLast) action-2: NOT Isaid talk-3: randomNumberUpTo(8) < 8/3 action-3: True talk-4: averageOverLast(4) / averageOverLast(5) < numWentLag(15) action-4: (Isaid AND randomDecision) OR (saidBy agent-2) talk-5: trandOverLast(20) < numWentLag(2) - averageOverLast(numWentLast) action-5: randomDecision OR (saidBy agent-4)
Figure 17: Simplified talk and action genes for the five agents at date 100 The effect of the genes is tricky to analyse even in its simplified form. For example agent-1 will tell its friends it will go to El Farol’s if the average attendance over a previous number of time periods (equal to the number who went last time) is greater than the predicted number indicated by the trend estimated over the same number of time periods but evaluated as from the previous week! However its rule for whether it goes is simpler - it goes if it went last week7. You can see that for only one agent what it says indicates what it does in a positive way (agent 4) and one which will do the exactly the opposite of what it says (agent 2). It may seem that agents 1 and 3 are both static but this is not so because figure 17 only shows the fittest genes for each agent at the moment in terms of the utility they would have gained in previous weeks. During the next week another gene may be selected as the best. The interactions are summarised in figure 18, which shows the five agents as numbered circles. It has simple arrows to indicate a positive influence (i.e. if agent-2 says she is going this makes it more likely that agent-4 would go) and crossed arrows for negative influences (e.g. if agent-2 says she will go this makes it less likely she will go). The circles with an “R” represent a random input. 1
3
4
2
R
5
R
Figure 18: Talk to action causation It is not obvious from the above, but agent-2 has developed its action gene so as to gradually increase the number of ‘NOT’s. By date 100 it had accumulated 9 such ‘NOT’s (so
7. This is not a trivial action rule, since whether it went last week might have been determined by a different internal model.
that it actually read NOT [NOT [... NOT [Isaid]...]]). In this way it appears that it has been able to ‘fool’ agent-4 by sometimes lying and sometimes not. 5.3.4 The emergence of heterogeneity In contrast to Arthur’s model, this model shows the clear development of different 8 roles . By the end of the run described above agent-3 and agent-1 had developed a stand-alone repetoire of strategies which largely ignored what other agents said. Agent-3 had settled on what is called a mixed strategy in game theory, namely that it would go about two-thirds of the time in a randomly determined way, while agent-1 relied on largely deterministic forecasting strategies. The other three agents had developed what might be called social strategies. Agent-2 seemed to have come to rely on ‘tricking’ agent-4 into going when it was not, which explains the gradual accumulation of ‘NOT’s in the example gene described above. Agent-4 has come to rely (at least somewhat) on what agent-2 says and likewise agent-5 uses what agent-4 says (although both mix this with other methods including a degree of randomness). Thus although all agents were indistinguishable at the start of the run in terms of their resources and computational structure, they evolved not only different models but also very distinct strategies and roles. One conclusion to be drawn from this model is that, if only global communication is allowed, and internal models have limited expressiveness, then it might be preventing the emergence of heterogeneity. Or, to put it another way, endowing agents with the ability to make real social distinctions and (implicit or explicit) models of each other enables socially situated behaviour to emerge. This phenomena does not emerge in Arthur’s original model.. Such a conclusion marries well with other models which enable local and specific communication between its agents (e.g. [1]) and goes some way to addressing the criticisms in [13]. For a more philosophical analysis of the nature of the social processes taking place in this model see [10].
6
Conclusion
An evolutionary model of cognition has been presented which has some of the qualitative characteristics relevant to economic agents, namely: • satisficing rather than optimising behaviour; • flexible learning – it can cope with structural change9, this is facilitated by the parallelism so that it can ‘flip’ between models; • path-dependency – the agent’s population of models forms the context for subsequent learning; • serendipidous – the learning process has the power to come up with models not envisioned by the programmer; • boundedly rational – both the number of models and the inference from them can be controlled;
8. Some of what I describe is not evident from the short description above because the strategy of an agent is determined by its whole collection of mental models. 9. For a good example of this see [24].
• realisable – the implicit parallelism of the evolutionary model makes it a credibly fast model; • open-ended – the structure of the genome allows for theoretically unlimited expressiveness of the agent’s models. It does this using a class of models (evolutionary models) that is being increasingly studied, formalised and understood. Also it allows the programmer to introduce the following aspects of behaviour in a natural way: • the impact of a priori knowledge and the bias of the internal language of representation – since this is explicitly determined by the programmer; • the interaction of learning and inference; • the different types of model evaluation – there are many possible ways of deciding a model’s fitness, including the accuracy of the models, the utility the models would have gained, and various aspects of cost and complexity; • different mixes of genetic operators [9]. At the moment such models only indicate their possible use as relevant models of cognition in economic agents, but I hope that the examples presented here persuade you of their potential expressive power.
Acknowledgements Thanks to Scott Moss and Edmund Chattoe for discussions and comments on drafts of this paper. SDML has been developed in VisualWorks 2.5.1, the Smalltalk-80 environment produced by ParcPlace-Digitalk. Free distribution of SDML for use in academic research is made possible by the sponsorship of ParcPlace-Digitalk (UK) Ltd. The research reported here was funded by the Economic and Social Research Council of the United Kingdom under contract number R000236179 and by the Faculty of Management and Business, Manchester Metropolitan University.
References [1] Akiyama, E. and K. Kaneko, 1996. Evolution of Cooperation, Differentiation, Complexity, and Diversity in an Iterated Three-person Game, Artificial Life, 2, 293-304. [2] Arifovic, J. (1994). Genetic Algorithm Learning and the Cobweb Model, Journal of Economic Dynamics and Control,18, 3-28. [3] Arthur, B. 1994. Inductive Reasoning and Bounded Rationality. American Economic Association Papers, 84: 406-411. [4] Axelrod, R. (1984). The Evolution of Cooperation, Basic Books, New York. [5] Bednarz, J. 1984. Complexity and Intersubjectivity. Human Studies, 7: 55-70. [6] Carneiro, R. L. 1987. The Evolution of Complexity in Human Societies and its Mathematical Expression. International Journal of Comparative Sociology, 28: 111-128. [7] Cooper, R., J. Fox, J. Farringdom and T. Shallice 1997. A Systematic Methodology for Cognitive Modelling. Artificial Intelligence, 85: 3-44. [8] Earley, P. C. and J. Brittain. 1992. Cross-Level Analysis of Organizations - Social Resource-Management Model. Research in Organizational Behaviour, 15: 357-408. [9] Edmonds, B. (1998). Meta-Genetic Programming: co-evolving the genetic operators. CPM Report 98-32, MMU, UK. (http://www.cpm.mmu.ac.uk/cpmrep32.html)
[10] Edmonds, B. (1997). Modelling Socially Intelligent Agents. AAAI Fall Symposium on Socially Intelligent Agents, Cambridge, MA, November 1997. (http://www.cpm.mmu.ac.uk/cpmrep26.html) [11] Elman, J.L. (1993). Learning and Development in Neural Networks – The Importance of Starting Small. Cognition, 48:71-99. [12] Gärdenfors, P. 1997. The pragmatic role of modality in natural language. 20th Wittgenstein Symposium, Kirchberg am Weshel, Lower Austria, 1997. [13] Gaylard, H. A Cognitive Approach to Modelling Structural Change. Workshop on Modelling Structural Change, Manchester Metropolitan University, May, 1996. (Also available at http://www.cpm.mmu.ac.uk/cpmrep20.html) [14] Gigerenzer, G and Goldstein, D. G. (1996). Reasoning the fast and frugal way: Models of bounded rationality. Psychological Review, 104, 650-669. [15] Holland, J. H. (1992). Adaptation in Natural and Artificial Systems, 2nd Ed., MIT Press, Cambridge, MA. [16] Kaneko, K. (1990). Globally Coupled Chaos Violates the Law of Large Numbers but not the Central Limit Theorem. Physics Review Letters, 65: 1391-1394. [17] Koza, J. R. 1992. Genetic Programming: On the Programming of Computers by Means of Natural Selection. Cambridge, MA: MIT Press. [18] Latane, B., A. Nowak and J. H. Liu. 1994. Measuring Emergent Social Phenomena Dynamism, Polarization and Clustering as Order Parameters of Social Systems. Behavioural Science, 39:1-24. [19] Luhmann, N. 1996. Soziale Systeme: Grundriß einer allgemeinen Theorie; 6. Auflage; Franfurt am Main, S.45ff. [20] Montana, D. J. 1995. Strongly Typed Genetic Programming, Evolutionary Computation, 3: 199-230. [21] Moss, S. J. and B. Edmonds, 1998. Modelling Economic Learning as Modelling. Systems and Cybernetics. 29:5-37. (http://www.cpm.mmu.ac.uk/cpmrep03.html) [22] Moss, S. J., B. Edmonds, and S. Wallis, 1997. Validation and Verification of Computational Models with Multiple Cognitive Agents. Centre for Policy Modelling Report 97-25, MMU, Manchester, UK. (http://www.cpm.mmu.ac.uk/cpmrep25.html) [23] Moss, S. J., H. Gaylard, S. Wallis, and B. Edmonds, forthcoming. SDML: A Multi-Agent Language for Organizational Modelling. Computational and Mathematical Organization Theory. (http://www.cpm.mmu.ac.uk:80/cpmrep16.html) [24] Moss, S. and Sent, E-M. (forthcoming). Boundedly versus Procedurally Rational Expectations. In Hallet, H and McAdam, P. (eds.), New Directions in Macro Economic Modelling, Kluwer. (http://www.cpm.mmu.ac.uk/cpmrep31.html) [25] Palmer, R.G. et. al. (1994). Artificial Economic Life - A simple model of a stockmarket. Physica D, 75, 264-274. [26] Penrose, E. (1972). The Growth of the Firm. Oxford, Blackwell. [27] Searle, J. R. 1969. Speech acts: an essay in the philosophy of language. London: Cambridge University Press. [28] Simon, H. 1957. Administrative behaviour: A study of decision-making processes in administrative organization. New York: Macmillan. [29] Vriend, N.J. (1995). Self-organization of markets: an example of a computational approach. Computational Economics, 8, 205-232. [30] Wittgenstein, L. 1953. Philosophical Investigations. Oxford: Blackwell. [31] Zambrano, E. 1997. The Revelation Principle of Bounded Rationality. Sante Fe working paper 97-06-060. (http://www.santafe.edu/sfi/publications/Abstracts/97-06-060abs.html)