This paper presents a mechanistic model which simulates diet selection and animal ..... A series of 86 simulation experiments were conducted using the diet.
Ecological Modelling, 57 (1991) 145-163
145
Elsevier Science Publishers B.V., Amsterdam
Modelling diet selection and intake for grazing herbivores H . D . B l a c k b u r n ~ a n d M.M. K o t h m a n n
Department of Rangeland Ecology and Management, TexasAgricultural Experiment Station, College Station, TX 77843, USA (Accepted 16 January 1991)
ABSTRACT Blackburn, H.D. and Kothmann, M.M., 1991. Diet selection and intake for grazing herbivores. Ecol. Modelling, 57: 145-163. This paper presents a mechanistic model which simulates diet selection and animal intake. It incorporates quantitative representations for preference, palatability and availability as they affect diet selection and intake by herbivores. Preference is defined by an index calculated from forage crude protein and digestibility and a user-assigned avoidance parameter. Palatability is related to potential restrictions to forage intake by anti-quality components. Dietary restrictions arising from low forage availability are simulated using a Michaelis-Menten-type function. Inputs of forage quality and availability are obtained from a forage dynamics model, and output from the diet model goes to an animal production model. Sensitivity analyses were conducted to determine the diet selection and intake responses to variations in selected model inputs and functions. Diet selection and nutrient intake were highly responsive to changes in forage growth rates, stock density, forage availability, and the forage quality functions in the desirability index. The model provides a working hypothesis for evaluating biological cause and effect mechanisms of diet selection and intake by grazing ruminants. Additionally, the level of resolution of the combined forage-diet-animal models is appropriate to provide a basis for developing management recommendations.
INTRODUCTION A t t e m p t s to s i m u l a t e the g r a z i n g b e h a v i o r o f h e r b i v o r e s have b e e n diverse a n d the d e g r e e o f c o m p l e x i t y d e p e n d e n t u p o n the p u r p o s e o f the
1 Present address: Department of State, Washington, DC 20523, USA. Approved for publication as Texas Agricultural Experiment Station Manuscript No. TA 25375. 0304-3800/91/$03.50 © 1991 - Elsevier Science Publishers B.V. All rights reserved
146
H.D. BLACKBURN
AND M.M. KOTHMANN
model (Rice et al., 1983; Loewer et al., 1987; Ungar and Noy-Meir, 1988; Senft, 1989). Studies have approached diet selection at many levels of spatial and temporal hierarchies (Senft et al., 1987), and at different levels of resolution with respect to biomass classification (Arnold and Dudzinski, 1978). McNaughton (1984) evaluated diet selection in terms of coevolution of plants and animals, while tactical aspects of diet selection have been considered by Ellis et al. (1976). It is apparent that no one hypothesis describing diet selection accounts for all significant sources of variation across environments. Instead, a blending of several elements from foraging theory will be necessary to model the response of animals to the forage environment (Senft et al., 1987; Senft, 1989). The concept of herbivores maximizing dietary energy may be valid; however, strategies for maximizing energy intake are complex. Range herbivore diets commonly contain a large number of plant species and plant parts indicating that they do not harvest forage in a purely hierarchical manner (Demment and Greenwood, 1988). Few models have attempted to bridge the gap between theory and management (Senft, 1989). There is a need to integrate concepts for botanical selection with forage quality and intake to simulate plant/animal interactions at a management scale of resolution. For such an effort to be successful, the major components driving diet selection and nutrient intake must be incorporated into the diet selection routine. The model of diet selection reported here differs from previously reported models in level of resolution and conceptual design. Both forage quality and availability are considered. Animal factors dealing with preference, palatability, and foraging ability have been incorporated into the model. It provides for interactions between forage quality and availability. The interaction between plants and animals can be observed as a dynamic process reflecting changes in herd structure and the physiological condition of plants and animals. This model was developed to apply diet selection theory to generate management level data, allowing grazing management concerns to be addressed. Generalized diet selection protocols were developed, giving the model broad applicability. This allows evaluation of interactions and feedback between animals and forages. Utilization of such models can greatly increase understanding of grazing behavior in dynamic environments. The objectives of this paper are to report the model structure and function and to demonstrate its ability to simulate plant/animal interactions at a management level of resolution. MODEL DESCRIPTION The diet selection model was constructed to interface a dynamic forage model with dynamic animal production models (Fig. 1). It receives input
147
SIMULATING DIET SELECTION
DIET MODEL CP,DMD(%}. . . . . . . . . . . . . . . . . . .
..
Norn~
~
Forage B~r~ss ~ ~ '''=" Animal Model CP.DmO~gl ~ i - Model ~ )
"~u~
I.,.i -1 ~' "~QoT I Update - Kgha
Fig. 1. A flow chart of the diet model and how it interacts with forage and animal models.
from the forage model described by Blackburn and Kothmann (1989) and provides inputs for the cattle production simulation model described by Doren et al. (1985) and the sheep or goat production simulation models described by Blackburn et al. (1987). The forage model simulates species or species groups partitioned into leaf and stem with live, recent dead, and old dead, referred to as forage pools. The number of species or species groups and forage pools simulated is determined by the objectives of the researcher and the level of resolution of data available to validate both forage and diet models. With this model, species with similar structural and growth characteristics can be grouped or simulated separately. Diverse species in the plant community should be partitioned to account for major sources of structural and nutritional heterogeneity. It is not necessary to simulate for all plant parts within species. The diet selection model has no state variables. It determines the amounts of dry matter, crude protein (cP) and digestible dry matter (DDM) to be transferred from each forage pool of the forage model to the animal model. We adopted the approach that large ruminant herbivores are basically generalist foragers. Concepts for preference, palatability, and harvestability have been implemented in the diet model in a unique approach which allows interactions between these components. Preference relates to factors affecting relative choice (not intake). Palatability addresses anti-quality factors which limit voluntary intake of a particular
148
H.D. BLACKBURN AND M.M. KOTHMANN
forage pool. Harvestability determines restrictions to the potential ingestion rate of each pool based on availability. Harvestability is a function of structural characteristics of the forage and the animal's prehensile ability. This mechanistic approach is responsive to a wide variety of forages and is readily adaptable to different animal species and locations. Inputs for the diet model are from three sources: (1) potential intake (kg) of the combined herd, from the animal production model; (2) availability (g m -2) and quality (percentages of cP and DDM)of each forage pool, from the forage model; and (3) values for avoidance, palatability, ungrazable residual, and the Michaelis constant (KM) for each forage pool, from user inputs. Both animal and forage inputs can vary across time. To illustrate the logic flow of the model, a summary of the steps used to determine a diet follows: (1) Calculate desirability of each forage pool based on cP, DDM and avoidance index. (2) Based on desirability index, calculate desired proportions for each forage pool. (3) If desired proportion exceeds palatability rating, limit intake from forage pool and re-proportion excess to other forage pools. (4) Determine total potential intake of desired diet using the weighted average of DDM and cP from the forage model and the physical limit equations and number of animals from the animal model. (5) Multiply desired proportions by total potential intake to determine desired intake of each forage pool. (6) Calculate harvestability of each forage pool. Evaluate for restricted availability of forage pools. If harvestability equals one for all forage pools or iteration equals 3, proceed to step 7, if not, return to step 1 and adjust desirability indexes of each forage pool using respective harvestability coefficient. (7) Calculate proportions of each forage pool based upon harvestable forage. Then calculate weighted average digestibility and percentage of crude protein of the diet and the animal intake correction factor; proceed to the animal model.
Model components Preference. An initial step in diet selection is determining which plants and plant parts will be more intensively sought. A desirability index is calculated for each forage pool: DESIND
=
CFDIG
* CFCP
* AVOID
(1)
SIMULATINGDIETSELECTION
149
where CFDIG = 1.67 * ( D D M - 0.20)
(2)
CFCP = 3.509 * (CP --0.015)
(3)
and DESIND is desirability index for a forage pool, DDM digestible dry matter proportion of the forage pool, cP crude protein proportion of the forage pool, and AVOID avoidance parameter for the forage pool (0.0 to 1.0). Avoidance is a parameter that is designed to reflect negative preference factors. Preference may be reduced by chemical a n d / o r physical characteristics of forage that are not reflected in cP or DDM. The avoidance parameter is used to adjust for these differences by assigning an avoidance value less than 1.0. The coefficients CFDI6 and CFCP can be adjusted for different animal species by adjusting the intercept and slope a n d / o r by raising them to a power greater than 1.0. This alters the sensitivity of diet selection to forage quality. Desired dietary proportions (PROP) are calculated from the desirability indexes (equation 4). The equation for desired proportion for each forage pool is: PROP/ = DESINDi/
E
(DESINDi)
(4)
i=l,n
Palatability. Palatability is a parameter ranging from 0.0 to 1.0. Palatability reflects factors other than DDM and cP which restrict potential intake of forage. The proportion of forage taken from any pool can not exceed its palatability rating. If a desired proportion is greater than its palatability rating, the difference between desired proportion and the upper limit set by palatability is re-proportioned among forage pools with no or unmet palatability limits. Examples of range species with potential palatability limitations are sagebrush (Artemisia spp.) and juniper (Juniperus spp.) which contain large amounts of phenolic compounds. Livestock grazing these species will not consume to their potential intake, even if an adequate amount is available and no other forage is present.
Intake. The model calculates a weighted average digestibility of the desired diet and uses the physical limit equations presented by Sanders and Cartwright (1979) or Blackburn et al. (1987) to simulate potential forage d e m a n d for each class of livestock. The values are multiplied by animal numbers per class and summed across animal classes to determine total potential intake. Potential intake of each forage pool is calculated as the
150
H.D. BLACKBURN AND M.M. KOTHMANN
product of the total potential intake and the desired proportion for that pool. If potential intake is not restricted by availability of any forage pool, the diet model passes the weighted average DDM and cP of the diet and an animal intake correction coefficient (AIC) of 1.0 to the animal model.
Harvestability coefficient.
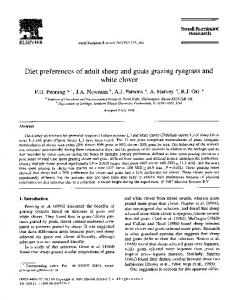
Potential forage intake and standing crop are used to calculate a harvestability coefficient for each pool. The harvestability coefficient determines the proportion of desired intake that can be obtained from a forage pool. If the harvestability coefficient of any pool is less than one, the model adjusts the desirability index of each forage pool by multiplying by its harvestability coefficient and then makes another iteration through the diet selection process. If a deficit still exists after three iterations, the accumulated intake is divided by the potential intake calculated during the third iteration to determine the AI¢ value. An AIC value less than 1.0 reduces intake simulated by the animal model for each animal by the complement of the AIC. It should be noted that the harvestability coefficient is associated with individual forage pools; whereas, AIC is associated with the total diet. Several hypotheses have been proposed as to the possible shape of the function relating forage availability and intake. Noy-Meir (1978) suggested that the shape of the function could be sigmoidal, a saturation curve or a ramp function. We used a saturation curve, in the form of a MichaelisMenten function (Fig. 2). The Michaelis-Menten equation (5) used to calculate the harvestability coefficient (range 0.0 to 1.0) is: HARVEST/ :
(1.1 *
FMAX(10)
FORAGE i)/(KMi
FMAX(50)
-JI- F O R A G E i )
(5)
FMAX(100)
1.10 1.00 .-~_ . , .Q ®
o. s
I
0~ 0
200
400
600
800
1000
1200
Forage ( k g / h o ) Fig. 2. How apprehension of forage would change given different rates of decline of harvestability (Km). Km values of 1,5, and 10 would correspond to the FMAX of 10, 50, and 100, respectively. FMAX represents the point where forage either becomes limiting or unlimiting.
151
SIMULATING DIET SELECTION
where FORAGE i is the biomass (kg ha -1) present for the ith forage pool, KMi the Michaelis constant, and 1.1 the asymptotic value allowing HARVEST/ to exceed 1.0. If HARVEST/ > 1, then HARVEST/ equals 1. The Michaelis-Menten equation allows flexibility in varying the rate of forage harvestability by changing the value of KM. Restrictions to intake may result from low forage density a n d / o r low plant stature which reduce bite size. The harvestability coefficient integrates the relationships between availability of a forage pool, bite size of the grazing species and prehensile ability of the grazing species. The value used for KM varies depending upon the animal species and plant species, part and growth form. The KM value for leaves of a grass with erect growth form may be quite small; whereas, a grass with decumbent or prostrate growth form would have a larger KM value. The value selected for KM will also need to consider the animal's prehensile ability. In some situations there may be an ungrazable residual for a forage pool. This occurs because the forage is above or below the potential grazing height or otherwise inaccessible to the animal being simulated. In such situations, the user specifies the quantity of ungrazable residual forage, and this value is subtracted from the existing forage biomass before the diet selection procedures are initiated. Different values for KM and ungrazable residual may be specified for different animal species on the same pasture. Two approaches can be used to determine values for KM. The selection of method depends upon the kind of information available. The first approach involves the basic assumptions made in the calculation of harvestability. If the minimum level (FMAX) where a forage pool has a harvestability of 1.0 is known; i.e., the minimum level of freely available forage, then equation (6) can be solved for KM. Algebraic manipulation of the harvestability equation yields KM for a specific forage pool: KMi=0.I
* FORAGE/
(at FMAXi)
(6)
The second approach is to utilize the Lineweaver-Burk plot (Bohinski, 1976) or a transformation/weight model (Ruppert et al., 1989). These procedures may give a precise estimate of KM~ but they require estimates of harvestability at different levels of forage biomass availability. Because KM, specified for each forage pool, is a new concept, few researchers have collected biomass data at this level of resolution. However, this provides an opportunity to better quantify the forage resource. If harvestability is less than 1.0, the amount of forage taken from the pool is determined as follows. All forage above the point of restricted availability (FMAX) is considered completely available. D e m a n d for forage of restricted availability will be adjusted downward to the proportion
152
H.D. BLACKBURN
AND M.M. KOTHMANN
indicated by the harvestability coefficient. This results in a deficit in the animal intake function. As in the physical world, when a deficit occurs, the animal, given time, will search for a replacement. To simulate this activity, desirability indexes are recalculated and adjusted by multiplying them by the harvestability coefficient. This allows animals to take additional increments from the deficit pool but shifts the diet selection emphasis to pools with greater harvestability. Time step. The forage and diet models are usually run on a 1-day time step. The sheep and goat models operate on a 15-day time step and the cattle model on a 30-day time step. Simulated daily intake from the diet model is used to update state variables in the forage model daily. Intake is accumulated over 15 or 30 days and passed to the animal model with the weighted average values for DDM, CP and AIC. SENSITIVITY ANALYSIS Methods A series of 86 simulation experiments were conducted using the diet model as the interface between a forage dynamics model (Blackburn and Kothmann, 1989) and a sheep production model (Blackburn et al., 1987). The simulated experiments formed a 2 x 2 × 3 × 7 factorial with two plant growth scenarios, two expressions of the desirability function, three levels of KM, and seven levels of stocking density, respectively. In addition, there was one simulation of forage biomass dynamics with no grazing (a control) for each plant growth scenario. All simulations were run for 210 days. The initial age of live leaf present on day 1 was set to 6.8 days. Avoidance and palatability parameters were set at 1.0 for all forage pools for all runs. This eliminated them from consideration in this sensitivity analysis to allow primary attention to be focused on the desirability and availability functions. Plant growth was constant during growth periods. The first plant growth treatment consisted of one species growing at the rate of 3.0 g m -2 d -1 from day 1 to 150 with initial live leaf biomass set at 10.0 g m -2. The second treatment consisted of two species with the one growing at the rate of 1.5 g m -e d -1 from day 1 to 150 (initial biomass of 10.0 g m -2) and the other growing at the rate of 1.5 g m -2 d -1 from day 31 to 180 (initial biomass set at zero). Eight stock densities (0, 5, 8, 10, 12, 15, 18, and 20 head ha -1) were evaluated to assess the effects of increasing forage demand. Grazing began
SIMULATING DIET SELECTION
153
on day 1 and continued through day 210 with constant stock density throughout all simulations. Two versions of the desirability function were used. The first version (DESIND1) was reported in equation (1). In the second version, CFDI6 and CFCP were each raised to the third power (DESIND2). The effect of this was to increase the model's sensitivity to forage quality. Three levels of KM (10, 50, and 100) were evaluated to determine their effects on forage and diet dynamics. These values of KM were assigned to each forage pool of live and dead forage for each species. Response variables evaluated were standing crop (sc) of live and dead leaf biomass, initially selected proportions of diet components, composition of diet actually selected, diet digestibility, A~C, and digestible nutrient intake per sheep (kg). Response surfaces were generated from output at 15-day intervals with time and stock density as the independent variables. The response surfaces were created by connecting the data poifits generated from the simulations, not by mathematical fitting. Separate response surfaces were generated for each plant growth treatment, KM value, and desirability function. Since the models are deterministic, output data were not evaluated statistically.
Simulation results Standing crop. Figure 3 presents the standing crop (sc) of live leaf for species one for all simulations using DESIND2. Stock density and growth rate were the dominant influences. At zero stock density, sc increased until about day 90 when growth and senescence reached equilibrium. After growth stopped on day 180, sc of live leaf declined to near zero by day 210. As stock density (SD) increased, sc of live leaf decreased, and there was very little accumulation of dead leaf, indicating that very little live leaf was senesced. There was an interaction of SD and KM. At so less than 12 hd h a - I and with one or two species, sc of live leaf was similar across riMS. However, as SD increased above 15 hd, sc was strongly influenced by KM. In these situations, sc increased as KM increased. Diet selection. The proportion of live leaf of species one selected on the first iteration of the model increased as the desirability function was modified to increase diet sensitivity to cP and DDM (Fig. 4). With low sensitivity (DESIND1), the initial diet contained only 74% live leaf compared to 96% with the high sensitivity function (DESIND2). Obviously, the model is very responsive to changes in this function, indicating its potential usefulness in simulating different sensitivity to diet quality by different herbi-
154
H.D. BL A CK BU RN A N D M.M. K O T H M A N N
I SPECIES, DESIRABILITY = 2
2 SPECIES, D E S I R A B I L I T Y = 2
Km=lO
,°°t
~ ~° i 6ot
Km=lO
~
//?y/-//-/J \
\
\
,, z°l . . ~ > L Z / / / / / A \ V \ / ~..
Krn=50
,ooi ~_ 6ot
Krn=50 ///yy-/-///\
\
Km=lO0
,oot ~ 6o ~ 4o 2O
, -- OlMtJL4T
210"~0£.,~,o&1~o~
,.~lll,,tOl.~- 210
~.£)C'¢'-.~1~o~
Fig. 3. Dynamicsof live leaf when growth is constant (Km is the rate of decline of forage harvestability as availability declines). vores. For example, small ruminants can be expected to graze more selectively than large ruminants; thus, the low sensitivity may be more appropriate for cattle and the high sensitivity more appropriate for small ruminants such as sheep, goats, and deer. Simulation of two plant species of comparable preference and palatability resulted in diet shifts to approximately equal amounts of both species in the diets when sc became large enough to allow unrestricted grazing. After growth stopped for both species, initial preference for live leaf differed between the two preference functions. The reduced proportion of live leaf requested with ozsiNo2 indicates that remaining live leaf of species 1 was of lower quality than had previously been encountered.
0.75
o~
°251
SIMj,, 210 ~l'4 ?ION
I
c.,.~OOY"~ i ~c,'~ "~ k'~
I0
// //------_
Km = I00
Km : I0
DESIRABILITY--
~'i
$~;00~ ,-,ok L'~
Km = I00
Km = 50
Km =I0
DESIRABILITY=2
S/MU, 210 ~.4 T/ON
I SPECIES,
15
2 SPECIES,
I
DESIRABILITY=I
X
2
~
SPECIES,
4.10 N
5 ,.,,
DESIRABILITY--
2
Fig. 4. Proportion of live leaf of species one initially requested by the program using one and two species with two desirability equations and three levels of Krn (Kin is the rate of decline of forage harvestability as availability declines).
15
~°251 ~
g
E
g
0.501
i::!i
_~ 0.75
I SPECIES,
82~
rll
C~
C
0.25' O,
.
210
kl~
~C~"
X///~
Km : I 0 0
Km = 5 0
1/ //t/~/1
~
"47101V ~\~
"~lNlo .
o
DESIRABILITY = I
MUL47"IoN
s'~O k~
Km = I 0 0
Km = 5 0
Km = I0
t~z4y O~ _
145 ~
. ~¢\,~
Km = I0
2 SPECIES, D E S I R A B I L I T Y = I
i• ~s6x
I SPECIES, D E S I R A B I L I T Y =2
D4y
Km = I00
Km = I0
2 SPECIES, D E S I R A B I L I T Y - - 2
Fig. 5. Comparison of proportions of live leaf of species one occurring in the simulated diet when desirability equations were changed for one or two plant species (Km is the rate of decline of forage harvestability as availability declines).
°~°t ~0.2
c~
i
_~o~o!
~o75!
2
-~ °~°1
0.75
~n
I SPECIES,
SIMULATINGDIETSELECTION
157
SPECIES I
SPECIES2 Kin=50
I
Km=5~
0.501 o
o
ooo~.~
wJ I00 0501
~
o 0.001
5 ~ ~
o
Kin=50
Km:50
/
°IMOL4 "1" 210 /0 N
/~>'/5 ~/~o
~
G~OC~x,xao' 6I
~
5
"/ON G"
kv
Fig. 6. Two-species simulation of dietary proportions of live and dead for the two species which had different periods of growth (Km is the rate of decline of forage harvestability as availability declines).
Actual proportions of live leaf in the diet are presented in Fig. 5. Proportions selected in early stages of simulation indicated no differences between desirability functions. These results differ from the initial proportions calculated in Fig. 4; the difference was due to low availability of dead material initially selected by equation one. This caused a shift in diet components selected resulting in very similar diets. With lower I~M, the response surfaces between the two desirability equations were different at points due to alterations of plant age and quality. Differences between other portions of the factorial were primarily observed as ram was altered. As KM decreased, less live leaf was available to be selected in the diet as a result of smaller accumulations of live leaf. To better illustrate how the model emulates the dynamics of diet selection, the proportions of all four simulated forage pools are presented in Fig. 6 for the two species, DESINO2 runs. The selection of live leaf of species one and two were nearly equal between days 30 and 150 while there was constant growth. After species one stopped growth, consumption of live leaf of species two increased as did dead leaf of both species. D e a d leaf increased because of the limited availability of live leaf. Live leaf of both
158
H.D. BLACKBURN
AND M.M. KOTHMANN
species was rapidly depleted under all stocking densities after growth stopped. From these results the dominant impact of leaf growth on diet selection is high-lighted, indicating the need for understanding both plant and animal components of the grazing system. Based on these results and to conserve space, only the results of simulations with desirability function t w o (DESIND2) are presented for the remaining variables.
Diet digestibility.
Diet digestibility remained relatively constant while forage was growing (Fig. 7). The additional growing period in the two species simulations provided a higher-quality diet for a longer period of time. As I SPECIES, D E S I R A B I L I T Y = 2
2 SPECIES, D E S I R A B I L I T Y =2
Km = I0
K m = I0
0.8 ~ 0.6 0.4 N0
Km = 50
Km = 50
Km = I00
Km = IO0
o-,1
N 06
~
o.4
b o.z ~
0
5 I
04), 0#80 ~
5
IM U.
. 210 t-4 TIOIv
,
~ S '~'" . c,~'- • iX,o'~ S ' 0 t'e,~'
Fig. 7. Simulated digestibility of diets across time as stock density and Km (the rate of decline of forage harvestability as availability declines) were altered.
159
SIMULATING DIET SELECTION
KM increased, the rate of decrease in digestibility for high SD was slowed due to a larger accumulation of sc. However, when ~w was large, digestibilities for all so were lower during the entire simulation. Before day 150 in the one species simulations, a slight quadratic response was observed for digestibility with highest levels observed for SDS of 15 and 12 for KMS of 10 and 50, respectively (Fig. 7). This response was mediated through high demand keeping live leaf age low resulting in higher quality, and the limits placed on harvestability by KM. High demand reduced leaf aging, thus reducing senescence. The responses to diet digestibility were amplified in the process of calculating digestible dry matter I SPECIES, DESIRABILITY = 2
2 SPECIES, DESIRABILITY = 2
Km= I0
,oo
Km= I0
°5°1 1 / ////// °251///~/A
0
.
0
0
~
'oot~ °5°1 0
Km = 5 0
Km=
50
--~ U\/X / .
0
0
~
Km =
I00
Km=lO0
,°°t ~°5°F - ~ 5 # A / Y o.oo~