6IEE, Steven age, England. [43]. Kim, Dong Jun & Chung, ... Preiss, K., Goldman, S. & Nagel, R., 1996, Co-operate to Compete. Van Nostrand Reinhold, New.
International Journal of Advances in Engineering & Technology, July, 2014. ©IJAET ISSN: 22311963
MODELLING LEAN, AGILE, LEAGILE MANUFACTURING STRATEGIES: AN FUZZY ANALYTICAL HIERARCHY PROCESS APPROACH FOR READY MADE WARE (CLOTHING) INDUSTRY IN MOSUL, IRAQ Thaeir Ahmed Saadoon Al Samman Department of Management Information System, MOSUL University, Iraq
ABSTRACT The aim of this research was to develop a methodology for test whether an existing strategies can perform as lean, agile, or leagile manufacturing strategies. The research the available factors and characteristics should be defines from the literature to build the model based on was sent to company to a quire their responses, the AHP was developed to aid decision maker or sort information based on a number of criteria . More after, questionnaires was built to distribute it to internal and external experts in clothing industry according to their qualifications. We identifying the manufacturing feature that where particularly by independent variable. By preparing based on the conditions and characteristics that improved solutions to manufacturing strategies in the clothing manufacturing company in Mosul and examines the three strategies of lean ,agile, leagile by considering certain features The paper provide evidence that the choice of manufacturing strategies should be based upon a careful analysis and characteristics The case study and empirical research reported in this paper are specific to the clothing manufacturing and fashion industries, ,and there would be benefit in extending the research into other sector given the increasing trend to the global sourcing and high level of price and high level competition in clothing manufacturing has market characteristic ,such as short product life cycle ,high volatility ,low predictability and high level of impulse purchase, highly diverse and heterogeneous making such issues as quick response of paramount importance whilst there is a growing recognition of the need to match the competitive advantage to the market ,there is still limited research into what criteria should be aid the choice of manufacturing strategies ,this paper attempt to extend our understanding of issues .
KEY WORDS: lean, agile, leagile, analytical hierarchy process, fuzzy logic
I.
INTRODUCTION
The changes occurring in the nature and level of international competition, many companies have been resorting to new ways of manufacturing. This phenomenon has been called as „new wave manufacturing strategies‟ [74]. During the development of these various strategies, many kinds were given to these strategies by the companies which started the development of these strategies and began implementing them. Some of these strategies were Lean Manufacturing, Agile manufacturing and leagile manufacturing [6].
1.1. Lean manufacturing conceptual ideology The term Lean was first used by Krafick[45] in 1988, a principle researcher in the International Motor Vehicle Program (IMVP) at Massachusetts Institute of Technology (MIT), to describe what today is known as the Lean Manufacturing or Lean Production paradigm [66]. A major output of the IMVP research efforts was the publication of the book, The Machine that Changed the World: The story of lean production [82]. The book chronicled the operations found in the automotive industry, capturing the dramatic differences in approach and ensuing performance found among the world's leading
1091
Vol. 7, Issue 3, pp. 1091-1108
International Journal of Advances in Engineering & Technology, July, 2014. ©IJAET ISSN: 22311963 automakers. In particular, the book examined how the techniques employed by Japanese automakers, namely Toyota, outpaced the performance achieved by U.S. and European competitors. Much has been written in the academic and popular business press about Toyota's much envied competitive weapon, the Toyota Production System (TPS)[27]. Every industrialized country has now fully recognized the importance and benefits of lean ideology [52]. Lean manufacturing (LM) is it uses half of everything human effort in the factory, manufacturing space, investment in tools, engineering hours to develop a new product [30] . It makes use of its tools to strive for zero inventories, zero downtimes, zero defects, and zero delays in the production process. The implementation of lean principles in any organization begins by identification of the value stream, Value is all the aspects of a product that a customer is willing to spend his/her money on it [27]. i.e., all those activities, required to manufacture a product(goods, services) to a customer. The numerous activities performed in any organization can be categorized into the following three types [19] (i) Value adding Activities (VAA)—which include all of the activities that the customer acknowledges as valuable. (ii) Non Value Adding Activities (NVAA–Type II Muda) -These include all the activities that the customer considers as non-valuable, either in a manufacturing system or in the service system. , Waste can be described as the opposite side of value on a Lean coin. These are pure wastes and involve unnecessary actions that should be eliminated completely. (iii) Necessary but Non Value Adding Activities (NNVAA - Type I Muda) These include the activities that are necessary under the current operating conditions but are considered as non-valuable by the customer[30]. Lean manufacturing focuses on elimination of waste (or "muda" in Japan) Taiichi Ohno believed that fundamental for any company's success was the elimination of waste. Ohno (1988) developed a list of seven basic forms of muda (i) Overproduction (production ahead of demand). (ii) Transportation (unnecessary transport of products). (iii) Waiting (waiting for the next production step). (iv) Inventory (all components, work-in-progress and finished product not being processed). (v) Motion (unnecessary movement of operator equipment). (vi) Over processing (unnecessary processing). (vii) Defects in production (the effort involved in inspecting for and fixing defects) (viii) Unused creativity[30] . Womack and Jones (1996) added to this list with the muda of goods and services that fail to meet the needs of customers. Lean protest the need for an organization to develop a culture of continuous improvement in quality, cost, delivery and design [6] Production is agile if it efficiently changes operating states in response to uncertain and changing demands placed upon it. Production is lean if it is accomplished with minimal waste due to unneeded operations, inefficient operations, or excessive buffering in operations. So it is concluded that while agility presumes leanness, leanness might not presume agility[30]. Lean production can be effectively utilized to remove wastes to improve business performance. Emphasis on the elimination of loss and the waste of resource factors is largely associated with lower inventory which is very clearly shown by analyzing the "rock and ship" analysis. In this analysis, as the stock (water level) is reduced, sources of waste (rocks) appear in the form of latency, poor quality conformity, prolonged preparations, unreliable processes etc. the removal of these losses is caused to lower inventory without a negative effect on the flow of materials (ships). [30][67]. Womack, Jones, and Roos add that in comparison to a mass production approach, a lean company calls for far less inventory and incurs fewer defects while providing greater variety in products [27][82[49].
1.2. Agile manufacturing conceptual ideology The term ‘agile manufacturing’ refers specifically to the operational aspects of a manufacturing company which accordingly, try to translate into the ability to produce customized products at mass production prices and with short lead times.[63,72].
1092
Vol. 7, Issue 3, pp. 1091-1108
International Journal of Advances in Engineering & Technology, July, 2014. ©IJAET ISSN: 22311963 There are a number of research reports available in the literature that discuss the concept of agile manufacturing [27],[19],[7][8],[22],[54], [83],[15], [66],[9],[27] Agile manufacturing is a new idiom that is used to represent the ability of a producer of goods and services to survive and flourish in the face of continuous change. These changes can occur in markets, technologies, business relationships and all other facets of the business enterprise [13]. Agile manufacturing can be defined as the capability of surviving and prospering in a competitive environment of continuous and random change by reacting quickly and effectively to changing markets, driven by customer-designed products and services. [42] According to Naylor et al. (1999), “agility means applying market knowledge and a vital corporation to exploit profitable opportunities in a rapidly changing market place”. The relation between agility and flexibility is extensively discussed in the literature [13]. It has been proposed that the origins of agility lie in flexible manufacturing systems [21] Agility can be obtained by systematically developing and gaining capabilities that can make the supply chain reflect rapidly and diversely to environmental and competitive changes [41]. Consequently, these firms need a number of distinguishing attributes to promptly deal with the changes inside their environment. Such attributes include four main elements [70]: responsiveness, competency, flexibility/adaptability and quickness/ speed. The base for agility is the amalgamation of information technologies, staff, business process organization, innovation and facilities into main competitive attributes. The main points of the definition of various authors may be summarized as follow: -High quality and highly customized products. - Products and services with high information and value-adding content. - Recruitment of core competencies. - Responsiveness to social and environmental issues. - Combination of diverse technologies. - Response to change and ambiguity demand. - Intra-enterprise and inter-enterprise integration [18][16]. The implementation of agile strategies has some benefits for firms, including quick and efficient reaction to changing market demands; the ability to customize products and services delivered to customers, the capability to manufacture and deliver new products in a cost-efficient mode [76], decreased producing costs, enhanced customer satisfaction, elimination of non-value-added activities and increased competitiveness. The most publications on agility strategies can classified into four categories: 1. Conceptual models and framework for achieving agility, this mainly includes, dimension [19] , enablers[23], aspects[85],theoretical model[70] . As well as methodology to support the implementation agility through identifying drivers and providers[87]. 2. Paths to agility , which considered the flexibility practices in terms of "volume flexibility ,modification flexibility and delivery flexibility " and responsiveness from three facets, volume , product, process are vital paths to agility.[69][35][55][81]. 3. Measuring and assessing the performance of agility these include the exploration of rules for assessment ,the identification of criteria and the establishment of agility index, which was proposed as a way of measuring the intensity level of agility attributes was developed.[85][46][84] 4. The development of agility in a supply chain context.[64][34][71][5][86] Therefore, agility has been advocated as the commerce paradigm of the century and in addition agility is considered the winning strategy for becoming a general leader in an increasingly competitive market of quickly changing customers’ requirements [1][38][17]. Agile manufacturing aims to meet the changing market requirements by suitable alliances based on core-competencies, by organizing to manage change and uncertainty, and by leveraging people and information. [22],[54]. agile manufacturing does not represent a series of techniques much as it represents a elementary change in management philosophy [48] It is not about small-scale improvements, but an completely different way of doing business [42] with a primary emphasis on flexibility and quick response to the changing markets and customer needs.
1093
Vol. 7, Issue 3, pp. 1091-1108
International Journal of Advances in Engineering & Technology, July, 2014. ©IJAET ISSN: 22311963 1.3. LEAGILE manufacturing conceptual ideology Agility in concept comprises; responding to change (predictable or unexpected) in the appropriate ways and due time, and exploiting and taking advantage of changes, as opportunities. Harrison and Van Hoek (2005)argue that “where demand is volatile, and customer requirements for variety is high, the elimination of waste becomes a lower priority than responding rapidly to the turbulent marketplace” A similar view is shared by Desai et al., [12]that the lean production philosophy with its current set of tools will not be able to tackle the increasing demand for customer specific products, favoring , organizations to move towards more agile production philosophies, considered to be better suitable to handle customer specific requirements with flexibility and responsiveness. According to Desai et al , Sharifi and Zhang, [63] [12] With increasingly customized products, the ‘mass markets’ will be split into multiple niche markets in which the most significant requirements will tend to move towards service level. [43]Recognized cost as the market winner for systems operating on the lean manufacturing philosophy. While Mason Jones et al. in Kim et al [13]identified service level as the market winner for agile manufacturing philosophies. In all cases named above costs, quality, and lead time are market qualifiers where they are not market winners. Rapid changes in the business environment and uncertainty have been part of management studies and research for a long time, so managing uncertainties still remains one of the most important tasks for organizations. Production is agile if it efficiently changes operating states in response to uncertain and changing demands placed upon it. Production is lean if it is accomplished with minimal waste due to unneeded operations, inefficient operations, or excessive buffering in operations. So it is concluded that while agility presumes leanness, leanness might not presume agility. Lean production is a broad concept and encompasses terms such as flexible manufacturing, mass customization and even agile manufacturing” When lean tools are effectively applied taking into consideration agility, one can increase flexibility by further introducing safety stocks, or operating with some free capacity This will ensure that the supply chain is robust to changes in end consumers requirements [57]. However, Naylor et al [57]warns that leanness and agility are mutually exclusive and cannot be simultaneously applied at the same point in a supply chain. While leanness operates best when planning horizons are long and products variants few, agility requires reactivity to customer orders in short uncertain planning horizons and highly customized product variants. This has resulted to the coining of a new production philosophy; leagile. [57]. According to Agarwal et al [1], leagility, is a philosophy best suited for an entire supply chain and not for a single point in the supply chain. Leagile blends the lean and agile. Christopher and Towill expanded the discussion in Naylor et al. (1999) and Mason-Jones et al. (2000a, 2000b). supported the concept of hybrid manufacturing strategies and identified three practical ways of combing the lean and agile paradigms: (Christopher, 2000; [10]. The first is via the Pareto curve approach; adopting lean for the 20% class high volume products having 80% of the demand and agile for the 80% having 20 % of the demand. The second is the use of a decoupling point or postponement principle. A de coupling point is a position in the supply chain where one production paradigm takes over from another [57][40][1]. Since the lean philosophy focuses on cost efficiency along the whole value chain its tools can because to run operations up to the decoupling point [31], [1]in a cost efficient way. While the agile production principles are applied on the other side of the decoupling point. But then, there are still some challenges like determining the position of a decoupling point such that the burden is rightfully divided across the participants in the supply chain. At the same time it is important to have the decoupling point closer to the customer so that lean practices can be applied to a greater portion of the value chain. Since its position depends on end user, lead time sensitivity, and further, on where the variability is greatest in the supply [57]. The third approach is to separating demand into base and surge demand, using lean for base demand and agile for surge demand .the term Agile or leagile should remind us that we must be responsive to change and uncertainties. We may need to come up with a number of other metrics required of our management systems and processes, all of which may exist within the companies already working at the level of best practice and based on the same basic good manufacturing practices, but the lean tools still remain the foundation[11]
1094
Vol. 7, Issue 3, pp. 1091-1108
International Journal of Advances in Engineering & Technology, July, 2014. ©IJAET ISSN: 22311963 These three strategies were complementary rather than mutually exclusive, and yet it was likely that each would work better than others in certain contexts. In addition to decoupling point identification, there are other approaches to achieve a leagile supply chain. One such method is transshipment, naturally led to coordinated replenishment policies across locations. Another approach was proposed by Stratton and Warburton (2003). They argued that leanness and agility were in practice caught in a trade-off conflict. However, if it were possible to define explicitly the trade-offs, then a solution to resolve this contradiction was possible. In this way, they interpreted the conflict nature in terms of dependency, fluctuation, inventory and capacity, and then systematically linked such trade-offs to develop another approach. This approach was combined with other approaches: the theory of inventive problem solving (TRIZ for short) and the theory of constraints (TOC for short). TRIZ of a number of principle-based solution systems was applied to solve the physical contradictions between leanness and agility while TOC was resolving trade-offs for highly complementing to TRIZ. However, although there may exist various ways to combine them, it is significantly important that lean production is a necessary but not a sufficient condition for achieving agility (Kidd, 1994; Robertson and Jones, 1999; Mason-Jones et al., 2000b;[10] Furthermore, agility cannot be achieved without experiencing relevant stages of leanness. MasonJones et.al., (2000a) presented two reasons for this fact. First, lean and agile supply chains share many common features that help speed up the achievement of leagility. Hence, agility may be initiated by building on the relevant features of leanness. Second, agility requires control of all processes in the supply chain. It is difficult, if not impossible, to see how agility can be acquired without having first gone through the process enhancement stage of lean production.[36].
1.4. Analytical hierarchy process ideology The Analytic Hierarchy Process method (AHP) was developed by Thomas Saaty in the beginning of 1870s and it represents a tool in the decision making analysis [12]. The author of AHP Thomas L. Saaty called a process, and not a method probably because of the process character of its elements [38]. Analytic Hierarchy Process (AHP) is originally introduced by Saaty in [4] as a excellent MCDM (multi criteria decision making) tool which tries to satisfy several conflicting criteria[59] The AHP technique can evaluate qualitative, quantitative and intuitive criteria comprehensively, and it is possible to raise the level of confidence of it through carrying out consistency testing. The AHP technique resembles the structure of human brain, and obtains quantitative results by transforming the comparative weight between elements to ratio scale. The AHP technique is based on three principles; hierarchical structuring, weighting, logical consistency.[43] Analytic hierarchy process (AHP) is a methodological approach which implies structuring criteria of multiple options into a system hierarchy, including relative values of all criteria, comparing alternatives for each particular criterion and defining average importance of alternatives.
1.5. FUZZY LOGIC conceptual ideology The philosophy of Fuzzy Logic (FL) may be traced back to the diagram of Taiji created by Chinese people before 4600 B.C. But the study of Fuzzy Logic Systems (FLS) began as early as the 1960s. In the 1970s, FL was combined with expert systems to become a FLS, which imprecise information mimics a human-like reasoning process. FLS make it possible to cope with uncertain and complex agile manufacturing systems that are difficult to model mathematically [23]. By opinion of [2], in managerial practice, there are often situations when it is not enough for managers to rely on their own instincts. With specific fuzzy programs it is even possible to choose suppliers, service providers or to buy necessary goods.
II.
RESEARCH METHODOLOGY
2.1. Modeling the Manufacturing Strategies Using AHP Since several strategies can structure a particular manufacturing system which in turn provides certain strategies (lean, agile, or leagile manufacturing), a value should be obtained based on measuring
1095
Vol. 7, Issue 3, pp. 1091-1108
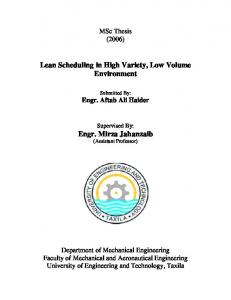
International Journal of Advances in Engineering & Technology, July, 2014. ©IJAET ISSN: 22311963 factors and characteristics factors for this particular manufacturing system in order to identify the strategies. Therefore for a proper decision to be made, these factors modeling using AHP as shown in figure (1) Manufacturing Capability
The Most appropriate Manufacturing System
Lead Time
Cost
Market Sensitiveness
Delivery Speed (DS) New Product Introduction (NPI) Customer Responsiveness (CR)
Lean Manufacturing
Quality
Flexibility
Information Technology (Information Driver)
Electronic Data Interchange (EDI) Mean of Information (MOI) Data Accuracy (DA) Data and Knowledge Bases (DKB)
Service
Productivity
Source Flexibility (SF) Manufacturing Flexibility (MF) Delivery Flexibility (DF)
Agile Manufacturing
Elimination of Waste
Overproduction (OP) Inventory Waiting (IT) Knowledge Misconection (KM)
LeAgile Manufacturing
Figure 1. A Propose Model
1096
Vol. 7, Issue 3, pp. 1091-1108
International Journal of Advances in Engineering & Technology, July, 2014. ©IJAET ISSN: 22311963 The main measuring factors for lean, agile and leagile strategies are depended on five measures (lead time, cost, quality, productivity, service level) and A characteristic can be defined as the feature of the property which is obtained by considering several parameters(Elimination Of waste(Overproduction , Inventory transportation waiting , Knowledge Misconnects) , Flexibility (Manufacturing flexibility, Delivery flexibility , Source flexibility), Information Technology(Electronic data interchange, Means of information and data accuracy , Data and knowledge bases ) Market Sensitivity(Delivery speed , New product introduction, Customer responsiveness). Hence the manufacturing system in a described state performs under closely specified conditions that produce a metric value. [41]
2.2.Data collection We was chosen General Company for Readymade Wear Manufacturing in Mosul, Iraq, a field of study, were selected by A committee composed of three directors of departments productivity in the General Company for the manufacture ready-made clothes in city Mosul in Iraq are the Director of the Section productive first (line productive - dishdasha) and Director of the Section productive second (line productive Aalghemsalh) and Director of the Section productive third line productive (Altruakh) "They evaluates certified manufacturing methods in the company through the scaling factors of (Lead time, Cost, Quality, Productivity, Service )Where the questionnaire was designs to seek expert opinion about the requires rating for implementing lean, agile and leagile manufacturing strategies in industries. The opinions provide the necessary data which are captured from internal and external experts according to their qualifications. For this purpose to indicate the relative importance of each criterion according to standard corresponding giving weight relative (1-9) was unloading The composed data is adjusted using Expert Choice software which is a multi-objective decision support tool based on the Analytic Hierarchy Process (AHP). and use CGI program ,the feedback data input of the five measuring factors that were filled out in the questionnaire is shown in table(1) Table(1):feedback data input of the five measuring factors metric Lead time cost Quality productivity Service level
Production line 1 5,7,9 3,5,7 1,3,5 5,7,9 3,5,7
Production line2 3,5,7 1,3,5 3,5,7 3,5,7 1,3,5
Production line3 5,7,9 3,5,7 1,3,5 5,7,9 3,5,7
mean .833 .633 .566 .633 .833
.633 .43 .366 .43 .633
.433 .233 .166 .233 .43
Then , the feedback data input of characteristics factors as shown in tab(2),(3),(4),(5),(6) which demonstrates the manufacturing performance for the( lead time, cost, quality ,productivity, service level) with respect to (lean, agile and leagile) manufacturing strategy. a consistency ratio was calculated by the software to check the applicability of the paired comparisons The value consistency ratio should be 10 percent or less. Therefore, all the consistency ratio of the below table is less than 10 %.
III.
ANALYSIS AND DISCUSSION
They assess the manufacturing methods adopted in the company through the measurement criteria of ( lead time, cost, quality, productivity, level service) according to the logic FUZZThe linguistic terms are used to assess the performance rating and importance weights of the integration values since it is difficult for experts to determine the score of vague values such as training level of personnel [80]. Most of the time linguistic scales include 2 scales [46]. The linguistic variables {Excellent [E], Very Good [VG], Good [G], Fair [F], Poor [P], Very Poor [VP], Worst [W]} were selected to assess the performance rating of the integration capability (these are the examined coefficients). Then the linguistic variables {Very High [VH], High [H], Fairly High [FH], Medium [M], Fairly Low [FL], Low [L], Very Low [VL]} were selected to assess the importance weights of the integration capabilities. Using the previous studies [80, 46], the table of fuzzy numbers for the linguistic variable values was created .
1097
Vol. 7, Issue 3, pp. 1091-1108
International Journal of Advances in Engineering & Technology, July, 2014. ©IJAET ISSN: 22311963 The results were obtained as shown in the table (1) which represents the input data feedback, it is worth noting here that he has been using the program ready minitab v23. For the year 2013 in getting the results of multiplying matrices while the program is used gci to get the values of functions belonging according to the logic FUZZY and calculate the eigine value, as well as index consistency, as shown in Tables (2), (3), (4), (5), (6), (7) 2.2.1. lead time Tab(2) demonstrates the characteristics factor for the measuring factor of lead time Tab.(2) Evaluation model to lead time Measuring factors
Lead time
Characteristics Factors Sub characteristics Elimination waste Over-production Inventory transportation waiting Knowledge Misconnects Flexibility Manufacturing flexibility, Delivery flexibility Source flexibility Information technology Electronic data interchange Means of information and data accuracy Data and knowledge bases Market sensitivity Delivery speed New product introduction Customer responsiveness
D1
D2
D3
LEAN
1,3,5 1,3,5
3,5,7 1,3,5
1,3,5 1,3,5
.566 .5
.366 .3
.166 .1
1,3,5,
3,5,7
5,7,9
.7
.5
.3
1,3,5
3,5,7
1,3,5
.566
.366
.166
1,3,5
1,3,5
3,5,7
.566
.366
.166
3,5,7
1,3,5
3,5,7
.633
.433
.433
5,7,9
3,5,7
5,7,9
.566
.633
.233
3,5,7
1,3,5
3,5,7
.633
.366
.166
1,3,5
3,5,7
1,3,5
.633
.366
.166
1,3,5 1,3,5
3,5,7 1,3,5
3,5,7 1,3,5
.633 .166
.166 .3
.233 .1
1,3,5
1,3,5
1,3,5
.5
.3
.1
2.33,4.33,6.33
2,4,6
AGILE
LEAGILE
1.58,3.41.5.25
2.2.2. COST Moreover, tab(3) demonstrates the characteristics factor for the measuring factor of cost Tab.(3) Evaluation model of the cost Measuring factors
cost
1098
Characteristics Factors Sub characteristics Elimination waste Over-production Inventory transportation
D1
D2
D3
LEAN
AGILE
LEAGILE
5,7,9 5,7,9
1,3,5 3,5,7
5,7,9 5,7,9
.766 .833
.566 .633
.366 .433
Vol. 7, Issue 3, pp. 1091-1108
International Journal of Advances in Engineering & Technology, July, 2014. ©IJAET ISSN: 22311963 waiting Knowledge Misconnects Flexibility Manufacturing flexibility, Delivery flexibility Source flexibility Information technology Electronic data interchange Means of information and data accuracy Data and knowledge bases Market sensitivity Delivery speed New product introduction Customer responsiveness
5,7,9
3,5,7
5,7,9
.833
.633
.566
5,7,9
3,5,7
3,5,7
.766
.566
.366
3,5,7
1,3,5
3,5,7
.633
.433
.233
3,5,7
1,3,5
1,3,5
.566
.366
.166
3,5,7
3,5,7
1,3,5
.566
.433
.233
3,5,7
1,3,5
3,5,7
.566
.433
.233
3,5,7
1,3,5
1,3,5
.566
.366
.166
3,5,7 5,7,9
1,3,5 3,5,7
1,3,5 3,5,7
.566 .766
.366 .566
.166 .366
3,5,7
1,3,5
1,3,5
.566
.366
.166
3.83,5.83,7.83
4.08,3.83,5.83
2.66,4.66,6.66
2.2.3. quality Furthermore, tab(4) shows the characteristics factor for the measuring factor of quality. Tab.(4) Evaluation model of the quality Measuring factors
Quality
1099
Characteristics Factors Sub characteristics Elimination waste Over-production Inventory transportation waiting Knowledge Misconnects Flexibility Manufacturing flexibility, Delivery flexibility Source flexibility Information technology Electronic data interchange Means of information and data accuracy Data and
D1
D2
D3
LEAN
AGILE
LEAGILE
3,5,7 1,3,5
1,3,5 1,3,5
3,5,7 1,3,5
.633 .5
.433 .3
.233 .1
3,5,7
3,5,7
1,3,5
.633
.433
.233
1,3,5
5,7,9
3,5,7
.7
.5
.3
3,5,7
5,7,9
1,3,5
.7
.5
.366
1,3,5
3,5,7
3,5,7
.633
.433
.3
3,5,7
5,7,9
3,5,7
.766
.566
.366
3,5,7
5,7,9
1,3,5
.7
.5
.3
1,3,5
1,3,5
5,7,9
.633
.433
.233
Vol. 7, Issue 3, pp. 1091-1108
International Journal of Advances in Engineering & Technology, July, 2014. ©IJAET ISSN: 22311963 knowledge bases Market sensitivity Delivery speed New product introduction Customer responsiveness
5,7,9 5,7,9
3,5,7 5,7,9
5,7,9 3,5,7
.833 .823
.633 .633
.433 .433
3,5,7
5,7,9
3,5,7
.766
.566
.366
2.66,4.66,6.66
3.5,5.5,7.5
2.66,4.66,6.66
2.2.4. Productivity In addition ,tab(5) demonstrates the characteristics factor for the measuring factor of productivity. Tab.(5) Evaluation model of the productivity Measuring factors
Productivity
Characteristics Factors Sub characteristics Elimination waste Over-production Inventory transportation waiting Knowledge Misconnects Flexibility Manufacturing flexibility, Delivery flexibility Source flexibility Information technology Electronic data interchange Means of information and data accuracy Data and knowledge bases Market sensitivity Delivery speed New product introduction Customer responsiveness
D1
D2
D3
LEAN
AGILE
LEAGILE
3,5,7 3,5,7
5,7,9 5,7,9
3,5,7 3,5,7
.766 .766
.566 .566
.366 .366
3,5,7
3,5,7
3,5,7
.7
.5
.3
1,3,5
5,7,9
5,7,9
.766
.566
.366
5,7,9
3,5,7
5,7,9
.833
.633
.433
3,5,7
5,7,9
3,5,7
.766
.566
.366
5,7,9
3,5,7
5,7,9
.833
.633
.433
3,5,7
5,7,9
3,5,7
.766
.566
.366
5,7,9
1,3,5
5,7,9
.766
.566
.366
3,5,7 5,7,9
5,7,9 3,5,7
3,5,7 3,5,7
.766 .266
.566 .566
.366 .366
1,3,5
1,3,5
3,5,7
.566
.366
.166
3.66,5.66,7.66
3.66,5.66,7.33
3.33,5.33,7.33
2.2.5. Service level In addition, tab(6) demonstrates the characteristics factor for the measuring factor of service level Tab.(6) Evaluation model of the service level Measuring factors
1100
Characteristics Factors Sub characteristics
D1
D2
D3
LEAN
AGILE
LEAGILE
Vol. 7, Issue 3, pp. 1091-1108
International Journal of Advances in Engineering & Technology, July, 2014. ©IJAET ISSN: 22311963 Service level
Elimination waste Over-production Inventory transportation waiting Knowledge Misconnects Flexibility Manufacturing flexibility, Delivery flexibility Source flexibility Information technology Electronic data interchange Means of information and data accuracy Data and knowledge bases Market sensitivity Delivery speed New product introduction Customer responsiveness
1,3,5 1,3,5
3,5,7 1,3,5
1,3,5 3,5,7
.566 .566
.366 .366
.166 .166
3,5,7
5,7,9
3,5,7
.766
.566
.366
5,7,9
5,7,9
3,5,7
.833
.633
.433
3,5,7
1,3,5
3,5,7
.633
.433
.233
3,5,7
1,3,5
3,5,7
.633
.433
.233
5,7,9
3,5,7
5,7,9
.833
.633
.433
5,7,9
5,7,9
3,5,7
.766
.633
.433
1,3,5
1,3,5
3,5,7
.566
.366
.166
3,5,7 5,7,9
1,3,5 3,5,7
3,5,7 1,3,5
.633 .7
.433 .5
.233 .3
1,3,5
3,5,7
1,3,5
.566
.366
.166
2.66,4.66,6.66
2.66,4.66,6.66
3,5,7
After entering the input ,the data output of the minitab program is shown in table(7) normalization all the above means of characteristics factors by dividing by 10.(saaty,t.l.,1980) After data processing methods adopted in the analytical hierarchy analysis, the outputs appear in the table (7) where the data is converted to a standard format as shown in the table(7). Tab(7)normalized of the measure factors means of the three decision maker
Service level .366 .566 .766 .366 .566 .733 .333 .533 .733
productivity .266 .466 .666 .35 .55 .75 .266 .466 .666
Cost .233 .433 .633 .200 .4 .6 .158 .341 .525
1101
quality .266 .466 .666 .2 .4 .6 .158 .341 .525
lead time .266 .266 .383
.466 .666 .466 .666 . 583 .783
Vol. 7, Issue 3, pp. 1091-1108
International Journal of Advances in Engineering & Technology, July, 2014. ©IJAET ISSN: 22311963 The proportion of consistency 10% between the vertebrae variables was found accurate comparisons of marital and described in tables (8) (9) (10) Matrix comparisons that show the importance of marital reliability of lean, agile, leagile manufacturing between each of the criteria. Tab (8) Pairwise Comparison Matrix which appear lean manufacturing between index factor
Lead time
Lead time 1
cost
quality
productivity
Service level
0.142857
0.25
0.2
3
Cost
7
1
1
9
7
4
1
1
3
5
0.111111
0.333333
1
5
0.2
1
Quality
Productivity 5
Service level 0.333333 0.142857
0.2
Tab (9)Pairwise Comparison Matrix which appear agile manufacturing between index factor Lead time
Cost
Quality Productivity Service level
Lead time
1
9
9
7
7
Cost
0.111111 1
7
5
3
Quality
0.111111 0.142857 1
5
5
0.2
1
0.142857
0.142857 0.333333 0.2
7
1
Productivity 0.142857 0.2 Service level
Tab (10) Pairwise Comparison Matrix which appear reliability for leagile manufacturing between index factor Lead time Lead time Cost Quality
Cost
Quality
productivity Servic e level
1
5
7
5
3
0.2
1
9
7
5
0.142857
0.111111
1
5
7
0.2
0.142857
0.2
1
0.142857
0.333333
0.2
0.142857
7
1
Productivity
Service level
1102
Vol. 7, Issue 3, pp. 1091-1108
International Journal of Advances in Engineering & Technology, July, 2014. ©IJAET ISSN: 22311963 Then, we calculate standard pair wise comparison matrix for lean, agile, leagile manufacturing, which appear in tables (11),(12),(13) Tab(11) Synthesized matrix for lean manufacturing Lead time .o57 .403 .230 .288 .019
Lead time Cost Quality productivity Service level
Cost
Quality
Productivity
0.058 .418 .418 .046 .058
.089 .359 .359 .118 .071
.014 .671 .223 .074 .014
Service level .142 .333 .238 .238 .047
Priority weight Eigen value .072 .436 .293 .152 0.041
The principal eigenvector is necessary for representing the priorities associated with that matrix, providing that the inconsistency is less than or equal to a desired value [62].The value which appear in the last Colum represent relative weight to lean manufacturing to each criteria's (lead time ,cost ,quality, productivity, service level),now estimating the consistency ratio, is as follow: Tab(12)Synthesized matrix for agile manufacturing
Lead time Cost Quality productivity Service level
Lead time
Cost
Quality
Productivity
Service level
.666 .073 .073 .093 .093
0.843 .093 .013 .018 .030
.517 .402 .057 .011 .011
.28 .2 .28 .04 .28
.433 .185 .309 .008 .061
Priority weight Eigen value .547 .190 .146 .034 0.095
Tab(13) Synthesized matrix for leagile manufacturing Lead time .534 .106 .074 .106 .176
Lead time Cost Quality productivity Service level
Cost
Quality
Productivity
0.775 .155 .017 .021 .031
.403 .519 .057 .011 .008
.2 .28 .2 .04 .028
Service level .185 .309 .433 .008 .061
Priority weight Eigen value .419 .273 .156 .037 0.111
The result in the tab(14 ) summarize the relative weights of different types of manufacturing strategies according to each criterion factor measurements (lead time, cost, quality, productivity, service), according to lean , agile, leagile manufacturing strategies. Tab (14) Relative weight of different type of manufacturing strategies Measurement factor Lead time Cost Quality Productivity Service level sum Mean
Lean .072 .436 .293 .152 .041 .994 .1988
Agile .547 .190 .146 .034 .095 1.012 .2024
Leagile .419 .273 .156 .037 .111 .996 .1992
The normalized means of Tab (7) is multiplied by the means of feedback data input of the five measuring factor Tab(1) to obtain the following: the result of multiplication is tab(15)
1103
Vol. 7, Issue 3, pp. 1091-1108
International Journal of Advances in Engineering & Technology, July, 2014. ©IJAET ISSN: 22311963 Tab(15) Result of multiplication Tab(1) and Tab(1)
lean agile leagile
2.539 1.786 1.156 .376 .593 2.492 1.753 1.135 .369 .582 2.391 1.682 1.089 .354 .558
average 1.284 1.266 1.210
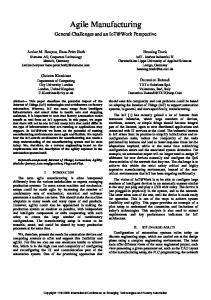
then applying the equation : 1.253−0.18 𝛂= = 0.321 3.52−0.18
Where 1.253 is the result of multiplication and .18 ,3.52are constant . The resulting (.321) is multiplied by the certainty constant(.70) to get (.224) Fig (2) is consulted to conclude that readymade ware in Mosul is below (.2-.10) which represents the lean and bellow (.2924-.1124) agile and bellow(.293-.109) leagile baseline the readymade ware in Mosul is traditional manufacturing. In order to facilitate its evolution to lean manufacturing a should implement the following tools (cellular manufacturing, TQM, value stream mapping ,5s, kaizen )
1
.818
1.818
3.106 α- cut
7.332
2.67 4.159 Triangular fuzzy number Fig(2) fuzzy number to conclude manufacturing strategy The results above summarizes measurements factors (lead time, cost, quality, productivity, service level) in addition to convert all values to the standard according to expert opinion .for the experts opinion appear in the tab (16). Tab (16) mean fuzzy number of opinions experts Expert opinion Total mean
Lean .2888-.1088
agile .1124-.2924
leagile .1092-.293
traditional 0
we can calculate the consistency ratio which may be less 10% for comparison the fuzzy expert opinion number the tab(16)appear the mean fuzzy number of the opinion experts
IV.
CONCLUSIONS 1- Enhanced manufacturing strategy performance implies that a manufacturing is quickly responding to the market volatile the customer demand with effective cost reduction.
1104
Vol. 7, Issue 3, pp. 1091-1108
International Journal of Advances in Engineering & Technology, July, 2014. ©IJAET ISSN: 22311963
2-
3-
45-
6-
Leanness in a manufacturing maximizes profits through cost reduction while agility maximizes profit through providing exactly what the customer requires. The leagile strategy enables the upstream part of the chain to be cost-effective and the downstream part to achieve high service levels in a volatile marketplace. The AHP methodology adopted here arrives at a synthetic score, which may be quite useful for the decision-makers. The purpose of the present work is to analyze the relative impact of different enablers on three strategic paradigms considered for manufacturing. It integrates various criteria, enablers and alternatives in decision model. The approach also captures their relationships and interdependencies across and along the hierarchies. It is effective as both quantitative and qualitative characteristics can be considered simultaneously without sacrificing their relationships. The manufacturing system strategy of readymade ware company is traditional manufacturing. To resolve the manufacturing system in order to become lean, agile or leagile; a lot of tools will help in becoming lean like Cellular Manufacturing, Total Quality Management ,Poka yoke, Kaizen , Value Stream Mapping, 5 S, increase its focus on customer service and improve the quality of its. Also, some tools will help in becoming agile like Customer Value Focus, IT. The paper provide evidence that the choice of manufacturing strategies should be based upon a careful analysis and characteristics.
REFERENCES [1]. Agarwal, A., Shankar, R. & Tiwari, M. K., 2006, Modeling the metrics of lean, agile and leagile supply chain: An ANP-based approach. European Journal of Operational Research, 173, pp. 211-225. [2]. Agbor, Tanyi Emmanuel, 2008, An evaluation of production operations at Supply Chain Based on Lean Concept, A thesis Report submitted to Department of Production Engineering and Management, partially fulfilling the requirements for the award of the degree of Master of Sciences in Production Engineering and Management, Royal Institute at Technology Stockholm, Sweden. [3]. Association for Manufacturing Excellence, 1994, Forward to the Future: The Transition to Agile, Quick Response Manufacturing Textile/Clothing Technology Corporation [TC]2 shows how to step sprightly, IJ Textile/Clothing Technology Corporation_ National Apparel Technology Center, Target Vol. 10, Number 4, Illinois, pp. 41-44. [4]. Baker, J., 1996, Less lean but considerably more agile. Special section mastering management. Financial Times, 10 May, Systems 2, pp. 83–86. [5]. Baramichai, M., Zimmer's, E. W. & Marangos, C. A., 2007, Agile supply chain transformation matrix: an integrated tool for creating an agile enterprise, Supply Chain Management-an International Journal, 12, pp. 334-348. [6]. Bhasin ,S. and P. Burcher, 2006, Lean Viewed as a Philosophy, Journal of Manufacturing Technology Management, 17 (1), pp. 56-72. [7]. Booth, R., 1996, Agile manufacturing, Engineering Management Journal, 6 (2), pp. 105-112. [8]. Bunce, P. & Gould, P., 1996, From lean to agile manufacturing, IEE Colloquium (Digest), No. 278, pp. 3/1-3/5. [9]. Cho, H., Jung, M. & Kim, M., 1996, Enabling technologies of agile manufacturing and its related activities in Korea, Computers & Industrial Engineering, 30 (3), pp. 323-334. [10]. Christopher, M. & Towill, D. R., 2001, An integrated model for the design of agile supply chains, An International Journal of physical distribution and logistics management, 31(4), pp. 235 – 246. [11]. Dean, Steven P., &Henderson, Ian, 2003, Lean ,Agile and Simple . iomnet.org.uk. [12]. daiDes. S., Irani, Z. & Sharp, J. M., 1999, Working Towards agile manufacturing in the UK Industry, International Journal of production and economics,62,155-169. [13]. Devor, R., Graves, R.& Mills, J. J., 1997,Agile Manufacturing Research: accomplishments and opportunities. IIE Transactions, 29 (10), pp. 813-823. [14]. Esmail, K. & Saggu, J. A., 1996, Changing paradigm, Manufacturing Engineer December, pp. 285– 288. [15]. Forsythe, C., Ashby, M. R., 1996, Human factors in agile manufacturing, Ergonomics in Design 4 (1), pp. 15–21.
1105
Vol. 7, Issue 3, pp. 1091-1108
International Journal of Advances in Engineering & Technology, July, 2014. ©IJAET ISSN: 22311963 [16]. Gharakhani, Davood. Maghferati, Amid Pourghafar. Farahmandian, Arshad and Nasiri, Rasol.( 2013) Agile manufacturing, Lean production, Just in Time systems and products quality improvement, Life Science Journal;10(3s) . http://www.lifesciencesite.com [17]. Ghatari,Ali,Rajabzadeh,GholamhosseinMehralian&ForouzandehZarenezhad, 2012, Developing a model for Agile Pharmaceutical manufacturing: Evidence from Iran, Australian Journal of Basic and Applied Sciences, 6(9), pp. 753-762. [18]. Goldman, S.L. Nagel, R.N. (1993) Management, technology and agility: The emergence of a new era in manufacturing, International Journal of Technology Management 8 (1/2) 18-38. [19]. Goldman, S. L., Nage R. N. &Preiss K., 1995, Agile Competitors and Virtual Organizations: Strategies for Enriching the Customer, Van Nostrand Reinhold Company, New York. [20]. Goldshy, Thomas J., Stanley E. Griffiths & Adthony, S. Roath, 2006, Modeling Lean, Agile, and Leagile supply chain strategy, Business Logics, Vol. 27, No. 1, pp. 57-80. [21]. Gosling, J., Purvis, L., & Naim, M., 2010, Supply chain flexibility as a determinant of supplier selection, International Journal of Production Economics, pp. 11-21. [22]. Gould, P., 1997, What is agility, Manufacturing Engineer 76 (1), pp. 28–31. [23]. Gunasekaran, A., 1998, Agile manufacturing: Enablers and an implementation framework, International Journal of Production Research, 36 (5), pp. 1223-1247. [24]. Gunasekaran, A., 1999a, Agile manufacturing: A framework for research and development, International Journal of Production Economics, 62 (1-2), pp. 87-105. [25]. Gunasekaran, A., 1999b, Design and implementation of agile manufacturing systems, International Journal of Production Economics, 62 (1-2), pp. 1-6. [26]. Gunasekaran, A., 2001, Agile manufacturing: The 21 st Century Competitive Strategy, Elsevier Science Ltd, Oxford, U.K. [27]. Gunasekaran, A., Tirtiroglu, E. &Wolstencroft, V.,2002, An investigation into the application of agile manufacturing in an aerospace company, Technovation, 22 (7), pp. 405-415. [28]. Gunasekaran, A., Yusuf, Y. Y., 2002, Agile manufacturing: A taxonomy of strategic and technological imperatives, International Journal of Production Research, 40 (6), pp. 1357-1385. [29]. Gunasekaran, A., K., Lai & T. C. E., Cheng, 2008, Responsive supply chain: A competitive strategy in networked company, Omega, 36(4): pp. 549. [30]. Gupta, Anil, & Kundra, T. K., 2012, A review of designing machine tool for leanness, Sadhana, Vol. 37, Part 2, April, Indian Academy of Sciences, pp. 241–259. [31]. Harrison, A. & Van Hoek, R., 2005, Logistics Management and strategy, London, Prentice Hall. [32]. Hillman-Willis, T., 1998, Operational competitive requirements for the 21 st century, Industrial Management & Data. [33]. Hitomi, K., 1997, Manufacturing strategy for future production moving toward manufacturing excellence, International Journal of Technology Management 14 (6–8), pp. 701–711. [34]. Hoek, R. I., Harrison, A. & Christopher, M., 2001, Measuring agile capabilities in the supply chain, International Journal of Operations & Production Management, 21, pp. 126-147. [35]. Holweg, M., 2005, The three dimensions of responsiveness, International Journal Operations & Production Management, 25, pp. 603-622. [36]. Huang, Yu-Ying &Shyh-Jane Lib, 2009, Tracking the Evolution of Research Issues on Agility, Asia Pacific Management Review 14(1), pp. 107-129. [37]. Ishizaka, Alessio & Labib Asharaf, 2011, Review of the main developments in the analytic hierarchy process, Expert Systems with Applications, 38 (11), pp. 14336-14345. [38]. Ismail, H., I. Raid, J. Mooney, J. Pool ton & I. Arokiam, 2007, How small and medium enterprises effectively participate in the mass customization game, IEEE transactions on engineering management, 54 (1), pp. 86-97. [39]. Jones, D. T., 2003, The Beginner's Guide to Lean, Chairman Newsletter – Lean Enterprise Academe, November. [40]. Kay, J., M & Prince J., 2003, Combining lean and agile characteristics: Creation of virtual groups by enhanced production flow analysis, International Journal of production economics 85, pp. 305-318. [41]. Khan, Arif, K., Bakkappa, B., Bhimaraya, A.M., and Sahay, B.S. , 2009 .Impact of agile supply chains’ delivery practices on firms’ performance: cluster analysis and validation. Supply Chain Management: An International Journal, 14(1): 41-48 [42]. Kidd, P. T., 1996, Agile manufacturing: a strategy for the 21 st century, IEE Colloquium (Digest) 74, 6IEE, Steven age, England. [43]. Kim, Dong Jun & Chung, Sung Bong, 2005, Development of an assessment model using AHP technique for rail road projects experience service conflicts in Korea, Proceedings of the Eastern Asia Society for Transportation Studies, Vol. 5, pp. 2260 – 2274.
1106
Vol. 7, Issue 3, pp. 1091-1108
International Journal of Advances in Engineering & Technology, July, 2014. ©IJAET ISSN: 22311963 [44]. Kim, S. W., Narasimhan, R. &Swink, M., 2006, Disentangling Leaness and agility: An empirical investigation. Journal of operations management, 24, pp. 440-457. [45]. Krafcik, J., Triumph of the Lean Production System”. Sloan Management Review, 30(1), pp. 41–52. [46]. Lin, C. T., Chiu, H. &Chu, P. Y., 2006, Agility index in the supply chain. International Journal of Production Economics, 100, pp. 285-299. [47]. Maskell, B. H., 1994, Software and the Agile Manufacturer: Computer Systems and World Class Manufacturing, Oregon Productivity Press, Portland. [48]. Maskell, B. H.,1991, Performance Measurement for World Class Manufacturing, Productivity Press, Cambridge, MA. [49]. Mason-Jones, R., Naylor, B. &Towill, D. R., 2000. Lean, agile or leagile? Matching your supply chain to the marketplace, International Journal of Production Research, 38, pp. 4061-4070. [50]. Masoud, 2007, Decision Support System for Lean, Agile and Leagile Manufacturing, Master of Science in the Industrial Engineering Department with the College of Engineering, King Saud University, p. 27-30. [51]. Meier, R. L. & Walker, H. F., 1994, Agile manufacturing, Journal of Industrial Technology, 10 (4), pp. 41–43. [52]. Meyer A. De & Wittenberg-Cox A., 1992, Creating product value: Putting manufacturing on the strategic agenda, London: Pitman. [53]. Monden, Y., 1998, Toyota production system: An integrated approach to just-in-time, 3rd ed., Norcross, Georgia: Engineering and Management Press. [54]. Moore, James S. M. R., 1996, Agility is easy, but effective agile manufacturing is not, IEE Colloquium (Digest), No. 179, 4. [55]. Narasimhan, R. & Das, A., 1999, Manufacturing agility and supply chain management practices, Production and Inventory Management Journal, No. 40, pp. 4-10. [56]. Narasimhan, R. & Das, A., 2000, An empirical examination of sourcing's role in developing manufacturing flexibilities, Intl Journal of Prod Research, 38, pp. 875-893. [57]. Naylor, J. B., M. M. Naim& D. Berry, 1999, Leagility: integrating the lean and agile manufacturing, International Journal of Production Economics, 62, pp. 155-169. [58]. Papadopoulou, T. C. & M. Özbayrak, 2005, Leanness: Experiences from the Journey to Date, Journal of Manufacturing Technology Management, 16 (7). [59]. Pogarcic, Ivan, Francic, Miro, &Davidovic, Vlatka, 2008, Application of AHP method in traffic planning, ISEP, Croatia. [60]. Preiss, K., Goldman, S. & Nagel, R., 1996, Co-operate to Compete. Van Nostrand Reinhold, New York. [61]. ŘEZÁČ, J., 2006, Modern management, Computer Press, Brno: 2009. 397. [62]. Saaty, T. L., L. Vargas, 1984, Inconsistency and rank preservation, Journal of Mathematical Psychology 28 (2). [63]. Schonberger, R. J., 1982, Japanese Manufacturing Techniques: Nine Hidden Lessons in Simplicity, Free Press, New York. [64]. Schonsleben, P., 2000, With agility and adequate partnership strategies towards effective logistics networks, Computers in Industry, 42, pp. 33-42. [65]. Sen, Rahul, Kumar, Saurabh& S., Chandrawat, 2011, The total supply chain: Transportation System in mine planning, Faculty of mining and geology, International journal of production economics,62, pp. 107-118. [66]. Sen, Rahul, Kumar, & Saurabh S. Chandrawat R. , 2012, The Framework for Manufacturing Methods and Techniques, International Journal of Engineering Research and Applications (IJERA), www.ijera.com Vol. 2, Issue 6, November- December, pp.697-702. [67]. Seyedi, Seyed Nima, 2012, Supply Chain Management, Lean Manufacturing, Agile Production, and their Combination, International Journal of Contemporary Research in business, Institute of Interdisciplinary Business Research, Vol. 4, No. 8, ijcrb.webs.com, pp. 648-653. [68]. Sharifi, H. & Zhang Z., 1999, A methodology for achieving agility in manufacturing organizations, An introduction International Journal of production economics, No. 62, pp. 7-22. [69]. Sharifi, H. & Zhang, Z., 2001, Agile manufacturing in practice - Application of a methodology, International Journal of Operations & Prod Management, No. 21, pp. 772-794. [70]. Sharp, J. M., Irani, Z. & Desai, S., 1999, Working towards agile manufacturing in the UK industry, International Journal of Production Economics, No. 62, pp. 155-169. [71]. Shaw, N. E., Burgess, T. F., De Mattos, C. &Stec, L. Z., 2005, Supply chain agility: the influence of industry culture on asset capabilities within capital intensive industries, International Journal of Production Research, No. 43, pp. 3497-3516. [72]. Slack, N., 1991, The Manufacturing Advantage, Mercury Books, London.
1107
Vol. 7, Issue 3, pp. 1091-1108
International Journal of Advances in Engineering & Technology, July, 2014. ©IJAET ISSN: 22311963 [73]. Slack, N., Chambers, S., Harland, C., Harrison, A. & Johnston, R., 1995, Operations Management, Pitman, London, England. [74]. Story, John, 1994,Flexible manufacturing systems, New wave manufacturing strategies, Paul chapman publishing Ltd., London. [75]. Swafford, P. M., Ghosh, S. & Murthy, N., 2006, The antecedents of supply chain agility of a firm: scale development and model testing, Journal of Operations Management, Vol. 24, pp. 170-188. [76]. Swafford, P. M., S., Ghosh & N., N. Murthy, 2006, A framework for assessing value chain agility, International Journal of Operations and Production Management, Vol. 26, No. 2, pp. 118140. [77]. Swafford, P. M., S., Ghosh & N., N. Murthy, 2008, Achieving supply chain agility through IT integration and flexibility, International Journal of Production. [78]. Swafford, P., 2003, Theoretical development and empirical investigation of supply chain agility, Ph. D. thesis, The Georgia Institute of Technology, Georgia, U.S.A. [79]. Syamsuddin, Irfan&Junseok, Hwang, 2009, The Application of AHP Model to Guide Decision Makers: A Case Study of E-Banking Security, Fourth International Conference on Computer Sciences and Convergence Information Technology. [80]. Ustyugova, Tatiana, Darja Noskievicova, CSc., 2013, fuzzy logic model for evaluation of lean and agile manufacturing integration, 15. - 17. 5., Brno, Czech Republic, EU. [81]. Van Hoek, R. I., Harrison, A. & Christopher, M., 2001, Measuring agile capabilities in the supply chain, International Journal of Operations & Production Management, No. 21, pp. 126-147. [82]. Womack, J. P., D. T. Jones & D. Roos, 1990, The Machine that Changed the World: The Story of Lean Production, Rawson Associates, New York, NY. [83]. Womack, J. P., Jones, D. T., 1996, Lean Thinking: Banish Waste and Create Wealth in Your Corporation, Simon and Schuster, New York. [84]. Yusuf, Y. Y., Gunasekaran, A., Adeleye, E. O. & Sivayoganathan, K., 2004, Agile supply chain capabilities: determinants of competitive objectives, European Journal of Operational Research, No. 159, pp. 379-392. [85]. Yusuf, Y. Y., Sarhadi, M. & Gunasekaran, A., 1999, Agile manufacturing: The drivers, concepts and attributes, International Journal of Production Economics, No. 62, pp. 33-43. [86]. Zhang, David Z. & Wang, Rundong , A Taxonomical Study of Agility Strategies and Supply Chain Management, www.google.com. [87]. Zhang, Z. & Sharifi, H., 2000, A methodology for achieving agility in manufacturing organizations, International Journal of Operations & Prod Management, No. 20, pp. 496-512. [88]. Zhang, D. Z. W. & Sharifi, H., 2007, Towards theory building in agile manufacturing strategy - A taxonomical approach, IEEE Trans on Engineering Management, 54, pp. 351-370.
AUTHOR THAEIR AHMED SAADOON AL SAMMAN was born in MOSUL, IRAQ in 1963. He received the Bachelor in 1984 degree from the university of MOSUL, IRAQ and the master in year 1987 degree from the university of MOSUL, IRAQ both in business management and the Ph.D. in year 2008 degree from the university of MOSUL,IRAQ .He is currently Ass. Prof. in management information system in the college of Business administration in university of MOSUL. His research interests include operation management and operations research.
.
1108
Vol. 7, Issue 3, pp. 1091-1108