The PTV2 involved a part of UBS in. 2 cases (patients 6 and 8; see Fig. 1). Treatment planning. The dose calculation was based on 3D options by the. Voxelplan ...
ORIGINAL ARTICLE
Modelling Normal Tissue Isoeffect Distribution in Conformal Radiotherapy of Glioblastoma Provides an Alternative Dose Escalation Pattern through Hypofractionation without Reducing the Total Dose La´szlo´ Mangel, Zolta´n Skriba, Tibor Major, Csaba Polga´r, Ja´nos Fodor, Andra´s Somogyi and Gyo¨rgy Ne´meth
Acta Oncol Downloaded from informahealthcare.com by 218.28.121.22 on 05/20/14 For personal use only.
From the National Institute of Oncology, Department of Radiotherapy, Budapest, Hungary Correspondence to: La´szlo´ Csaba Mangel, National Institute of Oncology, Department of Radiotherapy, Ra´th. Gy. u. 7– 9, HU-1122, Budapest, Hungary. Tel: »36 1 2248 600. Fax: »36 1 2248 620
Acta Oncologica Vol. 41, No. 2, pp. 162 – 168, 2002 The purpose of this study was to prove that by using conformal external beam radiotherapy (RT) normal brain structures can be protected even when applying an alternative approach of biological dose escalation: hypofractionation (HOF) without total dose reduction (TDR). Traditional 2-dimensional (2D) and conformal 3-dimensional (3D) treatment plans were prepared for 10 gliomas representing the subanatomical sites of the supratentorial brain. Isoeffect distributions were generated by the biologically effective dose (BED) formula to analyse the effect of conventionally fractionated (CF) and HOF schedules on both the spatial biological dose distribution and biological dose-volume histograms. A comparison was made between 2D-CF (2.0 Gy:day) and 3D-HOF (2.5 Gy:day) regimens, applying the same 60 Gy total doses. Integral biologically effective dose (IBED) and volumes received biologically equivalent to a dose of 54 Gy or more (V-BED54) were calculated for the lower and upper brain stem as organs of risk. The IBED values were lower with the 3D-HOF than with the 2D-CF schedule in each tumour location, means 22.7 9 17.1 and 40.4 9 16.9 in Gy, respectively (p B 0.0001). The V-BED54 values were also smaller or equal in 90% of the cases favouring the 3D-HOF scheme. The means were 2.7 94.8 ccm for 3D-HOF and 10.7 9 12.7 ccm for 2D-CF (p ¾0.0006). Our results suggest that with conformal RT, fraction size can gradually be increased. HOF radiotherapy regimens without TDR shorten the treatment time and seem to be an alternative way of dose escalation in the treatment of glioblastoma. Received 29 June 2001 Accepted 17 December 2001
External beam radiotherapy (RT) is considered to be the routine treatment for malignant gliomas, but the results with this method are disappointing (1, 2). Efforts have been made to escalate dose in order to improve local control (3, 4). Image-based 3-dimensional (3D) conformal RT ensures a signi cant reduction in treated volume in order to spare the surrounding normal tissues (5, 6). Patients with brain tumours are ideal candidates for 3D focal RT, because the skull can be immobilized and non-coplanar beams can be used (7, 8). Moreover, using the shrinking eld technique, the dose gradient can be further increased between neoplastic-potentially in ltrated and normal tissues (9). Since focal RT techniques can allow a higher optimum dose per fraction while preserving a given normal tissue isoeffect (10– 12), our assumption was that by using 3D conformal techniques, an acceptable protection of the organs at risk can be achieved even in a hypofractionated (HOF) regimen, with a gradual increase of single doses and without the © Taylor & Francis 2002. ISSN 0284-186 X
necessity of reducing the total dose. Therefore this technique and the fractionation schedule were compared with traditional 2-dimensional (2D) treatment planning based conventionally fractionated (CF) RT of a 60 Gy total dose. Radiobiological modelling can be suitable for estimating the effect of altered fractionation schedules on normal tissue complication probabilities and an isoeffect distribution model can be applicable for judging the spatial effect of different fractionation regimens (13– 16). As representative organs of risk, the midline structures are considered to be more sensitive to radiation than other parts of the normal brain (5, 17, 18). In the majority of cases, focal radionecrosis in the supratentorial lobar brain can be treated by salvage neurosurgery, but those in the midline structures cannot be treated in this way (1, 19). Therefore, in this study we examined the biologically effective dose to the midline structures with CF and HOF radiotherapy regimens. Acta Oncologica
Acta Oncologica 41 (2002)
MATERIAL AND METHODS
Acta Oncol Downloaded from informahealthcare.com by 218.28.121.22 on 05/20/14 For personal use only.
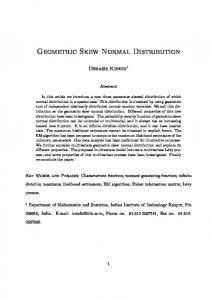
Target volumes and critical structures CT images of 10 glioma patients were used for the investigation. The locations of the tumours represent the subanatomical sites of the supratentorial brain (Fig. 1). Five of the tumours originated in the parafalxial regions (parafalxial location) from the frontal to the occipital poles. The other ve tumours at least partially in ltrated the temporal lobe (temporal location), whose location generally possesses dif culty in the traditional RT planning (1). The primary planning target volume (PTV1) was de ned as gross tumour volume (i.e. contrast-enhancing area) with a margin of 2.5–3 cm, while the boost planning target volume (PTV2) was outlined with a 1.0 –1.5 cm margin. The mean volume of PTV1-s was 371.7 ccm (range: 218.6–505.0 ccm), and the mean volume of the PTV2-s was 69.4 ccm (range: 32.4 –195.2 ccm). Target volumes are listed in detail in the caption to Fig. 1. The lower and the upper brain stems were de ned as critical structures. The lower brain stem (LBS) included the midbrain, the pons and the medulla oblongata, ending at the level of the rst cervical segment of the spinal cord (9 5 mm). The upper brain stem (UBS) included parts of
Modelling normal tissue isoeffect
163
diencephalon: structures surrounding the third ventricle, the thalamus, the hypothalamus and the basal ganglia. The mean volumes of the LBS and UBS were 36.9 ccm (range: 33.5– 40.8 ccm) and 30.2 ccm (range: 26.0– 37.7 ccm), respectively. PTV1 partially involved some parts of the UBS in each case and of the LBS in 4 cases (patients 4, 5, 6 and 8; see Fig. 1). The PTV2 involved a part of UBS in 2 cases (patients 6 and 8; see Fig. 1). Treatment planning The dose calculation was based on 3D options by the Voxelplan treatment planning system. Both traditional 2D and conformal 3D treatment plans were generated for each target volume, taking care of organs at risk as far as possible. In the 2D plans non-conformal coplanar elds were used, taking into consideration the largest diameters of target volumes. Frequently, we selected the opposed weighted eld technique to avoid radiation injury to the eyes. The 3D plans included three or four conformal non-coplanar elds; 6 MV or 18 MV photon energies were selected, depending on the location of the target volume. The 2 Gy reference dose was prescribed to 90% of the maximum dose. The mean relative doses in the PTV1-s were 94.1% (range: 92.6–96.0%) and 94.0% (range: 91.9–
Fig. 1. Anatomical location of suprasellar brain tumours in 10 patients: frontobasal (1); fronto-parietal (2); parietal-parafalxia l (3); parieto-occipital (4); occipital (5); temporo-parieto-occipital (6); temporal (7); deep temporal-insular (8); temporo-parietal (9); fronto-temporo-parietal (10). Primary and boost target volumes in ccm: (1) 397.3 and 46.0; (2) 505.0 and 50.6; (3) 319.3 and 47.2; (4) 476.7 and 65.4; (5) 422.7 and 79.1; (6) 390.0 and 195.2; (7) 419.1 and 32.4; (8) 298.6 and 45.1; (9) 218.6 and 48.2; (10) 269.5 and 85.0 »69.5 (bifocal tumour), respectively.
164
Acta Oncologica 41 (2002)
L. Mangel et al.
96.6%) in the 2D and 3D plans, respectively, while in the PTV2-s the respective values were 94.4% (range: 91.8– 97.5%) and 94.5% (range: 92.3 –95.6%). Simulating the shrinking eld technique, the absolute dose values from extended and boost elds were supplemented with 0.75: 0.25 weightings in each case.
Acta Oncol Downloaded from informahealthcare.com by 218.28.121.22 on 05/20/14 For personal use only.
Biological modelling The calculated data of physical dose distribution were transformed to biological dose data applying a radio-biological equivalence equation. Thus, biologically adapted dose-volume histograms (DVHs) and 3D biological dose distribution were generated; 2.0 Gy was chosen for the a:b ratio of late effects of the normal brain tissues (20). As suggested by others, the biologically effective dose (BED) formula based on the linear quadratic (LQ) model was utilized: BED ¾ D(1» d:(a:b)), where D and d are the total dose and fraction size, respectively (15, 20, 21). Applying this equation to the conventional fractionation schemes results in the LQED2 formula (linear quadratic equivalent dose for 2 Gy fractions) and this was used in our investigation: LQED2 ¾ D(a:b » d):(a:b »2) where D and d are the same as before (21). The traditional 2D treatment plans with daily 2.0 Gy fraction size (2D-CF) and the 3D conformal plans with daily 2.5 Gy fraction size (3D-HOF) using the same total dose of 60 Gy (45 Gy »15 Gy boost dose) were compared. To simulate the daily practice in the shrinking eld technique, the biologically transformed data were added in the proportion 0.75:0.25, as partial biologically effective doses (22). In the 3D-HOF method, in addition to the successive regimen, the simultaneous approach was also tested in order to decrease the biological effect of HOF in organs at
risk. Finally, the concomitant boost irradiation form was chosen for the detailed comparison, when the physical doses were added rst, and the biological transformation was performed afterwards. Calculation of dose to midline structures The biological doses to the lower and upper brain stem with 2D-CF and 3D-HOF regimens were compared. First, the integral biologically effective dose (IBED) to midline structures was determined using the formula devised by Clark et al.: IBED¾ Sndi(1 »di:(a:b))Dvi:V, where i is 1% dose band, di is the ith dose band, Dvi is the volume within each dose band and V is the total dose of the structure (23). A biological equivalent dose of 54 Gy was selected as a tolerable dose to the normal brain, based on previous reports (5, 17). Volumes of the midline structures which received a biologically equivalent dose equal to or greater than 54 Gy (V-BED54) were calculated. Biologically transformed DVHs were generated to calculate the V-BED54. The percentage of the V-BED54 to the whole midline structures as ‘high-dose regions’ was also determined. RESULTS The IBED values of the LBS and UBS for the two treatment methods are listed in Table 1. The IBED values were lower with the 3D-HOF than with the 2D-CF schedule in each tumour location, means 22.79 17.1 and 40.49 16.9 in Gy, respectively (p B 0.0001). The V-BED54 values of the midline structures are presented in Table 2. These volumes with the 3D-HOF regimen are equal to, or lower than those with the 2D-CF regimen in 90% of cases (18 out of 20). The means were 2.79 4.8 ccm for 3D-HOF and
Table 1 Integral biologically effective dose to the midline structures in Gy with 2D-CF (daily 2.0 Gy fraction size) and with 3D -HOF (daily 2.5 Gy fraction size) treatments by anatomical location of tumour
Location of tumour 1. Frontobasal 2. Fronto-parietal 3. Parietal-parafalxia l 4. Parieto-occipital 5. Occipital Average of 1–5. 6. Temporo-parieto-occipital 7. Temporal 8. Deep temporal 9. Temporo-parietal 10. Fronto-temporo-parietal Average of 6–10 Average of 1–10
Lower brain stem
Upper brain stem
2D-CF 18.3 17.5 4.4 16.3 31.6 17.6 9 9.6 43.5 45.8 38.9 33.4 27.4 37.8 9 7.5 27.7 9 13.4
2D-CF 50.7 50.5 48.2 48.6 35.3 46.7 9 6.4 59.8 58.5 59.3 59.3 60.4 59.59 0.7 53.1 9 8.0
3D-HOF 7.5 3.8 1.7 6.1 5.1 4.8 9 2.2 23.2 18.1 15.8 9.6 10.7 15.59 5.6 10.2 9 6.9
3D-HOF 48.2 14.3 23.9 33.3 10.5 26.0 915.2 50.2 39.3 53.9 39.4 40.1 44.6 97.0 35.3 914.8
Abbreviations: 2D ¾ 2-dimensional; CF¾ conventional fractionated; 3D ¾ 3-dimensional; HOF¾ hypofractionated.
Acta Oncologica 41 (2002)
Modelling normal tissue isoeffect
165
Table 2 Volumes in ccm and percentage of total volume that received a biologically equivalent dose of 54 Gy in midline structures, with 2D-CF (with daily 2.0 Gy) and 3D -HOF (with daily 2.5 Gy) regimens by anatomical location of tumour Lower brain stem
Acta Oncol Downloaded from informahealthcare.com by 218.28.121.22 on 05/20/14 For personal use only.
Location of tumour 1. Frontobasal 2. Fronto-parietal 3. Parietal-parafalcial 4. Parieto-occipital 5. Occipital Average of 1–5. 6. Temporo-parieto-occipital 7. Temporal 8. Deep temporal 9. Temporo-parietal 10. Fronto-temporo-parietal Average of 6–10 Average of 1–10
Upper brain stem
2D-CF 0.0 0% 0.0 0% 0.0 0% 0.0 0% 0.0 0% 0.0 90.0
3D-HOF 0.0 0% 0.0 0% 0.0 0% 0.0 0% 0.0 0% 0.0 9 0.0
2D-CF 4.3 16% 1.1 3% 0.0 0% 0.0 0% 0.0 0% 1.1 9 1.9
3D-HOF 1.6 6% 0.0 0% 0.6 2% 1.0 3% 0.0 0% 0.6 90.7
22.1 66% 19.7 57% 8.0 20% 3.8 10% 8.2 20% 12.4 98.0
2.06% 0.0 0% 0.1 0% 0.0 0% 0.0 0% 0.4 9 0.9
27.4 100% 30.5 87% 28.4 100% 30.2 100% 30.2 100% 29.3 9 1.4
11.0 40% 9.8 28% 17.0 60% 7.3 24% 3.3 11% 9.7 95.1
6.2 98.4
0.2 9 0.6
15.2 9 15.0
5.2 95.9
Abbreviations: 2D ¾2-dimensional; CF ¾conventional fractionated; 3D ¾ 3-dimensional; HOF¾ hypofractionated. (Total volumes of the lower and upper brain stem in ccm for patients 1–10: 37.3 and 26.8; 36.5 and 37.7; 35.1 and 28.5; 34.5 and 31.9; 38.3 and 26.0; 33.5 and 27.4; 34.6 and 35.0; 40.1 and 28.4; 38.0 and 30.2; 40.8 and 30.2, respectively.)
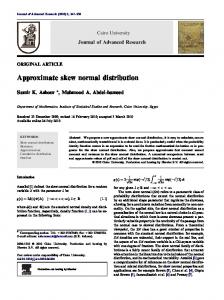
10.7 9 12.7 ccm for 2D-CF (p¾ 0.0006), resulting in a 16 ccm volume sparing on average per patient. However, for patients 3 and 4 the V-BED54 values of the UBS are higher by less than 1 ccm in the 3D-HOF treatment. Considering both the IBED and V-BED54 values, the advantages of the conformal treatment planning are more pronounced for tumours with temporal locations. For visual evaluation of the biological dose distributions, CT slices at the level of the upper part of the eyes were chosen (Figs. 2 and 3). The visualization of isoeffect distribution also proved that with 3D-HOF the dose to midline structures was generally less than that with the 2D-CF treatment plans. The biological dose to midline structures with 3D-HOF did not exceed the 80% isodose values, but with traditional 2D-CF treatment planning it did (patient 10, Fig. 2). However, in the case of an insular tumour, the spatial overdosing of the UBS can be too high, mainly when we examined the regimen with no concomitant boost. The biological dose values over 100% to the midline areas cannot be avoided with HOF (patient 8, Fig. 3). The cumulative DVHs of the two fractionation schemes for patients 10 and 8 are shown in Fig. 4 and 6. In Fig. 4 the advantages of the 3D-HOF regimen are demonstrated. The DVH curves are less steep with 3D-HOF than with 2D-CF with regard to both the LBS and UBS (see Fig. 4 caption), indicating a decreased probability of complications of the brain stem. Conversely, in the case of the insular tumour (patient 8) the analysis of DVH shows that with 3D-HOF treatment without concomitant boost, a signi cant part of the UBS received more than 100% of the biological dose (Fig. 5).
DISCUSSION Malignant gliomas are characterized by local aggressiveness and moderate or low radiosensitivity (1–4). For CF external beam RT at a total dose of 60 Gy the tumor progression-free interval is short, mainly in patients having glioblastoma histology and:or other poor prognostic factors (1, 2). The introduction of image-based conformal methods actually encourages clinicians to be more accurate in dose placement and in acquisition of detailed dose distributions, with an option of dose escalation. Recent studies reported dose escalation up to 90 Gy with teletherapy or even higher total dose with brachytherapy or stereotactic RT boost (3, 4, 9, 19). Such a dose escalation can improve local control for selected patients. In addition, the treatment time is longer and the risk of radionecrosis is high, with the possible consequence of salvage neurosurgery (3, 19). Recently, accelerated-hyperfractionated RT regimens have been used to maximize the therapeutic ratio and shorten the overall treatment time. However, hyperfractionated regimens have no or minimal effect on survival in malignant gliomas (24 –26). Nevertheless, two or three fractions have to be given per day in order to impede sublethal damage repair processes as well (11). We studied an alternative way of dose escalation using an HOF RT regimen without total dose reduction (TDR). Malignant gliomas are radioresistant tumours with rapid proliferation properties and may have lower a:b ratios, factors that can predict higher response rates to HOF (8, 10, 11, 24, 27, 28). However, HOF as per de nition means the reduction of total dose, and for external beam RT in practice generally, HOF regimens are the simplest treat-
Acta Oncol Downloaded from informahealthcare.com by 218.28.121.22 on 05/20/14 For personal use only.
166
L. Mangel et al.
Acta Oncologica 41 (2002)
Fig. 2. The 2D-CF (left) and the 3D-HOF (right) treatment plans at the level of the upper part of the eyes (patient 10). In the 2D version coplanar weighted opposed 2-2 elds, in the 3D version 3-3 non-coplanar conformal elds with 6 and 18 MV-x energies were used. Note that biologically transformed dose values at the midline areas are lower with the conformal method, despite hypofractionation (50 – 70% vs. 80 – 100%).
ment methods in minimizing patient distress and optimizing cost effectiveness. The CNS tissues are fairly sensitive to large single doses, therefore to date, HOF is recommended only for patients with a poor prognosis (8, 24, 29) In previous studies using 2D techniques and HOF RT regimens, total dose was reduced to avoid neurotoxicity (3, 24, 29). One of the most aggressive therapeutic approaches used by Kleinberg et al. (29) suggests a total dose of 17 ½ 3 Gy for patients with advanced disease. Using focal RT,
Hulshof et al. (8) studied 4½ 7 Gy and 8½ 5 Gy HOF regimens for patients with a poor prognosis. They also suggested further investigation of 3D-HOF schedules for patients with a more favourable prognosis. To our knowledge, no other studies have analysed the isoeffect distribution in different anatomical structures using external beam RT with different fractionation schemes and with the same total dose. In our model study we conducted exploratory analyses to determine whether 3D
Fig. 3. Biological dose distributions with 2D-CF (left) and 3D-HOF (right) in a deep temporal tumour location (patient 8). In the 2D version coplanar weighted opposed 2-2 elds, in the 3D version 3-3 non-coplanar conformal elds with 6 and 18 MV-x energies were used. Biologically transformed doses were over 100% in the UBS with the 3D-HOF treatment plan, compared with dose values of 80 – 100% with the 2D-CF treatment plan.
Acta Oncol Downloaded from informahealthcare.com by 218.28.121.22 on 05/20/14 For personal use only.
Acta Oncologica 41 (2002)
Fig. 4. The analysis of the cumulative biological dose-volume histograms of 3D-HOF and 2D-CF regimens with regard to the lower brain stem (LBS), upper brain stem (UBS) and the boost target (patient 10). With 3D-HOF, despite hypofractionation, the dose values to LBS and UBS are much lower (4 and 8) than those with 2D-CF (12 and 16). Note that the average relative biological dose of the boosted target with 3D-HOF was higher than that with 2D-CF (6 vs. 14), with a maximum value of about 115%. Conceptually, this means a higher probability of neurotoxicity, and a simultaneously higher biologically effective tumour dose.
conformal RT would ensure the possibility for biological dose escalation without increasing normal tissue toxicity. Our results con rmed the advantages of 3D-HOF treatment over the traditional 2D-CF irradiation with regard to the midline dose, even when HOF without TDR is used. The magnitude of a volume-sparing effect with 3D-HOF depends on the location and size of the target volume. Nevertheless, the target volume includes considerable normal brain tissues as well, with potential involvement of malignant cells. We endeavoured to avoid the normal tissue toxicity within the target volume using the shrinking eld method and this resulted in a fall in biologically modi ed dose values in the transitional zone. Moreover, we developed a model that is suitable for analysing the effect of different treatment techniques and fractionation schedules on the spatial biological dose distribution and this model could be the basis for future developments. We can also examine the dose inhomogeneity that has a great signi cance in the biological effect of HOF (20). From other studies dealing with brain-stem toxicity, Clark et al. (23) found the IBED values to be comparable with the probability of LBS complication after stereotactic RT, applying different fractionation schemes. They assigned the 60 Gy IBED as the tolerance limit of the LBS using and a:b value of 2.5 Gy. We used a lower a:b value (2.0 Gy) to emphasize the effect of HOF, but we did not
Modelling normal tissue isoeffect
167
Fig. 5. Comparison of the cumulative biological dose-volume histograms of 3D-HOF to 2D-CF regimens with regard to the lower brain stem (LBS) (2 and 9), upper brain stem (UBS) (7 and 14) and the boost target (6 and 13) in patient 8 without a concomitant boost radio therapy (RT) regimen. With 3D-HF, the dose values to UBS are unacceptably high — over 100% biologically transformed doses.
observe IBED values over 60 Gy with 3D-HOF in either UBS or LBS. The IBED values ranged from 1.7 Gy to 50.2 Gy. In contrast, with traditional 2D-CF, the IBED values of the UBS ranged from 58.5 Gy to 60.4 Gy in temporal tumour locations. Debus et al. (18) described how in conformal, mixed photon and proton RT of skull base tumours, the LBS toxicity is affected by the volume of ‘high-dose regions’ (mainly over 60 CGE — cobalt equivalent gray units) rather than by the maximum dose value. They found 2.7 ccm for the threshold volume of LBS toxicity over a 55 CGE dose. We selected 54 Gy as the limiting dose value for our analysis. We calculated 2.0 ccm as the highest value of V-BED54 in the LBS, but in 8 out of 10 cases (80%) there was no high-dose volume with 3D-HOF. On the contrary, in the UBS, the V-BED54 values were up to 17 ccm with 3D-HOF. Nevertheless, in 7 out of 10 cases (70%) the values with 3D-HOF were lower than those with 2D-CF. In the study by Clark et al. (23), late toxicity occurred when the volume irradiated over a 60 Gy biologically effective dose surpassed 18% of LBS. Assigning 54 Gy as the biological limiting dose and applying 3D-HOF, the percentage of ‘high-dose regions’ was over 18% only in UBS (range 0% to 60%). In contrast, with 2D-CF, the percentage of ‘high-dose regions’ in LBS was between 0% and 66%, and in UBS, considering temporal locations, these values were about 100%.
168
L. Mangel et al.
In conclusion, the results of our model study show that 3D HOF RT without TDR may be the therapeutic choice in the treatment of suprasellar lobar glioblastomas. However, the anatomical location and the volume of the target can in uence the validity and feasibility of HOF. The advantage of these regimens is a shorter RT treatment course with higher biological target dose. Prospective clinical studies are required to choose the optimal fractionation schedules and to justify that this 3D HOF approach does indeed improve local control rate without increasing normal tissue toxicity. ACKNOWLEDGEMENT
Acta Oncol Downloaded from informahealthcare.com by 218.28.121.22 on 05/20/14 For personal use only.
We thank the DKFZ-Heidelberg for making the Voxelplan-Virtuose treatment planning system available for our investigation.
REFERENCES 1. Wara WM, Baumann GS, Sneed PK, Larson DA, Karlson UL. Brain, brain stem, and cerebellum. In: Perez CA, Brady LW, eds. Principles and practice of radiation oncology, 3rd ed. Philadelphia New York: Lippincott-Raven Publishers, 1997: 777 – 828. 2. Blomgren H. Brain tumors. Acta Oncol 1996; 35 (Suppl 7): 16– 21. 3. Liang BC, Weil M. Locoregional approaches to therapy with gliomas as the paradigm. Curr Opin Oncol 1998; 10: 201 – 6. 4. Shafman TD, Loef er JS. Novel radiation technologies for malignant gliomas. Curr Opin Oncol 1999; 11: 147 – 51. 5. Emami B, Lyman J, Brown A, et al. Tolerance of normal tissue to therapeutic irradiation. Int J Radiat Oncol Biol Phys 1991; 21: 109 – 22. 6. Leibel SA, Ling CC, Kutcher GJ, Mohan R, Cordon-Cordo C, Fuks Z. The biological basis for conformal three-dimensional radiation therapy. Int J Radiat Oncol Biol Phys 1991; 21: 805– 11. 7. Grosu AL, Feldman HJ, Albrecht C, et al. Dreidimensionale Bestrahlungsplanung bei Hirntumoren. Vorteile der Methode und klinische Ergebnisse (Three-dimensional treatment planning of brain tumors: advantages of the method and clinical results). Strahlenther Onkol 1997; 174: 7– 13. 8. Hulshof MC, Schimmel EC, Andries Bosch D, Gonzalez Gonzalez D. Hypofractionation in glioblastoma multiforme. Radiother Oncol 2000; 54: 143 – 8. 9. Ten Haken RK, Fraass BA, Lichter AS, Marsh LH, Radany EH, Sandler HM. A brain tumor dose escalation protocol based on effective dose equivalence to prior experience. Int J Radiat Oncol Biol Phys 1998; 42: 137 – 41. 10. Jones B, Dale RG. Radiobiologically based assessments of the net costs of fractionated focal radiotherapy. Int J Radiat Oncol Biol Phys 1998; 41: 1139 – 48. 11. Jones B, Dale RG. Mathematical models of tumour and normal tissue response. Acta Oncol 1999; 38: 883 – 93. 12. Brahme A. Development of radiation therapy optimization. Acta Oncol 2000; 39: 579 – 95. 13. Bentzen SM. Quantitative clinical radiobiology. Acta Oncol 1993; 32: 259 – 75.
Acta Oncologica 41 (2002) 14. Beck-Bornholdt HP, Schmidt R, Schwarz RC, Hu¨bener KH. Biological isoeffect distributions: consideration of the in uence of dose per fraction and overall treatment time. A possible tool in future treatment planning. Strahlenther Onkol 1991; 67: 708 –15. 15. Lee SP, Leu MY, Smathers JB, McBride WH, Parker RG, Withers HR. Biologically effective dose distribution based on the linear quadratic model and its clinical relevance. Int J Radiat Oncol Biol Phys 1995; 33: 375– 89. 16. Schmidt R, Schiemann T, Schlegel W, Ho¨hne KH, Hu¨bener KH. Consideration of time-dose patterns in 3D treatment planning. An approach towards 4D treatment planning. Strahlenther Onkol 1994; 170: 292 – 301. 17. Marks JE, Baglan RJ, Prassad SC, Blank WF. Cerebral radionecrosis: Incidence and risk in relation to dose, time, fractionation and volume. Int J Radiat Oncol Biol Phys 1981; 72: 243 – 52. 18. Debus J, Hug EB, Liebsch NJ, et al. Brainstem tolerance to conformal radiotherapy of skull base tumors. Int J Radiat Oncol Biol Phys 1997; 39: 967 – 75. 19. Shrieve DC, Alexander E, Wen PY, et al. Comparison of stereotactic radiosurgery and brachytherapy in the treatment of recurrent glioblastoma multiforme. Neurosurgery 1995; 36: 275– 84. 20. Jones B, Dale RG, Finst P, Khaksar SJ. Biological equivalent dose assessment of the consequences of hypofractionated radiotherapy. Int J Radiat Oncol Biol Phys 2000; 47: 1379 – 84. 21. Wheldon TE, Deehan C, Wheldon EG, Barrett A. The linearquadratic transformation of dose-volume histograms in fractionated radiotherapy. Radiother Oncol 1998; 46: 285– 95. 22. van der Kogel AJ, Ruifrok ACC. Calculation of isoeffect relationships. In: Steel GG, ed. Basic clinical radiobiology, 1st ed. London, Boston, Melbourne, Auckland: Edward Arnold Publishers, 1993: 72 – 80. 23. Clark BG, Souhami L, Pla C, et al. The integral biologically effective dose to predict brain stem toxicity of hypofractionated stereotactic radiotherapy. Int J Radiat Oncol Biol Phys 1998; 40: 667 –75. 24. Botturi M, Fariselli L. Clinical results of unconventional fractionation radiotherapy in central nervous system tumors. Tumori 1998; 84: 176 – 87. 25. Bignardi M, Bertoni F. Radiation treatment with twice a day fractionation versus conventional fractionation in high grade astrocytoma. A retrospective study. Acta Oncol 1987; 26: 441 – 5. 26. Stuschke M, Thames HD. Hyperfractionated radiotherapy of human tumours: overview of the randomized clinical trials. Int J Radiat Oncol Biol Phys 1997; 37: 259 – 67. 27. Haas-Kogan DA, Kogan SS, Yount G, et al. P53 function in uences the effect of fractionated radiotherapy on glioblastoma tumors. Int J Radiat Oncol Biol Phys 1999; 43: 399 – 403. 28. Hasegawa M, Niibe H, Mitsuhashi N, et al. Hyperfractionated and hypofractionated radiation therapy for human malignant glioma xenograft in nude mice. Jpn J Cancer Res 1995; 86: 879 –84. 29. Kleinberg L, Slick T, Enger C, Grossman S, Brem H, Wharam MD. Short course radiotherapy is an appropriate option for most malignant glioma patients. Int J Radiat Oncol Biol Phys 1997; 38: 31 – 6.