VOL. 11, NO. 15, AUGUST 2016
ISSN 1819-6608
ARPN Journal of Engineering and Applied Sciences ©2006-2016 Asian Research Publishing Network (ARPN). All rights reserved.
www.arpnjournals.com
MODELLING, SIMULATION AND OPTIMIZATION OF A REACTIVE DISTILLATION PROCESS USING MINITAB AND MATRIX LABORATORY 1Department
Abdulwahab GIWA1 and Saidat Olanipekun GIWA2
of Chemical and Petroleum Engineering, College of Engineering, Afe Babalola University, Afe Babalola Way, Ado-Ekiti, Ekiti State, Nigeria 2 Department of Chemical Engineering, Faculty of Engineering and Engineering Technology, Abubakar Tafawa Balewa University, Tafawa Balewa Way, Bauchi, Nigeria E-Mail:
[email protected]
ABSTRACT Reactive distillation is a novel process that combines both chemical reaction and separation in a single piece of equipment. It is normally accomplished inside a column. Actually, the process has a lot of benefits, especially for those reactions occurring at temperatures and pressures suitable for the distillation of the resulting components. However, the combination of both reaction and separation in a single unit has made the modelling of the process a bit challenging. It has been deemed necessary to employ a mathematical method, with the aid of Minitab, to handle the modelling of this process in an effective manner. Therefore, in this research work, the modelling knowledge of mathematics has been employed to develop equations for the different phenomena occurring at some specific sections of a reactive distillation column. The developed models were simulated and, further, optimized using Matrix Laboratory in order to obtain the values of the model parameters required to give the desired mole fractions of the product components of the process. The results obtained revealed that the developed models were good representatives of the top and the bottom sections of the column used because there were good correlations between the measured and the simulated mole fractions as the R-squared values of the top and the bottom section models were estimated to be 99.32% and 99.03% respectively. Furthermore, the optimization carried out revealed that multiobjective problem formulation was the best way of handling this type of a system because that was the one that gave the desired optimum values of the two products from their respective sections of the column. Keywords: reactive distillation, modelling, simulation, optimization, Minitab, matrix laboratory.
1. INTRODUCTION In recent years, reactive separation processes have attracted considerable attentions in academic research and industrial applications, (Völker et al., 2007; Giwa and Karacan, 2012b). One of these processes, which is known as “reactive distillation”, is potentially attractive whenever conversion is limited by reaction equilibrium (Balasubramhanya and Doyle III, 2000; Giwa and Karacan, 2012b). Reactive distillation is defined as a process that has the capability of combining both separation and chemical reaction in one equipment unit (Giwa, 2012; Giwa, 2013; Giwa et al., 2013a; Giwa et al., 2013b; Giwa, 2016). A lot of advantages are associated with it, especially, for those reactions occurring at temperatures and pressures suitable for the distillation of the components involved in the reaction (Sneesby et al., 1997; Giwa and Karacan, 2012b; Giwa and Karacan, 2012d; Giwa and Karacan, 2012e; Giwa and Giwa, 2013a; Giwa et al., 2013c; Giwa and Giwa, 2013b; Giwa, 2014; Giwa et al., 2014; Giwa et al., 2015a; Giwa et al., 2015b; Giwa and Giwa, 2016). Furthermore, this process combines the benefits of equilibrium reaction with a unit operation (known as distillation) to achieve a substantial progress in promoting reaction conversion as a result of constant recycling of unconverted materials and removal of products as well as reducing capital and operating costs because of the reduction of number of equipment units of
the plant (Giwa and Karacan, 2012a; Giwa and Giwa, 2013c; Giwa et al., 2014; Giwa and Giwa, 2016). Basically, the combination of reaction and distillation has several advantages which include increase of reaction conversion by simultaneous reaction and separation of products, suppression of side reaction(s) and utilization of heat evolved from an exothermic reaction for mass transfer operation. These synergistic effects of this process result in significant economic benefits (lower capital investment, lower energy cost and higher product yields) of reactive distillation compared to a conventional design having a reactor followed by a number of distillation columns (Moritz and Hasse, 1999; Giwa and Karacan, 2012c; Giwa and Giwa, 2016). Owing to the combination of reaction and separation in a single unit, effective handing of this process, for instance, in the areas of modelling and optimization, is still a challenge to process engineers because many complexities are involved in its operation. Optimization can be defined as a way of obtaining some specified sets of input parameters that give a maximum or a minimum value of an objective functions, which may be subject to some constraints. The most common objective functions are minimizing cost of production and maximizing throughput. In carrying out optimization of a process, the goal(s) can be set to maximizing one or more of the process specifications, while keeping all others within some constraints.
9091
VOL. 11, NO. 15, AUGUST 2016
ISSN 1819-6608
ARPN Journal of Engineering and Applied Sciences ©2006-2016 Asian Research Publishing Network (ARPN). All rights reserved.
www.arpnjournals.com According to the information gathered from the literature, some researchers have carried out some investigations on optimization of reactive distillation processes. For instance, Cardoso et al. (2000) applied a simulated annealing-based algorithm suitable for the optimization of mixed integer non-linear programming problems to the synthesis of a non-equilibrium reactive distillation column. A simulation model based on an extension of conventional distillation was proposed for the simulation step of the optimization problem. In the case of ideal vapour-liquid equilibrium, the simulation results were found similar to those obtained by Ciric and Gu (1994) using GAMS environment and to those obtained with Aspen Plus modular simulator. The optimization results were also obtained to be similar to those obtained using an adaptive random search algorithm (MSGA). The optimizations of the work were also performed with nonideal vapour-liquid equilibrium, considering distributed feed and reaction trays and the results showed that the optimized objective function values were very similar and mostly independent of the number of trays and of the reaction distribution. It was also discovered that the proposed simulation/optimization equation-oriented environments were capable of providing optimized solutions which were close to the global optimum, and that revealed the adequacy of the algorithm for the optimization of reactive distillation problems encountered in chemical engineering practice. Phuenduang et al. (2011) carried out the optimization of biodiesel production from jatropha oil using reactive distillation process by employing response surface methodology (RSM) based on central composite design (CCD) in which methanol flowrate and reflux ratio were the independent variables while the yield of biodiesel obtained from the process was the dependent variable. They were able to obtain very high yield of biodiesel as the optimum value of the output parameter. Giwa and Giwa (2012) used Design Expert and Excel Solver to find the optimum values that could be used to obtain high mole fractions of n-butyl acetate and methanol at the bottom segment and the top segment of a reactive distillation column respectively using Aspen HYSYS model data generated for the process. The achievements of the approximate optimum values of the objective functions given by the optimization carried out using the Excel Solver when the optimum values of reflux ratio and reboiler duty were used to run the experimental simulations showed that the obtained optimum values were valid ones. Giwa and Giwa (2013a) applied response surface methodology in conjunction with Matrix Laboratory (MATLAB) to optimize the reactive distillation esterification process used for the production of isopropyl myristate through the reaction between myristic acid and isopropanol by taking the mole fraction of isopropyl myristate obtained from the column as the objective function and reflux ratio, feed ratio and reboiler duty as the input variables. The optimization results obtained showed that the theoretical optimum values obtained with the aid of fsolve command of MATLAB were valid because the experimental simulation with these values gave the bottom isopropyl myristate mole fraction
that compared very well with the theoretical simulation value of bottom isopropyl myristate mole fraction. Sakhre et al. (2014) used gravitational search algorithm (GSA), which is a heuristic optimization technique to obtain the optimum values for the operation of a reactive distillation process used for producing methyl tert-butyl ether. They applied feed flow rates as a test function along with universal bench mark unimodel test function to obtain optimized process. The GSA code was generated in MATLAB. It was found from the work that the performance of GSA was able to achieve good results regarding the quality and success rate in finding optimal solution. Edreder et al. (2015) used the model equations in terms of mass and energy balances and thermodynamic properties within gPROMS modelling software to optimize the operation of a batch reactive distillation process involving an esterification reaction between acetic acid with methanol to produce methyl acetate and water. Two case studies with varying amount of the reactants were considered in the work. The reflux ratio was selected as the manipulated variable of the optimization with different but fixed batch time ranging from 5 to 15 h in order to maximise the conversion of methanol subject to methyl acetate purity obtained as the product. The dynamic optimisation problem of the work was converted to a nonlinear programming problem by control vector parameterization (CVP) technique and solved using efficient sequential quadratic programming (SQP) method. From the literature review that was carried out, it was noticed that the work of Giwa and Giwa (2012) optimized the mole fractions of methanol and butyl acetate separately as two single-input multi-output objective functions to obtain the optimum values of the process using the fsolve command of MATLAB. However, it was felt that this optimization could be carried out better by considering the two objective functions simultaneously. Therefore, this work has been carried out to optimize the process (a reactive distillation process used for the production of methanol and butyl acetate from the transesterification reaction between methyl acetate and butanol) by considering the two objective functions of the process at the same time with the aid of fsolve and fminimax commands of MATLAB. 2. PROCEDURE 2.1 Prototype plant development The prototype of the process developed with the aid of Aspen HYSYS (Aspen, 2012) from which the data used to develop the models of the reactive distillation process that were optimized was as shown in Figure-1. It (the prototype) was developed with UNIversal QUAsi Chemical (UNIQUAC) model as the fluid package using Distillation Column Sub-Flow sheet having two feed streams (upper and lower). The heavy feed of the process, which was 1-butanol (see Table-1 showing the basic properties of the components), was passed through the upper feed stream while the light one (methyl acetate) was fed into the column from the lower feed stream. The two feeds were passed into the column at the same temperature
9092
VOL. 11, NO. 15, AUGUST 2016
ISSN 1819-6608
ARPN Journal of Engineering and Applied Sciences ©2006-2016 Asian Research Publishing Network (ARPN). All rights reserved.
www.arpnjournals.com and pressure of 25 oC and 1 atm respectively. The column of the prototype plant was divided into different sections, namely condenser section, rectifying section, reaction section, stripping section and reboiler section. The reaction section was between stages 7th and 14th inclusive and the
rectifying and the stripping sections were above and below it, respectively. In this work, the pressures of the condenser and the reboiler sections were both made to be 1 atm.
Figure-1. Developed Aspen HYSYS prototype plant of the reactive distillation process. The reaction of the process is a transesterification type occurring, between butanol and methyl acetate to produce methanol and butyl acetate in the reaction section
of the column. The stoichiometry of the reversible reaction is given as shown in Equation 1.
Table-1. Basic properties of the components. Component
Molecular weight (kg/kgmol)
Boiling point (oC)
Density (kg/m3)
Butanol
74.12
117.75
813.87
Methyl acetate
74.08
57.25
939.33
Methanol
32.04
64.65
795.72
Butyl acetate
116.16
126.15
885.84
Source: Aspen, 2012 CH 3 OH CH 3 COOC4 H 9 (1) C4 H 9 OH CH 3 COOCH3 K eq
(1 )
(2)
(3)
(4)
Furthermore, using the numbering notation below the components, the reaction rate equation of the process is given as shown in Equation (2) (Wang et al., 2008).
r 2.018108 exp71960 / RT C1C 2 2.839108 exp72670 / RT C3 C 4 2.2 Experimental design After the development of the prototype plant of the process, Minitab17 (Minitab, 2013) was used to design a set of custom experiments (given in Table-2) based on the four factors (independent variables) considered in this
(2)
work. Those independent variables were reflux ratio (x1), butanol volumetric flow rate (x2), methyl acetate volumetric flow rate (x3) and reboiler duty (x4).
9093
VOL. 11, NO. 15, AUGUST 2016
ISSN 1819-6608
ARPN Journal of Engineering and Applied Sciences ©2006-2016 Asian Research Publishing Network (ARPN). All rights reserved.
www.arpnjournals.com Table-2. Designed experiments for the reactive distillation process.
3. RESULTS AND DISCUSSIONS The outputs obtained from the running of the prototype plant of the reactive distillation process using the input data generated with the aid of Minitab are given together with the input data in Table-3. As can be seen from the table, the mole fractions of the desired products of the process, which were methanol and butyl acetate obtained from the top and the bottom sections of the column respectively, were changing with changes in the values of the different input variables considered. The changes observed were indications that the input variables were actually having effects on the process.
Run
x1
x2
x3
x4
1
3
25
35
0.95
2
5
25
25
0.95
3
3
25
25
0.25
4
3
35
25
0.95
5
3
25
25
0.95
6
3
25
25
0.95
7
3
25
15
0.95
8
4
30
20
0.6
9
2
30
30
1.3
Run
x1
x2
x3
x4
xMeOH
xBtAc
10
4
30
30
0.6
1
3
25
35
0.95
0.39
0.50
11
4
20
30
1.3
2
5
25
25
0.95
0.36
0.42
12
4
30
20
1.3
3
3
25
25
0.25
0.87
0.30
13
4
20
30
0.6
4
3
35
25
0.95
0.85
0.72
14
2
20
30
0.6
5
3
25
25
0.95
0.78
0.99
15
4
20
20
0.6
6
3
25
25
0.95
0.77
0.99
16
2
20
20
0.6
7
3
25
15
0.95
0.53
0.84
17
2
30
30
0.6
8
4
30
20
0.6
0.56
0.37
18
3
25
25
0.95
9
2
30
30
1.3
0.33
1.00
19
3
25
25
0.95
10
4
30
30
0.6
0.54
0.34
20
3
25
25
0.95
11
4
20
30
1.3
0.51
1.00
21
2
30
20
0.6
12
4
30
20
1.3
0.61
0.81
22
4
30
30
1.3
13
4
20
30
0.6
0.38
0.33
23
3
25
25
0.95
14
2
20
30
0.6
0.52
0.55
15
4
20
20
0.6
0.38
0.40
16
2
20
20
0.6
0.77
0.99
17
2
30
30
0.6
0.68
0.48
18
3
25
25
0.95
0.78
0.99
19
3
25
25
0.95
0.78
0.99
20
3
25
25
0.95
0.78
0.99
21
2
30
20
0.6
0.88
0.68
22
4
30
30
1.3
0.82
0.96
23
3
25
25
0.95
0.78
0.99
In order to run the developed Aspen HYSYS plant using the values of the independent variables given in Table-2, Sparse Continuation Solver was employed because it was the one found suitable for a process of this nature. 2.3 Model development and optimization After running the prototype plant using the experimental operating values generated with the aid of Minitab, the responses obtained were entered into the program (Minitab) and the experimental results were analysed to obtain model equations as well as carry out the analyses of variance for the phenomena occurring at the top and the bottom sections of the reactive distillation column in form of quadratic equations. Furthermore, the process was optimized using the developed model equations with the aid of Matrix Laboratory (MATLAB) (Mathworks, 2015) using fsolve (with LevenbergMarquardt) algorithm and fminimax.
Table-3. Experimental results obtained from the prototype plant of the reactive distillation process.
Using the input and output data presented in Table-3, Equation 3 which relates the input variables with top methanol mole fraction and Equation 4 that gives mathematical relationship between the second response, bottom butyl acetate mole fraction and input variable of the process, were developed. Given in Tables 4 and 5 are the results of the analyses of variance carried out on the developed models.
9094
VOL. 11, NO. 15, AUGUST 2016
ISSN 1819-6608
ARPN Journal of Engineering and Applied Sciences ©2006-2016 Asian Research Publishing Network (ARPN). All rights reserved.
www.arpnjournals.com
x MeOH 0.439 0.0270x1 0.0693x2 0.0957x3 2.095x4 0.12150x1 0.001532x2 2
2
0.003326x3 0.2035x4 0.00139x1 x2 0.01164x1 x3 0.4225x1 x4 2
2
0.000357x2 x3 0.01540x2 x4 0.02296x3 x4
(3)
x BtAc 0.890 0.377x1 0.0227x 2 0.0436x3 1.355x 4 0.0631x1 0.000887x 2 2
2
0.003092x3 0.1828x 4 0.00903x1 x 2 0.01457x1 x3 0.0115x1 x 4 2
2
0.001648x 2 x3 0.01921x 2 x 4 0.01103x3 x 4 As
shown
in
Table-4,
confidence level, all the terms of
considering
95%
xMeOH model were
found to be significant, because the probability value of each of them was less than 5% except those of x1 x2 and
(4)
x2 x3 which were greater than 0.05. Based on this, the model was found necessary for modification so that the terms having probability levels greater than 5% could be removed from it.
Table-4. Analysis of variance of the developed top section model. Source
DF
Adj SS
Adj MS
F-Value
P-Value
Model
15
0.745274
0.049685
87.51
0.000
Blocks
1
0.001603
0.001603
2.82
0.137
Linear
42.23
0.000
4
0.095911
0.023978
x1
1
0.003298
0.003298
5.81
0.047
x2
1
0.054982
0.054982
96.84
0.000
x3
1
0.007729
0.007729
13.61
0.008
x4
1
0.029638
0.029638
52.20
0.000
Square
4
0.333876
0.083469
147.01
0.000
2
1
0.150189
0.150189
264.52
0.000
2
1
0.014930
0.014930
26.30
0.001
2
1
0.172109
0.172109
303.13
0.000
2
1
0.005258
0.005258
9.26
0.019
2-Way Interaction
6
0.253770
0.042295
74.49
0.000
x1 x2
1
0.000389
0.000389
0.68
0.435
x1 x3
1
0.029796
0.029796
52.48
0.000
x1 x4
1
0.113724
0.113724
200.30
0.000
x2 x3
1.23
0.304
x1
x2 x3 x4
1
0.000699
0.000699
x2 x 4
1
0.003776
0.003776
6.65
0.037
x3 x4
1
0.010933
0.010933
19.26
0.003
Error
7
0.003974
0.000568
Lack-of-Fit
3
0.003974
0.001325
18107.81
0.000
Pure Error
4
0.000000
0.000000
Total
22
0.749248
9095
VOL. 11, NO. 15, AUGUST 2016
ISSN 1819-6608
ARPN Journal of Engineering and Applied Sciences ©2006-2016 Asian Research Publishing Network (ARPN). All rights reserved.
www.arpnjournals.com Table-5. Analysis of variance of the developed bottom section model. Source
DF
Adj SS
Adj MS
Model
15
1.66728
0.111152
108.58
0.000
Blocks
1
0.00078
0.000779
0.76
0.412
Linear
4
0.34879
0.087196
85.18
0.000
x1
1
0.12590
0.125903
122.99
0.000
x2
1
0.03828
0.038276
37.39
0.000
x3
1
0.07601
0.076008
74.25
0.000
x4
1
0.31937
0.319366
311.99
0.000
Square
4
0.19319
0.048297
47.18
0.000
2
1
0.04054
0.040536
39.60
0.000
2
1
0.00501
0.005008
4.89
0.063
2
1
0.14868
0.148684
145.25
0.000
2
1
0.00424
0.004244
4.15
0.081
x1 x2 x3 x4
P-Value
2-Way Interaction
6
0.12580
0.020966
20.48
0.000
x1 x2
1
0.01643
0.016431
16.05
0.005
x1 x3
1
0.04670
0.046695
45.62
0.000
x1 x4
1
0.00008
0.000085
0.08
0.782
x2 x3
1
0.01494
0.014939
14.59
0.007
x2 x 4
1
0.00588
0.005877
5.74
0.048
x3 x4
1
0.00252
0.002523
2.46
0.160
432063.84
0.000
Error
7
0.00717
0.001024
Lack-of-Fit
3
0.00717
0.002389
Pure Error
4
0.00000
0.000000
Total
2
1.67445
Given in Table-5 are the outputs obtained from the analysis of variance done for the model equation developed for the bottom section of the column; that is, the model equation relating the bottom butyl acetate to the input variables of the process. From the information obtained from the table, it was discovered that, apart from 2
F-Value
2
x 2 , x 2 , x1 x4 and x3 x4 that had their probability values to be greater than 5%, all other terms of the model were found to be significant because the probability value of each of them was less than 0.05. This was found to be an indication that this model too needed to be modified so
that all its terms could have probability values that would be less than 0.05. Further shown in Equation (5) is the modified version of the top section model after the terms having probability values greater than 0.05 have been removed. The modified model was also analysed to be sure that all the terms would have probability values less than 5%. From the analysis of variance results obtained and given in Table-6, it was discovered that the model had been modified well because each of the terms present can now be seen to have a probability value less than 5%.
xMeOH 0.738 0.0580x1 0.0864x2 0.1025x3 2.229x4 0.12223x1 0.001660x2 2
2
0.003316x3 0.2240x4 0.01182x1 x3 0.4285x1 x4 0.01940x2 x4 0.02449x3 x4 2
2
(5)
9096
VOL. 11, NO. 15, AUGUST 2016
ISSN 1819-6608
ARPN Journal of Engineering and Applied Sciences ©2006-2016 Asian Research Publishing Network (ARPN). All rights reserved.
www.arpnjournals.com Table-6. Analysis of variance of the modified top section model. Source
DF
Adj SS
F-Value
P-Value
Model
13
0.744185
0.057245
101.76
0.000
Blocks
1
0.001434
0.001434
2.55
0.145
Linear
4
0.129026
0.032256
57.34
0.000
x1
1
0.004656
0.004656
8.28
0.018
x2
1
0.083935
0.083935
149.21
0.000
x3
1
0.007060
0.007060
12.55
0.006
x4
1
0.038796
0.038796
68.97
0.000
Square
4
0.344671
0.086168
153.18
0.000
2
1
0.161315
0.161315
286.77
0.000
2
1
0.019406
0.019406
34.50
0.000
2
1
0.171763
0.171763
305.34
0.000
2
1
0.006762
0.006762
12.02
0.007
2-Way Interaction
4
0.252682
0.063170
112.30
0.000
x1 x3
1
0.031026
0.031026
55.16
0.000
x1 x4
1
0.141355
0.141355
251.29
0.000
x2 x 4
1
0.008036
0.008036
14.29
0.004
x3 x4
1
0.013362
0.013362
23.75
0.001
Error
9
0.005063
0.000563
Lack-of-Fit
5
0.005062
0.001012
13839.87
0.000
Pure Error
4
0.000000
0.000000
Total
22
0.749248
x1 x2 x3 x4
Adj MS
xBtAc 1.481 0.400x1 0.0739x2 0.0414x3 1.681x4 0.0616x1 0.003078x3 2
0.00987x1 x2 0.01445x1 x3 0.002063x2 x3 0.03058x2 x4 Given in Equation (6) and Table-7 are the modified model equation for the bottom section and the results of its analysis of variance, respectively. According
2
(6)
to results of analysis of variance given in the table, all the terms in the model equation are now having probability values that are less than 5%.
9097
VOL. 11, NO. 15, AUGUST 2016
ISSN 1819-6608
ARPN Journal of Engineering and Applied Sciences ©2006-2016 Asian Research Publishing Network (ARPN). All rights reserved.
www.arpnjournals.com Table-7. Analysis of variance of the modified bottom section model. Source
DF
Adj SS
Adj MS
F-Value
P-Value
Model
11
1.65828
0.15075
102.59
0.000
Blocks
1
0.00017
0.00017
0.12
0.738
Linear
4
1.20922
0.30230
205.72
0.000
x1
1
0.26004
0.26004
176.96
0.000
x2
1
0.11792
0.11792
80.25
0.000
x3
1
0.14042
0.14042
95.56
0.000
x4
1
1.11934
1.11934
761.74
0.000
Square
2
0.19195
0.09597
65.31
0.000
2
1
0.04793
0.04793
32.62
0.000
2
1
0.14782
0.14782
100.59
0.000
2-Way Interaction
4
0.13633
0.03408
23.19
0.000
x1 x2
1
0.02483
0.02483
16.90
0.002
x1 x3
1
0.05469
0.05469
37.22
0.000
x2 x3
1
0.02773
0.02773
18.87
0.001
x2 x 4
1
0.02205
0.02205
15.01
0.003
Error
11
0.01616
0.00147
Lack-of-Fit
7
0.01616
0.00231
417708.19
0.000
Pure Error
4
0.00000
0.00000
Total
22
1.67445
x1 x3
1 0.9
Top methanol mole fraction
0.8
Measured
0.7
Simulated
0.6 0.5 0.4 0.3 0.2 0.1 0 1
2
3
4
5
6
7
8
9
10
11
12
13
14
15
16
17
18
19
20
21
22
23
Run
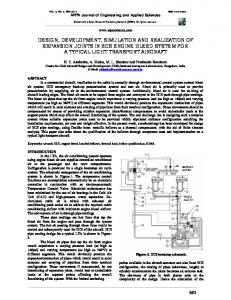
Figure-2. Measured and simulated mole fractions of methanol obtained from the top section of the column. After obtaining the reliable models for the top and the bottom sections of the column, they were simulated and the results obtained from the simulations were as given in Figures 2 and 3 as plots of the measured
and the simulated mole fractions of the products versus the runs. Figure-2 shows the measured and the simulated mole fractions of methanol obtained from the top section
9098
VOL. 11, NO. 15, AUGUST 2016
ISSN 1819-6608
ARPN Journal of Engineering and Applied Sciences ©2006-2016 Asian Research Publishing Network (ARPN). All rights reserved.
www.arpnjournals.com Shown in Figure-3 are the results obtained when the simulation of the model equation developed for the bottom section of the column was executed. In this case also, good correlations were found to exist between the simulated mole fractions and the ones that were measured from the prototype of the process as the R-squared value was estimated in this case to be 99.03%.
of the reactive distillation column. As can be seen from the figure, good correlations were found to exist between the results that were plotted side by side in a clustered column chart. To actually ascertain that there were good correlations between the measured and the simulated ones, the R-squared value of the relationship was estimated and obtained to be 99.32%. 1.2
Bottom butyl acetate mole fraction
Measured Simulated
1
0.8
0.6
0.4
0.2
0 1
2
3
4
5
6
7
8
9
10
11
12
13
14
15
16
17
18
19
20
21
22
23
Run
Figure-3. Measured and simulated mole fractions of butyl acetate obtained from the bottom section of the column. After obtaining and ascertaining that the developed modified model equations for the top and the bottom sections of the reactive distillation column could represent the process very well, it was deemed necessary to optimize it (the process) because it was desired to collect at least 85% purity of each of the products from the top and bottom sections of the column accordingly. Based on that, the optimization of the process was carried out by taking the initial values of the reflux ratio, butanol flow rate, methyl acetate flow rate and reboiler duty to be 1, 20 mL/min, 20 mL/min and 0.5 kJ/s, respectively via codes written in MATLAB environment and the results obtained were as given in Tables 8-10. The results given in Table-8 were the ones obtained when the objective function of the optimization
was taken as the maximization of the mole fraction of methanol given from the top section of the column. According to the table, the objective of the optimization was achieved when fsolve was used because a maximum methanol mole fraction of 1.00 but with butyl acetate mole fraction of 0.70 was attained. From the same table, it was noticed that the values of the mole fraction of methanol obtained from the top section of the column when fminimax was used as the optimization command in the MATLAB was greater than the maximum value expected which was 1.00. Besides, the value of the other product was very low. The results given in this table revealed that the objectives of the optimization, which were the achievement of at least 85% (0.85) purity of each of the products had not been satisfied.
Table-8. Optimum values obtained when the maximization of top methanol mole fraction was the objective function. Parameter
Initial value
Optimization using fsolve
Optimization using fminimax
Reflux ratio
1
1.06
1.29
Butanol flow rate (mL/min)
20
20.01
26.61
Methyl acetate flow rate (mL/min)
20
20.00
18.12
Reboiler duty (kJ/s)
0.5
0.24
0.10
1.00
1.23
Methanol mole fraction Butyl acetate mole fraction As such, the objective function of the optimization was changed to the maximization of the mole
0.70 0.39 fraction of butyl acetate given from the process through the bottom section of the column, and the results of this
9099
VOL. 11, NO. 15, AUGUST 2016
ISSN 1819-6608
ARPN Journal of Engineering and Applied Sciences ©2006-2016 Asian Research Publishing Network (ARPN). All rights reserved.
www.arpnjournals.com optimization are given in Table-9. From the results shown in Table-9, the optimization carried out using fsolve was found to be better than that done with fminimax command because when fsolve command was used, at least, the objective function was satisfied because a mole fraction of
1.00 was obtained for the butyl acetate product given by the system, even though that of the other product was not up to 0.85 as desired, but that of fminimax command was found not to be good at all.
Table-9. Optimum values obtained when the maximization of bottom butyl acetate mole fraction was the objective function. Parameter Reflux ratio Butanol flow rate (mL/min) Methyl acetate flow rate (mL/min) Reboiler duty (kJ/s) Methanol mole fraction Butyl acetate mole fraction
Initial value 1 20 20 0.5
Optimization using fsolve 1.00 20.00 20.00 0.51 0.69 1.00
Furthermore, the optimization of the process was carried out as a multiobjective type in which the objective functions were the maximization of the mole fractions of methanol and butyl acetate leaving the top and the bottom sections of the column respectively. From the results obtained through the optimization, it was discovered that the two optimization commands used in this case were able to perform very well because both of them could give
Optimization using fminimax 5814.68 0.10 0.10 2392867.49 -1276629929194.66 1930056.46
a mole fraction that was greater than 0.85, which was the target value for each of the products. According to the table, the mole fractions obtained for methanol and butyl acetate when fsolve command was used were 0.88 and 0.89 respectively while the values of the mole fraction obtained for the two products when fminimax command was used was 0.89.
Table-10. Optimum values obtained when the maximization of top methanol and bottom butyl acetate mole fractions were the objective functions. Parameter
Initial value
Optimization using fsolve
Optimization using fminimax
Reflux ratio
1
1.28
0.60
Butanol flow rate (mL/min)
20
18.83
13.85
Methyl acetate flow rate (mL/min)
20
17.75
14.87
Reboiler duty (kJ/s)
0.5
0.35
0.10
Methanol mole fraction
0.88
0.89
Butyl acetate mole fraction
0.89
0.89
Furthermore, the values of the input variables in this case of multiobjective optimization were found to change significantly for the two MATLAB commands (fsolve and fminimax) employed when compared to the other two optimizations carried out before in this work. This was found to be an indication that the process really responded to the input variables in the course of this multiobjective optimization.
the extent of having R-squared values of 99.32% and 99.03% respectively for the top and the bottom section models. Furthermore, it was observed from the optimization carried out that handling this type of a system in a multiobjective way was better because that was the one that gave the desired optimum values of the two products from their respective sections of the column considered.
4. CONCLUSIONS The results obtained from the modelling and simulation of the reactive distillation process used for the production of methanol and butyl acetate from the transesterification reaction between butanol and methyl acetate revealed that the developed models were good representatives of the top and the bottom sections of the column used, because there were good correlations between the measured and the simulated mole fractions to
Nomenclature Adj Adjusted Qc Condenser heat duty (kJ/s) Qr Reboiler heat duty (kJ/s) x1 Reflux ratio x2 Butanol volumetric flow rate (mL/min) x3 Methyl acetate volumetric flow rate (mL/min) x4 Reboiler duty (kJ/s)
9100
VOL. 11, NO. 15, AUGUST 2016
ISSN 1819-6608
ARPN Journal of Engineering and Applied Sciences ©2006-2016 Asian Research Publishing Network (ARPN). All rights reserved.
www.arpnjournals.com ACKNOWLEDGEMENT Special thanks go to Aare Afe Babalola, LL.B, FFPA, FNIALS, FCIArb, LL.D, SAN, OFR, CON – The Founder and President, and the Management of Afe Babalola University, Ado-Ekiti, Ekiti State, Nigeria for providing the very conducive environment that enabled the accomplishment of this research work.
Distillation Process. ARPN Journal of Engineering and Applied Sciences. 8(8): 614-624. Giwa A. and Giwa S.O. 2013c. Layer-Recurrent Neural Network Modelling of Reactive Distillation Process. Chaotic Modeling and Simulation. 2(4): 647-656.
Aspen. 2012. Aspen HYSYS V8.0 (27.0.0.38). Aspen Technology, USA.
Giwa A. and Giwa S.O. 2016. Modelling and Simulation of a Reactive Distillation Process for Fuel Additive Production. Journal of Environmental Science, Computer Science and Engineering and Technology, Section C: Engineering and Technology. 5(1): 63-74.
Balasubramhanya L. S. and Doyle III, F. J. 2000. Nonlinear Model-Based Control of a Batch Reactive Distillation Column. Journal of Process Control. 10: 209218.
Giwa A. and Karacan S. 2012a. Modeling and Simulation of a Reactive Packed Distillation Column Using Delayed Neural Networks. Chaotic Modeling and Simulation. 2(1): 101-108.
Cardoso M.F., Salcedo R.L., Feyo de Azevedo S., Barbosa D. 2000. Optimization of Reactive Distillation Processes with Simulated Annealing. Chemical Engineering Science. 55: 5059-5078.
Giwa A. and Karacan S. 2012b. Simulation and Optimizatıon of Ethyl Acetate Reactive Packed Distillation Process Using Aspen Hysys. The Online Journal of Science and Technology. 2(2): 57-63.
Ciric A.R. and Gu D. 1994. Synthesis of Nonequilibrium Reactive Distillation Processes by MINLP Optimization. AIChE Journal. 40(9): 1479-1487.
Giwa A. and Karacan S. 2012c. Development of Dynamic Models for a Reactive Packed Distillation Column. International Journal of Engineering. 6(3): 118-128.
Edreder M., Mujtaba I. and Emtir M. 2015. Optimal Operation of Batch Reactive Distillation Process Involving Esterification Reaction System. Chemical Engineering Transactions, 43: 1387-1392.
Giwa A. and Karacan S. 2012d. Nonlinear Black-Box Modeling of a Reactive Distillation Process. International Journal of Engineering Research and Technology. 1(7): 548-557.
Giwa A. 2012. Steady-State Modeling of n-Butyl Acetate Transesterification Process Using Aspen PLUS: Conventional versus Integrated. ARPN Journal of Engineering and Applied Sciences. 7(12): 1555-1564.
Giwa A. and Karacan S. 2012e. Decoupling Control of a Reactive Distillation Process Using Tyreus-Luyben Technique. ARPN Journal of Engineering and Applied Sciences. 7(10): 1263-1272.
Giwa A. 2013. Methyl Acetate Reactive Distillation Process Modeling, Simulation and Optimization Using Aspen Plus. ARPN Journal of Engineering and Applied Sciences. 8(5): 386-392.
Giwa A., Bello A. and Giwa S.O. 2014. Performance Analyses of Fatty Acids in Reactive Distillation Process for Biodiesel Production. International Journal of Scientific and Engineering Research. 5(12): 529-540.
Giwa A. 2014. Solving the Dynamic Models of Reactive Packed Distillation Process Using Difference Formula Approaches. ARPN Journal of Engineering and Applied Sciences. 9(2): 98-108.
Giwa A., Bello A. and Giwa S.O. 2015a. Artificial Neural Network Modeling of a Reactive Distillation Process for Biodiesel Production. International Journal of Scientific and Engineering Research. 6(1): 1175- 1191.
Giwa A. and Giwa S.O. 2012. Optimization of Transesterification Reaction Integrated Distillation Column Using Design Expert and Excel Solver. International Journal of Advanced Scientific and Technical Research. 2(6): 423-435.
Giwa A., Giwa S.O. and Adeyi A.A. 2015b. Dynamics and Servo Control of Biodiesel Purity from a Reactive Distillation Process. International Journal of Scientific and Engineering Research. 6(8): 146-156.
REFERENCES
Giwa A. and Giwa S.O. 2013a. Isopropyl Myristate Production Process Optimization Using Response Surface Methodology and MATLAB. International Journal of Engineering Research and Technology. 2(1): 853-862. Giwa A. and Giwa S.O. 2013b. Estimating the Optimum Operating Parameters of Olefin Metathesis Reactive
Giwa A., Giwa S.O. and Hapoglu H. 2013b. Adaptive Neuro-Fuzzy Inference Systems (ANFIS) Modeling of Reactive Distillation Process. ARPN Journal of Engineering and Applied Sciences. 8(7): 473-479. Giwa A., Giwa S.O., Bayram İ. and Karacan S. 2013c. Simulations and Economic Analyses of Ethyl Acetate Productions by Conventional and Reactive Distillation
9101
VOL. 11, NO. 15, AUGUST 2016
ISSN 1819-6608
ARPN Journal of Engineering and Applied Sciences ©2006-2016 Asian Research Publishing Network (ARPN). All rights reserved.
www.arpnjournals.com Processes Using Aspen Plus. International Journal of Engineering Research & Technology. 2(8): 594-605. Giwa S.O., Giwa A. and Hapoglu H. 2013a. Investigating the Effects of Some Parameters on Hydrogen Sulphide Stripping Column Using Aspen HYSYS. ARPN Journal of Engineering and Applied Sciences. 8(5): 338-347. Giwa A. 2016. PI and PID Control of a Fuel Additive Reactive Distillation Process. ARPN Journal of Engineering and Applied Sciences. 11(11): 6779-6793. Math Works. 2015. MATLAB, the Language of Technical Computing. The Math Works, Inc., Natick. Minitab. 2013. Minitab 17.1.0. Minitab Inc. USA. Moritz P. and Hasse H. 1999. Fluid Dynamics in Reactive Distillation Packing Katapak®-S. Chemical Engineering Science. 54: 1367-1374. Phuenduang S., Siricharnsakunchai, P., Simasatitkul, L., Paengjuntuek, W. and Arpornwichanop, A. 2011. Optimization of Biodiesel Production from Jatropha Oil Using Reactive Distillation. Proceedings of TIChE International Conference 2011. pp. 1-4. Sneesby M.G., Tade M.O., Datta R. and Smith T.N. 1997. ETBE Synthesis via Reactive Distillation. 2. Dynamic Simulation and Control Aspects. Industrial and Engineering Chemistry Research. 36: 1870-1881. Sakhre V., Jain S., Sapkal V.S. and Agarwal D.P. 2014. Process Optimization of MTBE Reactive Distillation Using GSA. International Journal of Chemical Engineering and Applications. 5(6): 457-461. Völker M., Sonntag C. and Engell S. 2007. Control of Integrated Processes: A Case Study on Reactive Distillation in a Medium-Scale Pilot Plant. Control Engineering Practice. 15: 863-881. Wang S.-J., Wong D.S.H., Yu S.-W. 2008. Design and Control of Transesterification Reactive Distillation with Thermal Coupling, Computers and Chemical Engineering. 32: 3030-3037.
9102