Modelling Temporal Variations in Leachate Quantity Generated at Kahrizak Landfill E. Safaria and C. Baronianb a
Faculty of Environmental Engineering, University of Tehran, Tehran, Iran (
[email protected]) b
Institute of Geophysics, University of Tehran, Tehran, Iran (
[email protected])
Abstract: Kahrizak landfill has been in operation for several decades with no record of the quantity of the generated leachate. An attempt was made to develop a water balance model, which despite the current rough estimates of annual leachate quantity at this site, takes into account the precipitation and evaporation patterns as well as the concept of field capacity. Changes in field capacity and water consumed in gas generation were formulated based on empirical relationships of the nearest applicability to this site found in the literature. Monthly meteorological data were employed with an option provided to convert them into daily average values to match the daily time step if required. The model results for Kahrizak landfill were in good agreement with the estimation made by Tehran municipality, although more reliable results can be achieved if more accurate site specific data is provided through field measurements as well as test trenches. Keywords: Landfill, leachate, Kahrizak, water balance model 1.
INTRODUCTION
Land filling of Municipal Solid Waste (MSW) is the predominant method of MSW management in Tehran. The generated MSW at Tehran amounting to about 6500 tons per day is dumped at Kahrizak site. Deep and narrow trenches are filled with MSW and covered with construction and demolition wastes as daily and final cover. All trenches lack Leachate Collection System (LCS) and consequently no record of leachate quantity is available. Organization of Waste Reuse and Composting (OWRC) once estimated the leachate quantity to be between 500 to 700 cubic meters per day, by summing up the volume of leachate collected in certain ponds throughout a year and assuming a uniform distribution. This simple approach disregards the temporal variations in leachate generation. Changes in Field Capacity (FC) defined as the fraction of water in the waste based on dry weight of the waste (Tchobanoglous, 1993) as well as waste density are the most required data which have never been measured. A closer look to the leachate generation process was found necessary to achieve a deterministic model, which takes into account the temporal variations of physical characteristics of the waste as well as climatological data.
482
2.
METHODOLOGY
Leachate quantity is usually modelled and/or determined using a simple water balance approach taking into account the amounts of water entering the landfill (i.e. precipitation, waste moisture in excess of moisture holding capacity of the waste and additional water input such as water in wastewater treatment plant sludges if allowed) and the amounts of water leaving the landfill (i.e. water consumed in biochemical reactions and evaporation) [Tchobanoglous, 1993, Bagchi, 1994 and Rhyner et al., 1995]. The Hydrologic Evaluation of Landfill Performance (HELP) [Shroder et al., 1994] as the most widely used model employs the same concept of water balance excluding the biochemical reactions and computes the leachate quantity based on a detailed meteorological and MSW characteristics data. In the case of Kahrizak landfill which is located in a semi-arid region (i.e. south of Tehran), precipitation can not be considered the major leachate generating component. On the other hand, the relatively high moisture content of the waste (i.e. greater than 40% by weight) can in fact play the main role in leachate generation process. The variation in FC (also referred to as water
absorption capacity) of the waste is an important factor often ignored.
Tchobanoglous [1993] determines the moisture holding capacity using the following equation:
In this paper, the different parameters influencing the amount of leachate generated considering trench method of waste disposal are discussed based on which a model is constructed and run as an example for Kahrizak landfill site.
W(t)=FC(t)*D(t)
The model first assumes that a single cell is waste filled and covered with cover material. A water balance as proposed in this paper is applied to this single cell bearing in mind that FC of the waste changes rapidly during the first days of operation due to vehicle movement over the waste and placement of cover material. Thereafter FC decreases gradually due to waste material degradation resulting in additional settlement. The amount of leachate obtained for every single cell computed for a certain period of time (e.g. a few years) is then super imposed to that of new cells filled with MSW. This results in the overall leachate quantity estimation showing also the temporal variations. The key parameters and modelling procedure are discussed bellow. 2.1. Field capacity and time interval Field capacity as defined by Tchobanoglous [1993] decreases as the waste filled depth increases. Since the waste depth is a time dependent variable, therefore FC as well can be introduced as a function of time. The waste filled depth is directly related to the method of land filling. Different methods are well discussed in the literature [Tchobanoglous 1993, Bagchi, 1994 and Rhyner et al., 1995]. If a trench of H meters deep is to be occupied with daily cells of h meters high, it will then take H/h days for the whole depth to be filled. This can be considered as a reasonable time interval. FC is a density dependent variable [Blakey, 1996] and shown to decrease as the density increases [Blight et al., 1996]. Although experimental work is required to evaluate the variation of FC, but it can be introduced as an exponential and/or linear function of time considering the values reported by Blight et al. [1996]. The exponential /linear behaviour of FC was introduced by Blight et al. (1996), based on a series of field measurements for fresh and older waste. Besides FC being a density dependent variable decreases rapidly during the first stages of compaction due to vehicle movement, cover placement etc.. Thereafter FC decreases gradually as the overburden pressure decreases substantially. 2.2. Primary leachate
where t denotes the time from disposal of MSW, W is the mass of water held in waste (kg) and D is dry weight of MSW (kg). Therefore the Primary leachate (PL in kg) will be the difference in water content at any given pair of times: PL(t)=W(t-∆t)-W(t)
483
(2)
where ∆t is the time interval. Equation 2 simply states that moisture content at any time step equals the amount of water held in the waste, calculated for previous time step. Therefore W(0) (i.e. water held in waste at the first time step) will be the same as initial moisture content. 2.3. Water consumed in gas production Biogas is produced within a landfill as a result of anaerobic degradation of MSW. Assuming that the organic Carbon content of the waste can partly be converted to biogas, the total amount of gas to be produced can be estimated using the following equation [Ehrig, 1996]: Ge = 1.868 C (0.014 T+0.28)
(3)
where Ge is the total gas quantity (m3/ton of MSW), C is the Total Organic Content (TOC) (kg/ton of MSW) and T is temperature in degrees of Centigrade. Gas generation rate can be determined using different models, among which the two-stage model was found to be more accurate and practical. This model as introduced by Cossu et al. [1996], states that gas generation rate increases and then decreases as formulated by the following pair of equations respectively: G = (Ge / 2) exp (-k1(th– t))
(4)
L = (Ge / 2) exp (-k2(t –th))
(5)
where; G and L are the volumes of gas produced prior to time th and after th respectively, k1 and k2 are decay constants and th is the time for half of total gas production to occur. Water is lost partly in anaerobic waste decomposition and partly as vapour within which gas is usually saturated [Tchobanoglous, 1993]. Cossu et al. [1996] introduced the following well known chemical reaction for waste decomposition: 4a − b − 2c + 3d H2 O → (6) 4 4a + b − 2c − 3d 4a − b + 2c + 3d CH 4 + CO2 + dNH 3 8 8
Ca Hb Oc N d +
Moisture content of the waste in excess of FC can be considered the main leachate generating component. The method presented by
(1)
Using Equation 6, the amount of water consumed per unit weight of MSW ( Ca Hb Oc N d ) will be:
MSW using a correction factor (cf) [Blight et al., 1996]:
kgH 2 O (4a − b − 2c + 3d ) * (18 4) * 1000 = kgMSW 12a + b + 16c + 14d
Ea = cf*Ep
(7)
If G or L representing the rate of gas production are taken into account, then water consumption will be:
W1 =
(4a − b − 2c + 3d ) *(18 4) * 1000 (12a + b + 16c + 14d )Ge
(9a)
W2 = W1* L
(9b)
D(t+∆t) = D(t)-L*d
(13)
2
where A (m ) is the surface area of waste receiving rainfall and subject to evaporation.
It is important to note that dry weight of MSW decreases as the gas production initiates. Therefore the dry weight at any given time can be determined by subtracting the mass of gas produced from dry weight of previous time step (Equation 10). D(t+∆t) = D(t)-G*d
where Ea and Ep are the actual and pan evaporations (mm) respectively. Thus the overall mass of water (kg) entering/leaving the landfill will be: W4 = (Pe – Ea)A
(8)
where W1 is the mass of water consumed per cubic meters of gas produced and a, b, c and d can be determined if chemical analysis of MSW is available. At any given time the amount of water consumed (W2) will be: W2 = W1* G
(12)
2.5. Modelling procedure The term “cell” used hereafter is referred to the space filled with MSW in H/h days. A single cell water balance is provided for any desired period of time, considering three distinct components; (1) moisture content in excess of FC, (2) water consumed in gas generation and water lost as gas saturated vapour and (3) water entering/leaving the landfill due to infiltration and evaporation. Leachate generated as a result of changes in moisture content and FC at any given time can be determined for each cell using the following equation:
LC (t ) = FC (t − ∆t )[ D − G FC (t )[ D − G (t ) * d ]
(10a)
cell
−
(10b)
where d is the overall gas density. Gas generation initiates months after land filling, therefore a lag phase should be taken into account. Lag phase is reported to vary from a few weeks and months to 1 year and more from one landfill to another [Cossu et al., 1996].
cell
cell
cell
(t − ∆t ) * d ]
(14)
gcell
where LC is the leachate generated at time t for a single cell, as a result of moisture content changes and the decrease in dry weight due to degradation of waste and gas generation.
The simplest method of determining the amount of rainfall associated infiltration is to employ run-off coefficient as follows:
Water consumed in gas generation was introduced (Equation 9a and 9b). The amount of water lost as vapour during gas generation, can be assumed to be about 0.01 kg per cubic meters of gas produced [Tchobanoglous, 1993]. Therefore the total amount of water lost through waste degradation process can be determined as follows:
Pe = (1 – c)P
WG
2.4. Precipitation and evaporation
(11)
cell
( t ) = W 2cell (t ) + 0.01d G cell ( t )
(15)
where Pe is the effective precipitation (mm), P is the total precipitation (mm) and c is the run-off coefficient. Other complicated methods are also available [Safari, 1999], which require more detailed information on the physical characteristics of the cover material and surface water drainage system. Since Kahrizak landfill lacks any sort of surface water drainage system, Equation 11 was considered more practical.
The overall leachate quantity at time t for a single cell excluding infiltration/evaporation will be:
Evaporation also can be obtained from climate data sets and corrected for application to soil and
LCT (t + n∆t ) =
484
LC (t ) = FC (t − ∆t )[ D − G (t − ∆t ) * d ] (16) − FC ( t )[ D − G ( t ) * d ] + WG ( t ) cell
cell
cell
cell
gcell
cell
The accumulative amount of leachate as the operation progresses can be determined through superposition of the results of Equation 16: ncell
∑ LC(i ,(n − i + 1) ∆t ) i =1
(17)
where n counts the time steps, ncell is the number of cells to be waste filled. Infiltration and evaporation are independent from land filling operation and therefore are present throughout the modelling time. Therefore the resultant infiltration (Equation 13) must be added to LCT separately:
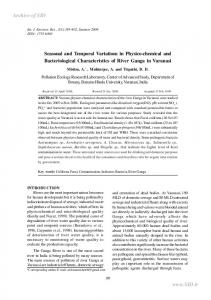
Gas generation is assumed to initiate after 6 (i.e. 180 days) months of land filling with the following characteristics: Waste chemical composition:
No data is available for FC at the site. Estimation of initial FC and its variation is a crucial task in modelling leachate quantity. Therefore as an example a somewhat inverse approach was employed to determine the primary leachate quantity compared to the value reported by OWRC, resulting in an initial FC value of about 0.55. This initial FC was assumed to decrease to 0.2 linearly during 12 months (i.e. 720 days) and remain constant afterwards. Clearly to validate the proposed model a series of long-term field measurements must be performed so as to obtain reliable values of FC and the related variations. A trench depth of 20 m was assumed to be waste filled with 2 m high daily cells within a 6 months (i.e. 180 days) operating trench. 3.1. Single cell leachate The single cell of waste in this case example consists of 10 daily cells (i.e. 20m/2m), resulting
485
Water lost as gas saturating vapour: 0.01 kg per m3 of gas Figure 1 shows the gas generation trend based on the above assumptions for 3 years (i.e. 1080 days).
970
1050
890
810
1.60E+07 1.40E+07 1.20E+07 1.00E+07 8.00E+06 6.00E+06 4.00E+06 2.00E+06 0.00E+00 730
The range of variation in moisture content of the waste is about 40% to 44% depending on the season of the year. Values of other parameters are reported as single shut estimates followed by no consistent field measurements (if any).
Water consumption: 0.1 kg per m3 of gas (8)
490
Total Organic Carbon (TOC): 35% by weight
d = 1.2 kg/m3
410
Density of the waste at landfill site: 800 kg/3
th= 1.5 years (i.e. 540 days)
330
Density of fresh waste: 500 kg/m3
50
K2= 1.083 year-1
250
Moisture content: 42% by weight
111
K1=6.14 year-1
90
Tehran produces about 6500 tons of MSW per day, all transferred to Kahrizak landfill site. The main characteristics of the waste are as follows [BC Berlin Consultants, 1996]:
68
Ge=26773000 m3
170
3.1. Waste characteristics
C H O N
Average temperature: 25 ˚C
10
Here an attempt was made to estimate the amount of leachate generated at Kahrizak landfill site as an example of model application. Part of the key parameters such as physical and some chemical characteristics of the waste and climate data were provided by OWRC, while parameters such as FC and its variations as well as gas generation data were assumed by the authors.
Volume of biogas (Cubic Meters)
CASE EXAMPLE
650
i =1
(18)
570
ncell
LCT (t + n∆t ) = W 4 + ∑ LC (i ,(n − i + 1) ∆t )
3.
in a ∆t of 10 days. The waste pile will have a surface area of 4062.5 m2, based on a 800 kg/m3 waste density. The primary source of leachate is the moisture content amounting to 2730000 kg (i.e. 6500,000 kg*0.42). The initial dry weight of MSW is 3770000 kg.
Time (days)
Figure 1. Temporal pattern of biogas generation for a single cell Water consumed in gas generation process for a single cell is shown in Figure 2. The modelling time was considered to be 2 years (i.e. 720 days). Clearly, the water lost as gas saturating vapour will follow the same pattern but 10 times smaller in magnitude. Slight changes in dry weight of MSW will start to appear at the first stages of gas generation. After quite some time, the rate of dry weight decrease will be much faster as shown in Figure 3. Using equation 16, the amount of leachate generated within a single cell can be estimated excluding infiltration/evaporation (Figure 4). As shown in Figure 4, the quantity of generated leachate is shown in m3/day assuming a uniform distribution of leachate discharge during one time interval.
1000000 500000 670
100 0 Time (months) Precipitation
Pan Evaporation
Figure 5. Five year average monthly precipitation and evaporation data.
0 -10 -20 -30 -40 710
610
510
-50 410
700 600 500 400 300 200 100 0
10
310
Effective infiltration/evaporation (kg)
Figure 3. Changes in dry eight of MSW due to waste degradation.
210
Time (days)
110
710
660
610
560
510
460
410
360
310
260
210
160
110
60
200
As shown in Figure 5, evaporation is orders of magnitude greater than precipitation during 8 months of the year. Clearly it is the evaporation (i.e. water loss) not precipitation (i.e. water infiltration) that affects the water balance substantially. Figure 6 shows the effective infiltration/evaporation determined using Equation 13.
40000000 35000000 30000000 25000000 20000000 15000000 10000000 5000000 0 10
Figure 6. Water gain/loss due to infiltration/evaporation, during the single cell modelling time.
486
700 600 500 400 300 200 100 710
610
510
410
0 310
The cover material at Kahrizak landfill site mainly consists of construction and demolition waste, although clayey soil of the site is also used for covering the disposed waste. The slope of cover is less than 2% and a relatively low permeability cover is obtained. Based on this information a runoff coefficient of 0.5 seems to be reasonable [Blakey, 1996]. Since no data were available on the evaporation correction factor, the amount of actual evaporation from soil surface was assumed to be 70% of the values recorded as pan evaporation [Blight et al. 1996]. Figure 5 shows the average monthly precipitation and pan evaporation during one year. It is worth noting that the same data is applied for the rest of modelling time (i.e. greater than one year).
210
Figure 4. Estimated leachate quantity for a single cell excluding infiltration/evaporation.
As a final step, the amount of water entering and/or leaving the landfill as a result of infiltration/evaporation should be added to the estimated leachate quantity. The result is shown in Figure 7.
110
Time (days)
10
710
610
510
410
310
210
110
10
Time (days)
Leachate quantity (m^3/day)
Dry weight of MSW (kg)
Figure 2. Volume of water consumed in gas generation versus time.A five years average monthly precipitation and evaporation data were taken into account, and distributed uniformly throughout each corresponding time interval.
300
10
610
550
490
430
370
310
250
190
70
130
0
400
1 2 3 4 5 6 7 8 9 10 11 12
1500000
Time (days)
Estimated leachate quantit (m^3/day)
500
Precipitation / Evaporation (mm)
2000000
10
Water consumed in gas generation (kg)
2500000
Time (days)
Figure 7. Leachate quantity estimated for a single cell including infiltration/evaporation. 3.2. Accumulative leachate generation
1400 1200 1000
600 400 200
810
710
610
510
410
310
210
110
0 Time (days)
Figure 8. Accumulative leachate generation for a six month operating trench at Kahrizak landfill site. As shown in Figure 8, a six months operating trench can generate leachate for about 2.5 years after the land filling is initiated. The irregularity in leachate production with time might be associated with the relatively large time interval as well as cell dimensions. Also the starting month/season for trench operation taken as the starting time of modelling can significantly affect leachate production pattern considering the coincidence of primary leachate production (as the main part of the total leachate) with high evaporation during dry season or with infiltration occurring in wet seasons. Unfortunately no data is available on field measurements of leachate quantity at any existing landfill in Iran, making the comparison of the results impossible at present. 4.
be determined through extensive measurements and monitoring.
CONCLUSIONS
Relatively high moisture content of MSW disposed of at Kahrizak landfill site was considered the key leachate generating component. The site, which is located in a semi-arid region, faces relatively high evaporation exceeding the low amount of precipitation most of the year. The method of modelling leachate generation presented in this paper was constructed based on a conceptual approach to the problem. This model, despite those introduced in the literature, takes into account the changes in the field capacity of the waste and the water loss due to biochemical reactions. The approach seems applicable to Kahrizak landfill site and similar landfills in other arid and semi-arid regions of Iran. The results obtained through execution of model for Kahrizak landfill site seem to be in good agreement with the estimation made by OWRC, although a number of key parameters mainly the field capacity remain to
487
field
The proposed model, which is constructed on a conceptual basis, can be considered a first attempt to determine leachate production rate in Iran. With no data available, the results cannot be considered reliable. Further research is required especially to determine model parameters, based on which the model can then be validated. 5.
800
10
Accumulative leachate quantity (m^3/day)
The trench in this case example was assumed to receive MSW for six months. Therefore the trench consists of 18 cells as defined in this paper. The accumulative leachate generation was estimated using Equation 18. The result is shown in Figure 8.
REFERENCES
Bagchi, A., Design, construction and monitoring of landfills, John Wiley & Sons INC., chapter 3, 1994. BC Berlin Consultants, Solid waste management, greater Tehran, first intermediate report, Section 6, BC Berlin Consultants, 1996. Blakey, N. C., Model prediction of landfill leachate production, Landfilling of waste: leachate, E & FN SPON, 17-36, 1996. Blight, G. E., D. J. Hojem and J. M. Ball, Production of landfill leachate in water – deficient areas, Landfilling of waste: leachate, E & FN SPON, 35-51, 1996. Cossu, R., G. Andreottola and A. Muntoni, Modelling landfill gas production, Landfilling of waste: Biogas, E & FN SPON, 237-268, 1996. Ehrig, H. J., Prediction of landfill gas production from laboratory-scale tests, Landfilling of waste: Biogas, E & FN SPON, 269-291, 1996. Rhyner, C. R., J. S., Leander, R. B. Wenger and M. G., Kohrell, Waste management and resource recovery, CRC, Lewis Publishers, Chapter 9, 1995. Safari, E., Hydraulics of drainage systems of landfill final cover and its application to arid regions of Iran, Proceedings of The second Hydraulics conference, Iran University of Science and Technology, 367-374, 1999. Shroeder, P. R., T. S. Dozier, P. A. Zappi, B. M. McEnroe, J. W. Sjostrom and R. L. Peyton, The Hydrologic Evaluation of Landfill Performance (HELP) Model: Engineering Documentation for Version 3, EPA/600/R94/168b, U.S. Environmental Protection Agency, Office of Research and Development, Washington DC. Tchobanoglous G., H. Theisen and S. A. Vigil, Integrated solid waste management, McGraw-Hill International editions, 1993.