intentions for professional business services in a causal path framework. Specifically, we hypothesize that perceived value and satisfaction are important.
IJSIM 8,5
414
Modelling the relationship between perceived value, satisfaction and repurchase intentions in a business-tobusiness, services context: an empirical examination Paul G. Patterson School of Marketing, University of New South Wales, Sydney, Australia, and
Richard A. Spreng Department of Marketing and Logistics, Graduate School of Management, Michigan State University, East Lansing, Michigan, USA
International Journal of Service Industry Management, Vol. 8 No. 5, 1997, pp. 414-434. © MCB University Press, 0956-4233
Introduction Among the many issues of prime interest to marketing scholars and practitioners alike are customers’ perceptions of value and satisfaction. These concepts are particularly important as they are linked to market share, relationship marketing and future (re)purchase intentions. The role of value is of major and increasing concern to consumers and marketers (Dodds, 1991), and one of the most powerful forces in today’s marketplace (Albrecht, 1992; Buzzell and Gale, 1987) it is “emerging as the strategic imperative” for the 1990s (Vantrappen, 1992, p. 53). From the consumer’s viewpoint, obtaining value is a fundamental purchase goal and pivotal to all successful exchange transactions (Holbrook, 1994). However, little empirical research has been conducted on buyers’ perceptions of value in either consumer or industrial settings. On the other hand, many scholars have investigated the nature and antecedents of customer satisfaction in a range of consumer goods and service contexts (Churchill and Surprenant, 1983; Danaher and Mattsson, 1994; Halstead et al., 1994; Johnson, 1995; Liljander, 1994; Oliver, 1980; Patterson 1993; Spreng et al., 1996) although empirical models of satisfaction in industrial or business-tobusiness settings are rare. Apart from the obvious importance from a consumer’s perspective, perceived value is of significance to marketing scholars since it may alter the direction (satisfied/dissatisfied) and the degree or intensity of satisfaction/dissatisfaction experienced (Spreng et al., 1993). However the exact nature of the relationship between perceived value, satisfaction and repurchase intentions has not to date been specified.
Perceived value is frequently conceptualized as involving a consumer’s assessment of the ratio of perceived benefits and perceived costs (Liljander and Strandvik, 1992; Monroe, 1990; Zeithaml, 1988). While it is important to understand how value interacts with other key constructs in a macro sense, academics and managers are also vitally interested in the relative impact of individual performance attributes (benefits) on consumers’ value perceptions. This aspect has not been investigated to date and is one of the contributions of this study. The purpose of this study therefore, is first, to investigate empirically the nature of the relationships between value, satisfaction and repeat purchase intentions for professional business services in a causal path framework. Specifically, we hypothesize that perceived value and satisfaction are important antecedents of repurchase intentions. In addition, most studies modelling the impact of perceived performance on satisfaction or behavioural intentions have done so at the aggregate construct level, despite the fact that examining the effect of individual dimensions of performance attributes has potentially great utility for practising managers. Therefore the second objective is to delineate the number and nature of dimensions of perceived performance. The third aim is to assess the relative impact of each service performance dimension on both perceived value and satisfaction. The current study The current study therefore extends the body of literature concerning value, satisfaction and post-purchase behaviour, and focuses on an important but neglected area i.e., professional business services. In particular a range of management consulting services (MCS) (marketing, marketing research, HRM, strategic planning, information technology, logistics, and financial planning) considered typical in nature of many business professional services (e.g., engineering, enviromental consulting, project management, legal, architectural) was examined. The industry is significant as more organizations turn to outsourcing, and is forecast to be worth $200 billion worldwide by the year 2000 (Markels, 1996). In this highly competitive industry where projects are mostly of a discrete nature (as opposed to a continuous service such as telephone services, or long term contracts with an audit firm for example), suppliers are highly expendable and vulnerable to clients’ whims as well as economic downturns. Hence delivered value and customer satisfaction are considered critical to establishing longer-term client relationships and winning repeat business. The next section briefly reviews the literature on value, satisfaction and repeat purchase intentions, presents a conceptual path model, and then concludes with seven hypotheses to be empirically tested. This is followed by an outline of the research method, an analysis of the data with its accompanying discussion, conclusions and implications for future research.
Satisfaction, value and repurchase 415
IJSIM 8,5
416
Conceptual model Perceived value The significance of service quality and customer satisfaction has been widely discussed in the literature (Bloemer and deRuyter, 1995; Grönroos, 1984; 1988; Gummesson, 1993; Parasuraman et al., 1985; 1988; Patterson and Johnson, 1993). It is only recently however that both managers and marketing scientists have begun focusing on the hitherto ignored role of consumer value as a key strategic variable to help explain repeat purchase behaviour, brand loyalty and relationship commitment. Value however is an abstract concept with meanings that vary according to context (Sweeney, 1994). In economics for example value is equated with utility or desirability, in the social sciences it is understood in the context of human values such as the instrumental and terminal values suggested by Rokeach (1973), while in industrial settings value engineering refers to processes designed to reduce costs while maintaining standards. In marketing however, value is typically defined from the consumer’s perspective. The most common definition of value in the marketing literature is as a ratio or trade-off of total benefits received to total sacrifices (Buzzell and Gale, 1987; Monroe, 1979; 1990; Monroe and Krishnan, 1985, Sweeney, 1994), while Sawyer and Dickson (1984) conceptualized value as a comparison of weighted “get” attributes to “give” attributes. Perceptions of value however are not limited to the functional aspects but may include social, emotional and even epistemic value components (Sheth et al., 1991). Nonetheless the most popular conceptualization in marketing, and the one employed in this study, is a functional one, defining value in terms of performance (quality) and price. Interestingly, the major works modelling value have invariably done so in a consumer and/or retailing context (Baker, 1990; Dodds and Monroe, 1985; Dodds et al., 1991; Sweeney, 1994) and used willingness to buy (purchase intentions) as a key consequence of value perceptions. Only Bolton and Drew (1991) link repeat purchase intentions (as opposed to willingness to buy) to value in their study of a continuous service (telephone services). The key premise underlying all these studies is that value is the key linkage between the cognitive elements of perceived quality or performance, perceived monetary sacrifice and behavioural intentions. The need for a measure beyond product performance that relates to price or other sacrifices, and influences intentions was first acknowledged by Stokes (1985) and Olshavsky (1985). As pointed out by Bolton and Drew (1991) perceived value is a “richer measure of customers’ overall evaluation of a service than perceived service quality”. All the above studies explicitly model perceived performance or quality as a direct antecedent of value, which in turn is a direct driver of purchase/ repurchase intentions. However (with the exception of Bolton and Drew – although they did not actually measure repurchase intentions), not one of these studies investigated the role satisfaction with past purchases might play in tandem with value and intentions. An explanation for this is that models of value in a pre-consumption situation are likely to differ significantly from models of value perception following purchase. In the post-purchase situation,
the consumer has experience, and is thus familiar with the product/brand evaluation is therefore less influenced by extrinsic cues such as store name and ambience, brand image or marketer communication (Sweeney, 1994). Furthermore, post-purchase, the consumer, having first hand experience with the product, is able to form satisfaction/dissatisfaction evaluations – but not in the pre-purchase situation The current study captures value perceptions, satisfaction and repeat purchase intentions a short time following purchase. The significance of service quality and customer satisfaction has been widely discussed in the literature (Bloemer and deRuyter, 1995; Cronin and Taylor, 1992; Grönroos, 1984; 1988; Gummesson, 1993; Kunst and Lemmink, 1995; Liljander and Strandvik, 1995; Parasuraman et al., 1985; 1988; Patterson and Johnson, 1993). It is only recently, however, that both managers and marketing scientists have begun focusing on the hitherto ignored role of consumer value as a key strategic variable to help explain repeat purchase behaviour, brand loyalty and relationship commitment. Value, however, is an abstract concept with meanings that vary according to context (Sweeney, 1994). In economics for example value is equated with utility or desirability, in the social sciences it is understood in the context of human values such as the instrumental and terminal values suggested by Rokeach (1973), while in industrial settings value engineering refers to processes designed to reduce costs while maintaining standards. In marketing, however, value is typically defined from the consumer’s perspective. The most common definition of value in the marketing literature is as a ratio or trade-off of total benefits received to total sacrifices (Buzzell and Gale, 1987; Monroe, 1979; 1990; Monroe and Krishnan, 1985; Sweeney, 1994), while Sawyer and Dickson (1984) conceptualized value as a comparison of weighted “get” attributes to “give” attributes. Perceptions of value however are not limited to the functional aspects but may include social, emotional and even epistemic value components (Sheth et al., 1991). Nonetheless, the most popular conceptualization in marketing, and the one employed in this study, is a functional one, defining value in terms of performance (quality) and price (a sacrifice). The major works modelling value have invariably done so in a consumer and/or retailing context (Baker, 1990; Dodds and Monroe, 1985; Dodds et al., 1991; Liljander, 1994; Sweeney, 1994) and have used willingness to buy (prepurchase intentions) as a key consequence of value perceptions (see Bolton and Drew, 1991, who use re-purchase intentions, for an exception). Pre-purchase, consumers may refrain from purchasing a product if the price (a key sacrifice) is outside their range or the price signals that the quality is inferior. Of course it stands to reason that if the price is unacceptable then the offer must have little, if any, net perceived value (Dodds et al., 1991). Therefore, it is understandable that, in a pre-purchase situation, perception of value might directly influence willingness to buy, such as depicted in models of Dodds et al. (1991), Sweeney (1994) and Zeithaml (1988). However, the impact of value on re-purchase intentions is not as clear, partially because consumers now have first-hand experience and familiarity on
Satisfaction, value and repurchase 417
IJSIM 8,5
418
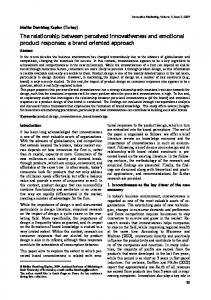
which to base satisfaction evaluations, and satisfaction will have an influence on re-purchase intentions. While the impact of satisfaction on intentions has been well documented (see section on satisfaction below), the role of value in post-purchase processing has not. Yet the need for a measure beyond product performance that relates to price or other sacrifices, and influences intentions was first acknowledged by Stokes (1985) and Olshavsky (1985). As pointed out by Bolton and Drew (1991) perceived value is a “richer, more comprehensive measure of customers’ overall evaluation of a service than service quality” (p. 383). Thus, the basic premise here is that value is one of the key linkages between the cognitive elements of perceived quality or performance and behavioural intentions, primarily because it incorporates perceived monetary sacrifice. Assuming that the sacrifice (cost) component of value is held constant, the above suggests that: H1a: Perceived performance will be positively associated with value. H1b: Value will be positively associated with repurchase intentions. H2a: Each perceived performance dimension will be positively associated with satisfaction. Satisfaction is a consumer’s post-purchase evaluation and affective response to the overall product or service experience (Oliver, 1992). Emotions – a key affect component, are known to be associated with intense states of arousal that lead to focused attention on specific targets and may therefore impact ongoing behaviour. Allen et al. (1992) have demonstrated that emotions act as a better predictor of behaviour than do cognitive evaluations. Further, past research has indicated that satisfaction is a reliable predictor of repurchase intentions (Bitner, 1990; LaBarbera and Mazursky, 1983; Patterson, 1995). Thus, the proposed model (Figure 1) shows satisfaction is an antecedent to repurchase intentions. Therefore: H2b: Satisfaction will be positively associated with re-purchase intentions. Performance 1 (+) (+) (+)
P2
Satisfaction (+)
(+) (+)
Intentions
(+) Value
Figure 1. The conceptual model
(+) Pn
(+)
The link between performance dimensions and customer satisfaction Satisfaction typically modelled as a function of prior expectations or desires (or some other standard), perceived performance and disconfirmation of the standard expectations (Cadotte, et al., 1987; Churchill and Surprenant, 1982; Liljander and Strandvik, 1993; Oliver, 1980; Spreng et al., 1996). As discussed oreviously for value, several studies have also shown perceived performance to have a direct impact on satisfaction (as well as an indirect one via disconfirmation) (Churchill and Surprenant, 1982; Cronin and Taylor, 1992; Patterson, 1993) especially in the case of high involvement products and services. It has been argued that high involvement decreases consumers’ sensitivity to pre-usage phenomena (e.g., expectations) but increases sensitivity to the outcome. Given the high involvement and risky nature of commissioning consultants, plus the fact that we did not measure disconfirmation in this study, it can be expected that each performance attribute/dimension will be positively, directly related to satisfaction. Past research has indicated that satisfaction is a reliable predictor of repurchase intentions (Bitner, 1990; LaBarbera and Mazursky, 1983; Patterson, 19954). Thus, the proposed model shows that satisfaction is an antecedent to repurchase intentions. Therefore: H3: Each performance dimension will be positively associated with value. Swan and Combs (1976) suggested perceived performance comprised two subcomponents, instrumental and expressive performance. Sasser et al. (1978) then alluded to three possible categories of service performance (levels of material, facilities and personnel performance). Both studies implied service performance involves more than simply an outcome dimension; it also includes the way or manner in which the service is delivered during interactions between provider and consumer. In a similar vein to the instrumental and expressive dimensions, Grönroos (1984) argued that service performance should be conceptualized as comprising technical (“what” is delivered) and functional quality (“how” the service is delivered during the service encounter). Later Parasuraman et al. (1985), in developing their SERVQUAL instrument, referred to these two dimensions as the service “outcome” and “processes”. Numerous studies in both the satisfaction and service quality literatures, while disagreeing on the exact number of specific dimensions, have confirmed this useful dichotomy, which transcends industry types. One of the aims of the current study was to extract the multiple, specific attributes or dimensions used by clients of professional business services to evaluate the service. The results of the specific attributes/dimensions extracted via qualitative interviews and confirmatory factor analysis are detailed in the results section. Limited empirical work to date shows that the technical (outcome) dimension or delivery of the service promise, has a greater impact on satisfaction and service quality assessments than functional (process) dimensions (HaywoodFarmer and Stuart, 1988; Parasuraman et al., 1988; Strandvik and Liljander, 1995) except in the case of a service failure and subsequent recovery effort (Spreng et al., 1995). Halinen (1994) however produced an opposite finding when
Satisfaction, value and repurchase 419
IJSIM 8,5
420
studying clients of advertising agencies (possibly due to the difficulty of assessing advertising effectiveness) when she concluded that the process was more important than the outcome. Furthermore, our qualitative interviews probing the nature of the benefits clients expected to receive, strongly indicated that clients primarily stressed the technical (outcome) dimension. “We expect them to come up with ways to cuts costs…” (cost reduction study) and “The solutions will need to be implementable” (development of a strategic marketing plan) and “We require them to develop realistic ways to improve our productivity and profitability …” (value chain and operations analysis) were typical of sentiments expressed. While at times clients mentioned the necessity of establishing a good working relationship, and that the consultant must be reliable and prompt, clients’ overriding concern and emphasis was on the technical (outcome) performance dimension. Accordingly, hypothesis 4 is: H4: The technical (outcome) dimension of perceived performance willth have a greater impact on overall satisfaction than any of the functional (process) dimensions for professional business services. Perceived value was defined as a function of multiple benefits and sacrifices. In this study we measured the consultant’s performance – i.e., client’s assessment of the benefits, but did not attempt to capture the individual sacrifice components of value. As will be noted in the results section, a confirmatory factor analysis showed the consultant’s performance (benefits) is grouped into six underlying dimensions – one of which we label the “outcome” (i.e., the technical dimension), and the remaining five (labelled “service”, “relationship”, “methodology”, “problem identification” and “global networks”) are consistent with Grönroos’ (1982) functional dimensions. In line with the arguments put forth for satisfaction, we expect the technical (outcome) dimension to have more significant predictive power in explaining value than any of the five functional dimensions of performance. Accordingly: H5: The technical dimension of perceived performance will have a greater impact on perceived value than any of the functional dimensions for professional business services. The relationship between value and satisfaction Existing models of satisfaction have rarely addressed the role of perceived value (see Liljander, 1994 and Liljander and Strandvik, 1995 for exceptions). While most satisfaction models incorporate benefits (via a measure of performance), they ignore any sacrifice component. Shortcomings in benefits (such as failure to meet deadlines, achieve the extent of cost reductions, or achieve precisely the desired advertising response) may be offset by perceived reductions in sacrifices (e.g., price) such that the client may still be satisfied (Spreng et al., 1993). As alluded to earlier, value thus captures this sacrifice component. Furthermore, value is conceptualized to encompass both the functional benefits of performance as well as non-functional benefits (such as the social value or reduced risk associated with working with an internationally
renowned consulting group, or perhaps the knowledge that if the recommended course of action does not succeed “we can always blame the consultant”). Finally, value is considered a cognitive-based construct which captures any benefit-sacrifice discrepancy in much the same way disconfirmation does for variations between expectations and perceived performance. Satisfaction on the other hand is primarily an affective evaluative response (Hunt, 1993; Oliver, 1992). Seminal work in the social sciences (e.g., Ellis, 1962; Weiner, 1986) points out that it is cognitive thought processes that trigger affective responses. Emotions are associated with intense states of arousal that lead to focused attention on specific targets and may impact ongoing behaviour. Allen et al. (1992) have demonstrated that emotions act as a better predictor of behaviour than do cognitive evaluations, while in line with this discussion, Strandvik and Liljander (1994), and Spreng et al. (1993) argued that value should be a direct antecedent of satisfaction. Hence we hypothesize: H6: Value perceptions will be a positive, direct antecedent of satisfaction. Antecedents of repurchase intentions Perceptions of value may be formed either pre or post-purchase (or both). Prepurchase, consumers may refrain from purchasing a product if the price (a key sacrifice) is outside their range or the price signals that the quality is inferior. Of course it stands to reason that if the price is unacceptable then the offer must have little, if any, net perceived value (Dodds et al., 1991). Therefore prepurchase, it is understandable that perception of value might directly influence willingness to buy, such as depicted in models of Dodds et al. (1991), Sweeney (1994) and Zeithaml (1988). Post-purchase, it is a different matter however, because consumers now have first-hand experience and familiarity on which to base satisfaction evaluations. Satisfaction in turn has been shown in a number of works to be a reliable predictor of repurchase intentions (Bitner, 1990; LaBarbera and Mazursky, 1983; Patterson, 1994). In the case of intangible business services, high in credence properties (such as MCS), it is often intrinsically difficult for clients to assess performance quality before purchase and consumption. Post-purchase however, high satisfaction with past work of a consultant is a means of reducing risk and decision uncertainty, and economising on search effort. In line with these arguments and those put forward in the previous section, we propose hypotheses 7a and b: H7a: Value will be completely mediated via satisfaction and only indirectly influence repurchase intentions. H7b: Satisfaction will be the sole direct antecedent of repurchase intentions for professional business services. Methodology To develop the questionnaire, qualitative research was conducted with senior managers of four consultancy firms and eight client organizations. Key questions were examined by two academics skilled in questionnaire design and
Satisfaction, value and repurchase 421
IJSIM 8,5
422
familiar with the consulting industry, one consultant and two clients, in order to establish face validity. The questionnaire was then developed, pre-tested and administered. Sampling frame and sampling method Three consultancy firms and one heavy user of consultants provided the sampling frame for the study. These organizations included an international, multi-disciplinary consultancy; two smaller regional consultancies; and one client organization (a state government that was an extensive user of consultants). Therefore, the sampling frame was comprised of private and public sector clients, larger and smaller assignments, and covered a wide spectrum of consultancy engagements, such as corporate planning, information technology, marketing research, organizational reviews, and operations management. Of the 207 Australian client organizations approached, 128 returned completed questionnaires and met the screening requirements (see below) which represents a net response rate of 62 per cent. Unit of analysis A single key informant approach was used to collect data for a number of reasons. First, the informant was generally a senior executive or senior manager who was involved in the consultant selection process and involved in the assignment from start to finish. Second, a key informant is appropriate where this person occupies a senior or ownership position, since he or she is direct participant in the organization’s boundary spanning activities, and thus qualified to respond on behalf of the organization (Pennings, 1979). For example, Philips (1981) found high level managers provide more reliable information on organizational phenomena than lower ranking managers. Finally, an important advantage of the key informant design is that it enables respondents to remain anonymous, thus encouraging candid responses (Kohli, 1989). In order to ensure the key informant was qualified to respond on behalf of the organization, two screening criteria were employed to assess the appropriateness of the respondent. First, only respondents who were involved in at least four of the six key decision stages in selecting a consultant were included in the sample. These decision stages were: (1) identified existence of the problem; (2) determined if problem should be handled internally or externally; (3) identified possible consultants; (4) involved in information search concerning possible consultants; (5) involved in short listing consultants; and (6) involved in the final selection of consultant.
Thus, respondents had significant involvement in the selection of the consultant. Second, respondents were asked how representative their feelings of (dis)satisfaction were among other buying centre members. Only three respondents reported their views being at variance with the buying group. However, if they were in a senior management position and involved with at least four of the decision stages (including the final consultant selection stage), they were retained in the sample. Two completed questionnaires were rejected because the key informant failed to meet these screening criteria. Data collection procedure The key informant was first contacted by telephone seeking their cooperation to participate in the study. If they agreed to participate they were mailed a package containing a cover letter, a questionnaire and a self-addressed pre-paid envelope to facilitate a reply. The cover letter explained the nature and importance of the study and offered a summary report of the findings upon completion of the study. If responses were not received within three weeks then a telephone follow-up was undertaken. Measures The qualitative research phase and examination of proprietory research in the industry indicated there were six dimensions of performance for management consulting services. These dimensions were: (1) problem identification; (2) outcome of the project; (3) methodology used; (4) relationship with the consultancy firm; (5) level of services provided; and (6) global competence. Fourteen attribute items were developed to capture performance, and were measured within 1-2 months after assignment completion by asking respondents to assess how the consultancy firm performed on seven-point Likert scales. Several scholars have stressed the need to weight determinants of satisfaction by their importance to reflect the fact that “not all facets are of equal importance to all people” (Czepiel and Rosenberg, 1977, p. 408; LaTour and Peat, 1979; Patterson, 1993; Sawyer and Dickson, 1984). Accordingly weighted performance dimensions were used in the subsequent analysis. The importance weights for each dimension were assessed by asking respondents to complete a constant-sum importance scale. Subjects allocated 100 points over the dimensions. Satisfaction was operationalized by three items based on measures commonly used in satisfaction research, using one seven-point Likert scale and two sevenpoint bipolar adjective scales (e.g., Oliver and Swan, 1989; see Table I for measures).
Satisfaction, value and repurchase 423
IJSIM 8,5
424
Qualitative interviews suggested that in the case of business services at least, value was being defined in terms of functional benefits versus monetary costs. “We expect results we can implement” and “They charge enough. We expect them to perform and come up with workable solutions” were typical of the views expressed by clients. This, and the nature of industrial services suggests that social and emotional value components may not be as relevant in an industrial or business-to-business context as they might be in a consumer purchase. We have therefore adopted a functional definition of value which was measured with a single item that stated “Considering the fee we paid and what the consultant delivered, overall I believe we received fair value for money”[1]. Behavioural intentions was measured on three seven-point bipolar adjective scales (Fishbein and Ajzen, 1975; Oliver and Swan, 1989; see Table I for measures). Results The analysis was conducted according to the following procedure. First, confirmatory factor analysis was conducted on the indicators for the six performance latent constructs and the indicators for value, satisfaction, and repurchase intentions construct. After refinement, a final CFA model was estimated that demonstrated good measurement properties. Second, each performance dimension was represented (for each subject) as an average of its measures, and this index was multiplied by the subject’s importance rating for that dimension (Czepiel and Rosenberg, 1977; LaTour and Peat, 1979; Patterson, 1993). These weighted performance dimensions were used in testing the overall structural model. The relative impacts of the six performance dimensions on Value and Satisfaction were then investigated. Finally, a series of chi-square difference tests was conducted to assess whether the proposed mediation was complete or partial. Each of these steps is now detailed below. Confirmatory factor analysis The confirmatory factor analysis was conducted using LISREL 8 (Jöreskog and Sörbom, 1993) and, after refinement, showed that the hypothesized model fit the data reasonably well (see Table I). The overall fit of the model was adequate: the Jöreskog and Sörbom (1993) GFI was 0.86, and the CFI (Bentler, 1990) CFI was 0.97; only four (2 per cent) of the standardized residuals were over the absolute value of (largest positive standardized residual was 3.36 and largest negative standardized residual was –3.45); and the chi-square was 242.24 with 155 degrees of freedom. Second, as evidence of convergent validity, the measurement factor loadings were all significant (t-values between 9.02 and 15.94), the construct reliabilities were large (ranging from 0.82 to 0.97), and the average variance extracted (Fornell and Larcker, 1981) indicated that in each case the variance captured by the construct was greater than the variance due to measurement error (AVEs ranging between 0.60 and 0.93; see Table I). Finally, to test for discriminant validity, the procedure described by Fornell and
Construct
Measuresa
CSPb
Outcomes Produced results which we are able to implement Implementable Produced results which will enable us to increase effectiveness our organization’s effectiveness Method Methodology Used the most up-to-date methodologies on the assignment Innovative Used innovative ideas and solutions Creative Used some creativity in solving our problems Service Responsive Responded promptly when we contacted them Reliable Were reliable in meeting deadlines Dependable Were dependable Professional Were thoroughly professional in all they did Relationship Rapport Established a good rapport with relevant staff in our organization Relationship Developed a close working relationship with our staff Global Global Made good use of their international contacts to come up with solutions Problem identification Goals Made sure they understood our aims and goals. Problems Made sure they thoroughly understood the problem before commencing Value Value Considering the fee paid and what the consultant delivered, overall I believe we received fair value for money Satisfaction Satisfaction 1 I am very satisfied with our decision to commission this consultancy firm Taking everything into consideration, how do you feel about what you have received from the consultancy firm during the course of the assignment: Satisfaction 2 Very dissatisfied/Very satisfied Satisfaction 3 Very pleased/Very displeased (R) Intentions If your organization requires the services of a management consulting firm in the near future, for a similar type of assignment, would you use the same consulting firm? Intentions 1 Very probable/Not probable Intentions 2 Impossible/Very possible Intentions 3 No chance/Certain
ρc
AVEd
0.86
0.76
0.82
0.60
0.90
0.70
0.83 0.91
0.78 0.80 0.73 0.78 0.75 0.95 0.86
Satisfaction, value and repurchase 425
0.95 0.90
0.98 0.91 –
–
–
0.84 0.85
0.73
0.86 –
–
0.95
0.85
0.97
0.93
–
0.95
0.95 0.87
0.96 0.98 0.94
Notes: All measures are anchored: 1 = Strongly disagree, 7 = Strongly agree, unless otherwise specified b Completely standardized parameter. squared multiple correlations for each measure can be obtained by squaring the completely standardized parameter for the item c Construct reliability computed as (Σλ)2/[(Σλ)2 + Σ var (ε)] d Average variance extracted, which is the proportion of variance in the construct that is not due to measurement error (Fornell and Larker, 1981) a
Table I. Measures and construct reliabilities
IJSIM 8,5
Larker (1981) was used. As an indication of discriminant validity, the AVE for each construct should be higher than the squared correlation between that construct and any other construct. This test holds, since in no cases is there a squared correlation between any two constructs that is higher than either of the constructs’ AVE (Table II).
426
Structural model Given that the proposed measurement model was consistent with the data, the hypotheses were tested with LISREL 8, using the covariance matrix. Figure 2 shows the completely standardized parameters and t-values of this model. As stated above, the six performance dimensions (outcome, methodologys, services, relationship, global, and problem Identification) were operationalized for each subject as the average of the indicators, weighted by the subjects’ importance score of the dimension. Value was operationalized with a single indicator, and satisfaction and intentions were each measured with three indicators. For clarity of presentation, the exogenous construct intercorrelations (phi’s) are not shown in the figure. The fit of the model is very good, with a chi-square of 35.30 (43 df, p = 0.79), a GFI of 0.96, an AGFI of 0.91, and a CFI of 1.00. There are no standardized residuals over an absolute value of 2.00. The variation explained by the structural relationships is 55 per cent for value, 80 per cent for satisfaction, and 78 per cent for intentions. As hypothesized, the six performance dimensions each had a significant effect on value (and satisfaction) thus supporting both H1a. To test the relative effects of the performance dimensions on value and satisfaction, a series of chisquare tests were conducted. In each test, a model was estimated that constrains two paths to be equal. If the chi-square of this model is significantly worse than the chi-square of the base model (35.30), then the two paths are significantly different. For example, to test whether outcome has a stronger impact on value than does the methodology dimension of performance, these two paths were constrained to be equal; the resulting significant decrease in fit (change in χ2 of 7.93) indicated that outcome has a significantly stronger effect
Table II. Factor intercorrelations
Intent
Outcome
Outcome Method Service Relationship Global Problem ID Value Satisfaction Intention
1.00 0.63 0.70 0.37 0.17 0.62 0.79 0.87 0.66
Method Service 1.00 0.69 0.62 0.27 0.74 0.68 0.71 0.60
1.00 0.68 0.17 0.74 0.66 0.78 0.67
Relationship
1.00 0.09 0.69 0.48 0.53 0.50
Global Problem Value
1.00 0.05 0.17 0.20 0.14
1.00 0.67 0.74 0.73
1.00 0.86 0.74
Satis- Intenfaction tion
1.00 0.89
1.00
Outcomes
.34
(4.9
Sat 1
4)
Sat 2
Satisfaction, value and repurchase
Sat 3
7.
3(
.6 91
.21(3.85
)
Methodology
)
Int 1
.3
6(
.57(8.44)
9)
.1 6( 2. 76 )
Intentions
Value
)
5.49
.40(
Value
Problem Identification 1Completely
427
.4
) .17 (2 1 1 . .24(3.68)
Global
Int 3
15
Relationship
Satisfaction
) 7) .11(2.3 .16 (2. 50 ) 5) 2 . 3 ( 8 .1 .32(4 .41)
Int 2
8(
Service
40
.8
5.
standardized coefficients, t-values in parentheses. Chi-square = 35.30, 43 df.
Figure 2. Structural model
on value than does methodology. Table III shows the results of these tests, and indicates that outcome has a significantly greater effect on both value and satisfaction than any of the other performance dimensions. Methodology has a greater impact on value than does the services dimension, and problem identification has a greater effect on value than either service or global networks. Thus H4 and H5 are supported. Value was found to have a strong and significant impact on satisfaction, providing support for H6. Change in χ2
p-value
Outcomes > Methodology Outcomes > Service Outcomes > Relationship Outcomes > Global Outcomes > Problem ID
3.96 8.17 5.25 11.78 7.62
< 0.05 < 0.01 < 0.05 < 0.01 < 0.01
Outcomes > Methodology Outcomes > Service Outcomes > Relationship Outcomes > Global Outcomes > Problem ID
7.93 20.01 10.57 17.78 6.01
< 0.01 < 0.01 < 0.01 < 0.01 < 0.05
Methodology > Service
4.20
< 0.05
Problem ID > Service
5.97
< 0.05
Problem ID > Global
3.17
< 0.10
Dependent variable
Paths compared
Satisfaction
Value
Table III. Tests of the relative strengths of performance measures
IJSIM 8,5
428
While satisfaction has a significant effect on repurchase intentions, supporting H2b, the effect of value on repurchase intentions was not significant (H1b). However, looking at the bi-variate relationship between value and Intentions (Table II) shows that there is a significant correlation between them (r = 0.74, t = 18.06), indicating that the effect of value is mediated through satisfaction. To demonstrate that satisfaction completely mediates the effect of value on Intentions it is necessary to show that value has a significant direct path to intentions through satisfaction, and then this relationship becomes non-significant when the mediating variable (satisfaction) is placed in the model. Thus, the effect of value on intentions is completely mediated by satisfaction. Value was found to have a strong and significant impact on satisfaction, and satisfaction in turn has a significant effect on intentions thus providing support for H6 and H7b. Mediation tests The model shown in Figure 2 together with H7b makes a number of implicit predictions regarding mediation, in that the effects of the performance dimensions are implied to be completely mediated by value and satisfaction tests of these predictions will be presented in this section. The first prediction (H7b) is that the effect of value on intentions is completely mediated by satisfaction. To demonstrate that satisfaction completely mediates the effect of value on intentions it is necessary to show that value has a significant bi-variate relationship with intentions, and this effect is non-significant when value is linked to intentions through satisfaction. Table II shows that value and intentions have the requisite significant relationship (r = 0.74, t = 18.06). To test whether this effect is completely mediated by satisfaction, a model was estimated that freed the path between value and intentions. There was a nonsignificant decrease in chi-square (change in χ2 of 0.76, p > 0.30), and the t-value for the path coefficient was not-significant (t = 0.87). Therefore, the effect of value on intentions is completely mediated by satisfaction thus supporting H7a. The model also implies that the effects of the performance dimensions are completely mediated by value and satisfaction. To test this a direct path was estimated, one at a time, between each performance dimension and intentions. In each case, there was not a significant change in χ2. Thus, the effects of performance were completely mediated by value and satisfaction. Discussion and conclusions Our research is the first empirical effort to examine the impact of perceived value in concert with satisfaction and repeat purchase intentions in a businessto-business services context. Hence the results represent an important step forward in unravelling the intricate relationship between these three key constructs. Based on our conceptual model of the linkages between the
constructs, our results support the model and generally confirm the seven hypotheses. Unlike studies that have found perceived value to influence intentions directly (usually in a pre-purchase situation, and thus neglecting satisfaction), the findings clearly show value (as well as each performance dimension) is completely mediated through satisfaction in influencing repeat purchase behaviour. This supports earlier conceptual work of Liljander and Strandvik (1995) and Spreng et al. (1993). To date, models of satisfaction and repeat purchase behaviour have focused on the benefits of using a product or service. And in the case of satisfaction, empirical tests usually involve a comparison between expectations (or some other standard) and performance. Such models only focus on the benefits and ignore the “sacrifices” (e.g., perceived risk, financial cost) involved. Inclusion of the value construct in such models overcomes this and provides a richer portrayal of the dynamics surrounding satisfaction evaluations and intentions. Our contention is that shortcomings in service performance may be offset by perceived reductions in sacrifices such that clients receiving less than expected performance may still be satisfied. This was partly confirmed in an open ended question asking clients the reasons for their satisfaction/dissatisfaction with the completed assignment. In some 20 per cent of cases benefits were implicitly or explicitly linked to sacrifices e.g., “They went the extra mile to satisfy us” (implying this extra effort was not paid for); “They did a professional, thorough job for a modest fee”. While fee reductions could be considered as a way of increasing perceived value (and hence increasing satisfaction), the acceptable price range concept should not be ignored (Monroe, 1979). That is buyers have a price range that is acceptable for a given purchase, rather than a single price. Clients may not only refrain from purchasing when the price is too high, but also become suspicious of quality (thus enhancing perceived risk – another sacrifice) when price is too low. Next, the analysis revealed six performance dimensions which clients use to evaluate professional business services. While a number of studies have examined the dimensions of satisfaction and service quality in consumer settings (e.g., SERVQUAL), this is one of the few attempts to delineate the dimensions in a business services context. Not surprisingly these differ markedly from comparable consumer industry studies, no doubt reflecting the nature of professional, business services. The results reveal one technical dimension (labelled “outcomes”) which reflects the core or promised service – i.e., that the consultants deliver the results for which they were commissioned. The remaining five factors are all functional or process dimensions reflecting the manner in which the consultant went about delivering the technical service component. These comprised: (1) a methodology dimension (reflecting the modus operandi and creativity exhibited);
Satisfaction, value and repurchase 429
IJSIM 8,5
430
(2) a service dimension (representing the level of service provided including attributes such as reliability in meeting deadlines, responsiveness, and general professionalism displayed); (3) a relationship dimension (reflecting the rapport and relationship developed between client and service provider); (4) a global network dimension (depicting the expectation of many clients that the consultant has access to a global network of contacts and sources of information); and (5) a problem identification dimension (clients had an expectation that the consultants should take time to familarize themselves with the firms’ goals and thoroughly understand the nature of the problem before commencing any work). While the outcome factor was clearly the most significant dimension in explaining both satisfaction and value, the five process dimensions (methodology, service, relationships, global and problem identification) each have a significant impact, and are therefore considered as determinant attributes; they should thus not be ignored in marketing strategy development. If it is assumed that all major consultancy firms only employ highly qualified and experienced personnel; have access to similar information; and the latest technological tools (i.e., the technical dimension), then being superior on one or more of these five process dimensions could provide the basis for a competitive advantage. Furthermore, inexperienced clients at least, may have great difficulty evaluating the worth of the technical outcome. In such instances, more obvious and easily evaluated cues such as the relationship developed between client and individual consultants working on an assignment, or the general professionalism displayed (service dimension) may well become the criteria used in post-purchase evaluations. Thus the delineation of these six performance dimensions has both academic and managerial significance. Future studies of a similar nature should consider including financial and non-financial “sacrifice” components to explain perceived value better (the current model incorporating functional performance benefits only explains 57 per cent of the variance). Furthermore, we have operationalized value with a single item in this study. Future research is required to establish rigorous and reliable mutiple item measures of the value construct. Value is in some ways similar to the equity construct in that both are based on the premise of some ratio of outputs (benefits) to inputs (sacrifice). The difference being that equity theory (Adams, 1963) is based on the notion that the buyer will compare their output to input ratio with the vendor’s ratio. Value on the other hand assesses the benefits to sacrifices ratio only from the buyer’s side. However, the extent to which these two constructs overlap, and the relationship between and satisfaction when both are included as antecedents has yet to be examined[2]. As was alluded to earlier in this study, value may be considered both pre- and post-purchase. The extent to which pre-purchase value (based on expectations
prior to purchase) impacts upon post-purchase value perceptions has not been empirically examined. In much the same way that expectations of performance influences post-purchase perceived performance (Churchill and Surprenant, 1982; Spreng et al. 1993), value perceptions after purchase and consumption may indeed be influenced by pre-purchase perceived value (Spreng et al., 1993). We expect this influence may be particularly strong whenever benefits or sacrifices (or both) are difficult to judge, even after purchase and use – such as is the case with many “pure” business services high in credence qualities (e.g., engineering, legal, architectural, environmental consulting, in-house training courses). Notes 1. As one reviewer pointed out, value is akin to the equity construct. While there are similarities, equity is a comparison of the buyer’s benefits to sacrifices ratio with the seller’s benefits to sacrifices ratio. Value on the other hand is concerned only with the buyer’s perceptions. Furthermore, in this study we focus on price as being the only sacrifice component primarily because it surfaced as a prominent issue in our qualitative interviews. 2. We acknowledge the contribution of one anonymous reviewer for raising this issue. References Adams, J.S. (1963), “Towards an understanding of inequity”, Journal of Abnormal and Social Psychology, Vol. 67, October, pp. 422-36. Albrecht, K. (1992), “The only thing that matters”, Executive Excellence, Vol. 9, November, p. 7. Allen, C.T., Machleit, K.A. and Schultz Kleine, S. (1992), “A comparison of attitudes and emotions as predictors of behavior at diverse levels of behavioral experience”, Journal of Consumer Research, Vol. 18, March, pp. 493-504. Baker, J.A. (1990), “‘The effect of retail store environments of consumer perceptions of quality, price and value”, an unpublished doctoral dissertation, Texas A&M University. Bitner, M.J. (1990), “Evaluating service encounters: the effects of physical surroundings and employee responses”, Journal of Marketing, Vol. 54, April, pp. 69-82. Bloemer, J. and de Ruyter, K. (1995), “Integrating service quality and satisfaction: pain in the neck or marketing opportunity?”, Journal of Consumer Satisfaction, Dissatisfaction and Complaining Behavior, Vol. 8, pp. 44-52. Bolton, R.N. and Drew, J.H. (1991), “A multistage model of customers’ assessments of service quality and value”, Journal of Consumer Research, Vol. 17, March, pp. 375-84. Buzzell, R. and Gale, B. (1987), The PIMS Principles, The Free Press, New York, NY. Cadotte, E.E., Woodruff, R.B. and Jenkins, R.L. (1987), “Expectations and norms in models of consumer satisfaction”, Journal of Marketing Research, Vol. 24, August, pp. 305-14. Churchill, G.A. Jr and Surprenant, C. (1982), “An investigation into the determinants of customer satisfaction”, Journal of Marketing Research, Vol. 19, November, pp. 491-504. Cronin, J.J. and Taylor, S.A. (1992), “Measuring service quality: a reexamination and extension”, Journal of Marketing, Vol. 56, July, pp. 55-68. Czepiel, J.A. and Rosenberg, L.A. (1977), “Consumer satisfaction: concept and measurement”, Journal of Academy of Marketing Science, Vol. 5 No. 4, Fall, pp. 403-11. Danaher, P.J. and Mattsson, J. (1994), “Customer satisfaction during the service delivery process”, European Journal of Marketing, Vol. 28 No. 5, pp. 5-16.
Satisfaction, value and repurchase 431
IJSIM 8,5
432
Dodds, W.B. (1991), “In search of value: how price and store name information influence buyers’ product perceptions”, The Journal of Services Marketing, Vol. 5, Summer, pp. 27-36. Dodds, W.B. and Monroe, K.B. (1985), “The effect of brand and price information on product evaluations” in Hirschman, E. and Holbrook, M.B. (Eds), Advances in Consumer Research, Vol. 12, pp. 85-90. Dodds, W.B., Monroe, K.B. and Grewal, D. (1991), “The effect of price, brand and store information on buyers’ product evaluations”, Journal of Marketing Research, Vol. 28, August, pp. 307-19. Ellis, A. (1962), Reason and Emotion in Psychotherapy, Lyle Stuart, New York, NY. Fishbein, M. and Ajzen, I. (1975), Belief, Attitude, Intention and Behavior: An Introduction to Theory and Research, Addison-Wesley, Reading, MA. Fornell, C. and Larcker, D.F. (1981), “Evaluating structural equation models with unobservable variables and measurement error”, Journal of Marketing Research, Vol. 18, February, pp. 39-50. Grönroos, C. (1984), “A service quality model and its marketing implications”, European Journal of Marketing, Vol. 18 No. 4, pp. 36-44. Grönroos, C. (1988), “Service quality: the six criteria of good perceived service quality”, Review of Business, Vol. 9 No. 3, pp. 10-13. Gummesson, E. (1993), Qual ity in Service Organizations, International Service Quality Association, Stockholm University, Sweden. Halinen, A. (1994), “Exchange relationships in professional services”, unpublished doctoral dissertation, Series A6, publication of the Turku School of Economics and Business Administration, Turku, Finland. Halstead, D., Hartman, D. and Schmidt, S.L. (1994), “Multisource effects on the satisfaction formation process”, Journal of the Academy of Marketing Science, Vol. 22 No. 2, pp. 114-29. Holbrook, M.B. (1994), “The nature of customer value”, in Rust, R.T. and Oliver, R.L. (Eds), Service Quality, New Directions in Theory and Practice, Sage Publications, London, pp. 21-71. Hunt, K. (1993), “CS/D & CB research suggestions and observations for the 1990s”, Journal of Consumer Satisfaction, Dissatisfaction and Complaining Behavior, Vol. 6, pp. 40-2. Johnson, R. (1995), “The zone of tolerance: exploring the relationship between service transactions and satisfaction with the overall service”, International Journal of Service Industry Management, Vol. 6 No. 2, pp. 46-61. Jöreskog, K.G. and Sörbom, D. (1993), LISREL 8: A Guide to the Program and Applications, Scientific Software International. Kohli, A. (1989), “Determinants of influence in organizational buying: a contingency approach”, Journal of Marketing, Vol. 53, July, pp. 50-65. Kunst, P. and Lemmink, J. (Eds) (1995), Managing Service Quality, Chapman, London. LaBarbera, P.A. and Mazursky, D. (1983), “A longitudinal assessment of consumer satisfaction/dissatisfaction: the dynamic aspect of the cognitive process”, Journal of Marketing Research, Vol. 29, November, pp. 393-404. LaTour S.A. and Peat, N.C. (1979), “Conceptual and methodological issues in consumer satisfaction research”, Advances in Consumer Research, Vol. 6, pp. 431-7. Liljander, V. (1994), “Introducing deserved service and equity into service quality models”, in Klienaltenkamp, M. (Ed.), Dienstleistungsmarketing-Konzeptionen und Anwendungen, Gabler Edition Wissenschaft, Berlin. Liljander, V. (1995), Comparison Standards in Perceived Service Quality, publication No. 63, The Swedish School of Economics and Business Administration, Helsinki. Liljander, V. and Strandvik, T. (1992), “The relationship between service quality, satisfaction and intentions”, working paper No. 273, The Swedish School of Economics and Business Administration, Helsinki.
Liljander, V. and Strandvik, T. (1995), “The nature of customer relationships in services”, in Swartz, T.A., Bowen, D.E. and Brown, S.W. (Eds), Advances in Services Marketing and Management, JAI Press, Greenwich, CT, pp. 4; 141-67. Markels, A. (1996), “Consulting giants hot offer: jobs, jobs, jobs”, The Wall Street Journal, 6 March, p. 1. Monroe, K.B. (1990), Pricing: Making Profitable Decisions, 2nd ed., McGraw-Hill Book Company, New York, NY. Monroe, K.B. and Krishnan, R. (1985), “The effect of price on subjective product evaluations”, in Jacoby, J. and Olson, J. (Eds), Perceived Qual ity: How Consumers View Stores and Merchandise, Lexington Books, Lexington, MA, pp. 209-32. Oliver, R.L. (1980), “A cognitive model of the antecedents and consequences of satisfaction decisions”, Journal of Marketing Research, Vol. 17, November, pp. 460-9. Oliver, R.L. (1992), “An investigation of the attribute basis of emotion and related affects in consumption: suggestions for a stage-specific satisfaction framework”, in Sherry, J. and Sternthal, B. (Eds), Advances in Consumer Research, Vol. 19, Association for Consumer Research, Provo, UT, pp. 237-44. Oliver, R.L. and Swan, J.E. (1989), “Consumer perceptions of interpersonal equity and satisfaction in transactions: a field survey approach”, Journal of Marketing, Vol. 53, April, pp. 21-35. Olshavsky, R.W. (1985), “Perceived quality in consumer decision making: an integrated theoretical perspective”, in Jacoby, J. and Olson, J. (Eds), Perceived Quality: How Consumers View Stores and Merchandise, Lexington Books, Lexington, MA, pp. 3-30. Parasuraman, A., Zeithaml, V.A. and Berry, L.L. (1985), “A conceptual model of service quality and its implications for future research”, Journal of Marketing, Vol. 49, Fall, pp. 41-50. Parasuraman, A., Zeithaml, V.A. and Berry, L.L. (1988), “SERVQUAL: A multiple-item scale for measuring consumer perceptions of service quality”, Journal of Retailing, Vol. 64 No. 1, pp. 12-37. Patterson, P.G. (1993), “Expectations and product performance as determinants of satisfaction with a high-involvement purchase”, Psychology and Marketing, Vol. 10 No. 5, pp. 449-65. Patterson, P.G. (1995), “The determinants of satisfaction/dissatisfaction for business-to-business, professional services: a conceptual model”, in Swartz, T.A., Bowen, D.E. and Brown, S.W. (Eds), Advances in Services Marketing and Management, JAI Press, Greenwich, CT, pp. 4; 169-93. Patterson, P.G. and Johnson, L.W. (1993), “Disconfirmation of expectations and the gap model of service quality: an integrated paradigm”, Journal of Consumer Satisfaction, Dissatisfaction and Complaining Behavior, Vol. 6, pp. 90-9. Pennings, J.M. (1979), “Coordination between strategically interdependent organisations”, in Nystrom, P. and Starbuck, W. (Eds), Handbook of Organisational Design, Elsevier, Amsterdam. Philips, L.W. (1981), “Assessing measurement error in key informant reports: a methodological note on organizational analysis in marketing”, Journal of Marketing Research, Vol. 18, pp. 395-415. Rokeach, M. (1973), The Nature of Human Value, The Free Press, New York, NY. Sasser, W.E. Jr, Olsen, P.R. and Wyckoff, D.D. (1978), Management of Service Operations: Text and Cases, Allyn and Unwyn, Boston, MA. Sawyer, A.G. and Dickson, P. (1984), “Psychological perspectives on consumer response to sales promotion”, in Jocz, C. (Ed.), Research on Sales Promotion: Collected Papers, Marketing Science Institute, Cambridge, MA, pp. 1-21. Sheth, J.N., Newman, B.I. and Gross, B.L. (1991), “Why we buy what we buy: a theory of consumption values”, Journal of Business Research, Vol. 22, pp. 159-70.
Satisfaction, value and repurchase 433
IJSIM 8,5
434
Spreng, R.A., Dixon,A.L. and Olshavsky, R.W. (1993), “The impact of perceived value on consumer satisfaction”, Journal of Consumer Satisfaction, Dissatisfaction and Complaining Behavior, Vol. 6, pp. 50-5. Spreng, R.A, Harrell, G.D. and Mackoy, R.D. (1995), “Service recovery: impact on satisfaction and intentions”, Journal of Services Marketing, Vol. 9 No. 1, pp. 15-23. Spreng, R.A., MacKenzie, S.B. and Olshavsky, R.W. (1996), “A re-examination of the determinants of consumer satisfaction”, Journal of Marketing, Vol. 60, July, pp. 15-32. Strandvik, T. and Liljander, V. (1994), “A comparison of episode performance and relationship performance for a discrete service”, in Klienaltenkamp, M. (Ed.), DienstleistungsmarketingKonzaptionen und Andewendungen, Gabler Edition Wissenschaft, Berlin. Stokes, R.C. (1985), “The effect of price, package design and brand familiarity on perceived quality”, in Jacoby, J. and Olson, J. (Eds), Perceived Quality: How Consumers View Stores and Merchandise, Lexington Books, Lexington, MA, pp. 233-46. Swan, J.E. and Combs, L.J. (1976), “Product performance and consumer satisfaction: a new concept”, Journal of Marketing, Vol. 40, April, pp. 25-33. Sweeney, J. (1994), “An investigation of a theoretical model of consumer perceptions of value”, unpublished doctoral dissertation, School of Management and Marketing, Curtain University of Technology, Perth, Australia. Tse, D.K. and Wilton, P.C. (1988), “Models of consumer satisfaction formation: an extension”, Journal of Marketing Research, Vol. 25, May, pp. 204-12. Vantrappen, H. (1992), “Creating customer value by streamlining business processes”, Long Range Planning, Vol. 25, February, pp. 53-62. Weiner, B. (1986), An Attributional Theory of Motivation and Emotion, Springer-Verlag, New York, NY. Zeithaml, V.A. (1988), “Consumer perceptions of price, quality and value: a means-end model and synthesis of evidence”, Journal of Marketing,Vol. 52, July, pp. 2-22.