Feb 28, 2005 - We show that for certain binary IV-VI glasses (especially silica), decoration ... relaxation to highly realistic models of the IV-VI glass. In particular ...
PHYSICAL REVIEW B 71, 054206 共2005兲
Models and modeling schemes for binary IV-VI glasses De Nyago Tafen and D. A. Drabold Department of Physics and Astronomy, Ohio University, Athens, Ohio 45701 共Received 25 May 2004; revised manuscript received 24 September 2004; published 28 February 2005兲 In this paper, we present and thoroughly characterize several new models of amorphous binary IV-VI glasses. We apply both a quench from the melt simulation regime and a scheme based on decoration of tetrahedral amorphous networks. We show that for certain binary IV-VI glasses 共especially silica兲, decoration of bond-centered column VI atoms on tetrahedral amorphous networks leads with appropriate re-scaling and relaxation to highly realistic models of the IV-VI glass. In particular, the problem of freezing in too much liquid-like character seems to be significantly ameliorated. We also carry out first-principles molecular dynamics simulations to study the structural, dynamical, and electronic properties of GeSe4 and GeSe9. Good agreement with experiment is obtained for the total neutron structure factor over the entire range of k-space and for the electronic density of states. DOI: 10.1103/PhysRevB.71.054206
PACS number共s兲: 61.43.Bn, 61.43.Fs, 61.43.Dq
I. INTRODUCTION
The nature and extent of atomic ordering in amorphous solids has attracted considerable interest and has accelerated recently. This is partly because of an increase in the technological utility of glasses in various applications. It is also part of a general interest in the fundamental properties of disordered materials. For example, amorphous silicon dioxide constitutes a prototypical example of a network-forming disordered material1 and is important for geophysics and for electronic applications. The Raman spectrum of g-SiSe2 gives the clearest indication of the presence of intermediaterange structural order 共IRO兲 of any chalcogenide.2 There is also a pressing need for ways to build models of nonstoichiometric glasses. To produce realistic models, Nakhmanson, Zhang, and Drabold3 have found it useful to include primitive a priori information about the chemical order and coordination in model construction because of the limitations of molecular dynamics 共MD兲 simulation time scales. For GexSe1−x, the limitation of the quench from the melt method appears to be an incorrect static structure factor S共Q兲, for large Q. We have recently developed a new scheme, “decorate and relax,”4 to produce binary glasses from models of tetrahedral amorphous semiconductors. We have made a comparison of such models to those obtained from quench from the melt process. Encouraging agreement with the existing experimental data was obtained especially for large Q behavior of S共Q兲.4 For large Q, S共Q兲 for the quench from the melt models decays away too rapidly relative to experiments.6 In parallel work we are developing a scheme “Experimentally constrained molecular relaxation” to enable direct inclusion of experimental data in model formation.5 In this paper we carry out model calculations on AX2 共A w Si, Ge and X w Se, O兲 using decorate and relax. We also model GexSe1−x 共x = 0.1, 0.2兲 using the quench from the melt technique. To our knowledge there is little experimental and theoretical work on the structure and vibrational structure of g-GeSe4, and nothing on electronic structure. Compositions near g-GeSe4 are used as a host for Ag+ ions and 1098-0121/2005/71共5兲/054206共15兲/$23.00
the Programmable Metallization Cell.7 In a joint experimental and theoretical study of g-GeSe9, Rao et al.8 limited their work only to the static structure factor and the pair distribution function. They have suggested that g-GeSe9 consists predominantly of Se-chain segments interlinked with tetrahedra. Theirs is the first attempt to carry out theoretical work on the vibrational and electronic structure of g-GeSe9 glass. We demonstrate the utility of our simulations by performing detailed comparison with experimental data 共where available兲 in real and k-space and by comparing to vibrational and electronic measurements where available. The rest of the paper is organized as follows. In the next section we give a brief description of our simulation methods and model generation. Section III describes the structural properties of our different models by looking at the structure factors, pair correlation functions, and ring distribution. Section IV is devoted to the vibrational properties of the models. The electronic properties of the systems are examined in section V, and Sec. VI provides discussion of the composition dependence of experimental observables for GeSe binary glasses. II. MODEL GENERATION A. Total energy/force codes
For some of the simulations reported in this paper, we used FIREBALL, an approximate ab initio density functional code in the LDA developed by Sankey and co-workers.9 In this method the Harris functional is used in a scheme with the mathematical structure of nonorthogonal tight-binding,10 and the use of no free parameters in constructing the Hamiltonian matrix. The basis set is minimal 共for these systems, one s and three p slightly excited pseudo-atomic orbitals per site兲. This scheme does well at producing experimentally credible models because of its balance between accuracy and efficiency. In particular, experimentally realistic models require large supercell models and long time evolutions in addition to a suitable level of accuracy, which FIREBALL provides. The other code is SIESTA,11 which has broad flexibility with respect to basis set, density functional, and simulation
054206-1
©2005 The American Physical Society
PHYSICAL REVIEW B 71, 054206 共2005兲
D. N. TAFEN AND D. A. DRABOLD
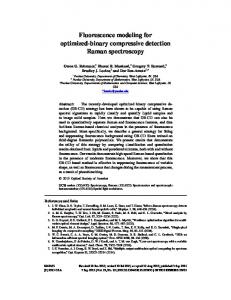
FIG. 1. Calculated total neutron structure factor S共Q兲 of quench from the melt glassy GeSe4 共solid line兲 compared to experimental 共Ref. 14兲 data 共circle兲. We used scattering lengths of bGe = 8.185 and bSe = 7.970 fm.
regime. We employed SIESTA for silica because the extreme ionicity of the material, and also to easily check the importance of density functional, basis set and spin polarization. B. Model formation
The models described here have been generated using the decorate and relax method, except g-GeSe4 and g-GeSe9. The details of the method were reported in Ref. 4 and Ref. 5. We just give a brief recap here. The starting point is a defectfree 共fourfold coordinated兲 atom supercell model of a-Si made with the WWW method12 as further developed by Barkema and Mousseau.13 We decorated all the IV-IV bonds with a bond-center VI, and rescaled the coordinates to the experimental density of the model. In this way we made 648-atom models of g-GeSe2, g-SiSe2, and g-SiO2. The 648atom models of g-GeSe2 and g-SiSe2 were then quenched with FIREBALL to the nearest minimum. The 648-atom model of g-SiO2 was relaxed with SIESTA. A 600-atom model of g-GeSe4 was made using the quench from the melt technique. We randomly placed atoms in a cubic supercell with edge length 26.061 Å. The initial temperature of our system was 2400 K. We then equilibrated the cell at 1400 K for approximately 4 ps. After equilibration, we began quenching it down to about 700 K over 4 ps. As the final step, we steepest descent quenched the cell to 0 K and forces smaller in magnitude than 0.02 eV/ Å. To model g-GeSe9 we randomly placed atoms in a cubic supercell, 共consisting of 40 Ge atoms and 360 Se atoms兲, with side length of 22.971 Å. This gives a total number density close to experiment 共0.0330 Å−3兲.8 Then we brought the temperature of the system to 2200 K. We took three steps to cool down the model. First, the cell was equilibrated at 1400 K for over 2 ps; then we cooled it at 300 K for over 3 ps. Finally the cell was steepest descent quenched to 0 K. All the calculations were performed at constant volume using the ⌫ point to sample the Brillouin zone in order to
compute energies and forces. Considering the large supercell volume it was reasonable to use ⌫ point alone. The final model of g-GeSe2 consists of 216 Ge atoms and 432 Se atoms with lattice constant 27.525 Å, the g-SiO2 consists of 216 Si atoms and 432 O atoms with the side length 21.39 Å, and g-SiSe2 has 216 Si atoms and 432 Se atoms with lattice constant 27.6 Å. III. STRUCTURAL PROPERTIES
Structural information can be extracted from the neutron static structure factor S共Q兲. S共Q兲 has been obtained by weighting the calculated partial structure factors with the neutron scattering lengths of the corresponding elements. The topology of the glasses can be described by the pair correlation function G共r兲, which is related to S共Q兲 by G共r兲 = 1 +
1 4
冕
⬁
关S共Q兲 − 1兴
0
Q2 sin共Qr兲 dQ. Qr
The topology of our models is also analyzed with ring statistics. The ring structures in our models are determined by starting on a particular atom, moving to one of its neighbors, and then repeating this process for the neighbor until the original atom is located again after the desired number of iterations 共making sure not to include any atom which is already part of the ring from a previous iteration since an n-fold ring consists of 2n alternating IV-VI bonds兲. A. GeSe4 glass
In Fig. 1 we compare the neutron static structure factor S共Q兲 to the experiment of Petri and Salmon.14 The first sharp diffraction peak 共FSDP兲 is present in the quench from the melt model at 1.12 Å−1; but it was absent in the decorated model.4 We believe that the absence of the FSDP in the decorated model is a size effect since the decorated model con-
054206-2
PHYSICAL REVIEW B 71, 054206 共2005兲
MODELS AND MODELING SCHEMES FOR BINARY IV-… TABLE I. Average number m␣共l兲 共boldface characters, expressed as a percentage兲 of atoms of species ␣ 共␣ = Ge, Se兲 l-fold coordinated at a distance of 2.8 Å for GeSe4. We also give the identity and the number of the Ge and Se neighbors for each value of m␣共l兲. Ge l=4 GeSe3 Se4
88.34 11.67 76.67
Se
l=3 Se3 Se2Ge SeGe2 Ge3
l=2 Se2 l=5 Se5
2.5 2.5 0.83 0.83
l=3 Se3
8.33 8.33
l=1 Se Ge
17.30 3.75 13.55
l=2 Se2 SeGe Ge2
63.54 19.79 25 18.75
19.16 8.54 3.54 2.5 4.58
sists of 319 atoms 共a similar effect has been observed in our 190-atom model of g-GeSe4 using quench from the melt兲 whereas the quench from the melt model has 600 atoms. The second peak depends on the next nearest neighbors at approximately 3.8 Å. From the partial structure factors, it is evident that the second peak is due to Seu Se correlations. There is still a slight discrepancy between the experimentally observed strength of the second peak and that of our S共Q兲. Overall our calculated neutron structure factor is in agreement with the experimental results. In our model the very prominent FSDP is clearly seen in SCC共Q兲 at around 1.08 Å−1 which implies that the strong Geu Ge IRO correlations in g-GeSe4 are reasonably well described. This feature does not, however, appear in classical MD simulations15 of amorphous GeSe2 and it has proved possible to reproduce this feature using the first principles MD approach of Massobrio et al.16 only when a general gradient approximation is used in the density functional. Where coordination is concerned, we note that 88.5% of Ge are fourfold coordinated and are mostly in GeSe4 tetrahedral units, 8% are threefold coordinated and 3.5% are twofold and fivefold coordinated. Se is quite a different story: about 64% of the Se are twofold coordinated, 19% are threefold and about 17% are onefold coordinated. Where chemical order is concerned, g-GeSe4 has 64.23% Geu Se bonds, 0.9% Geu Ge bonds, and 34.87% Seu Se bonds. In Table I we give a full description of the topology of our model. In Fig. 2 we plot the partial pair distribution function of g-GeSe4. The peaks in g␣共r兲 for distances larger than the nearest neighbor distance are a manifestation of the IRO in the system and gGeuGe共r兲 shows correlations between tetrahedra. There are two distinct peaks which correspond, respectively, to Geu Ge first and second neighbors at 2.36 and 3.8 Å in gGeuGe共r兲. The broad peak between 3.0 and 4.3 Å in the gGeuGe共r兲 is caused by the presence of both corner
FIG. 2. Partial pair distribution functions g␣共r兲 vs r in gGeSe4 共dotted lines兲 and in g-GeSe9 共solid lines兲.
sharing 共CS兲 共the tetrahedra shares one Se atom兲 and edge sharing 共ES兲 tetrahedra 共the tetrahedra shares two Se atoms兲. In gGeuGe共r兲 the first peak is located at 2.36 Å, which is quite close to the crystal Geu Se bond length of 2.355 Å 共for ␣-GeSe2兲. The next peak appears at 3.7 Å and it is associated with CS units. Another peak arises at 5.65 Å which indicates that there is some kind of IRO in our model; the strength and width of this peak are due to Ge correlations with Se on neighboring tetrahedra. The gSeuSe共r兲 nearestneighbor peak is located at approximately 2.32 Å. The second peak at approximately 3.78 Å is close to the Seu Se separation distance in crystalline ␣-GeSe2.17 Since the ratio of Geu Se: Seu Se distances is 0.624, close to the value of 0.612 expected for perfect tetrahedral coordination, the results indicate that there is a large number of tetrahedral Ge共Se1/2兲4 structural motifs and those tetrahedral units are distorted. We also obtain partial nGe, nSe, and average n coordination numbers from the first neighbor coordination numbers nGeGe, nGeSe, nSeGe, and nSeSe 共see Table II兲 by integrating the partial pair correlation function g␣共r兲. The theoretical Geu Ge coordination number nGeGe shows that each Ge atom has on average nGeGe = 0.12 nearest neighbors of the same species within a given shell of radius 2.8 Å. The predominant Geu Se heteropolar bonding is expressed by a coordination number nGeSe = 3.80. The total Ge and Se coordination numbers, nGe = nGeGe + nGeSe, nSe = nSeSe + nSeGe, are therefore 3.92 and 2.03, respectively. The average coordination number, n = cGenGe + cSenSe, gives a value n = 2.41. The resulting values are very close to a perfect chemically ordered tetrahedral network 共CON兲.
054206-3
PHYSICAL REVIEW B 71, 054206 共2005兲
D. N. TAFEN AND D. A. DRABOLD TABLE II. First and second peak positions in g-GeSe4. Also first and second neighbor coordination numbers n␣ and n⬘␣. The integration ranges are 0–2.8, 2.8– 4.5 Å for Geu Ge and Seu Se; 0–3.0, 3.0– 4.5 Å for Geu Se and Seu Ge. First shell
Second shell
Bond type
r共Å兲
n␣
r⬘共Å兲
n⬘␣
Geu Ge Geu Se Seu Ge Seu Se
2.36 2.36 2.36 2.32
0.12 3.80 0.91 1.12
3.8 3.7 3.7 3.78
2.26 — — 9.74
The topology of covalent glasses is commonly discussed in terms of rings. We have calculated the distribution of threefold to ninefold rings. The distributions of rings for the model are given in Table V. There is a predominance of fivefold and sixfold rings in the glass. B. GeSe9 glass
In Fig. 3 we compare the calculated neutron static structure factor S共Q兲 for g-GeSe9 to the experimental results from neutron diffraction measurements.8 The general trend complies with observation though the detailed structure departs from the experimental data. The FSDP appears only as a shoulder; and it is more pronounced in our calculation than in experiment 共though it is quite weak in both兲. Experimental studies8,14 on GexSe1−x have shown that the intensity of FSDP first increases systematically with Ge concentration, then reaches its maximum at x = 0.33, then subsequently decreases. The third peak and the features at higher Q depend mainly on the local environment. As soon as the nearest neighbor atoms are taken into account, the third peak appears. On the other hand, the second peak in S共Q兲 depends
on the next-nearest neighbors at approximately 4.3 Å. The shoulder in S共Q兲 at around 1.04 Å−1 is due to the cancellation between SGeGe共Q兲 and SSeSe共Q兲. Partial pair correlation functions g␣共r兲 are shown in Fig. 2. The Geu Se pairs provide the dominant contribution to the first shell of the pair correlation function. It is obvious that there exist Seu Se homopolar bonds in the model due to the surplus of Se atoms relative to the stoichiometric composition GeSe2. Seu Se pairs make a strong contribution in the range of the second shell, whereas Geu Ge pairs contribute most in the range of the third shell. In gGeuGe共r兲 there are two distinct peaks which correspond, respectively, to Geu Ge second and third neighbors at 3.02 and 3.76 Å. In a-Ge the nearest neighbor Geu Ge separation is known to be 2.463 Å.18 The absence of a peak in the first shell of gGeuGe共r兲 is due to the absence of Geu Ge homopolar bonds in our model. In gSeuSe共r兲 the first peak is located at 2.36 Å, and the next peak appears around 3.64 Å. The peak around 5.6 Å indicates that our model exhibits IRO. About 92.5% of Ge atoms are fourfold coordinated, 5% are fivefold coordinated and 2.5% are threefold coordinated. Also, only 60% of Se atoms are twofold coordinated, 20.4% are threefold and about 19.6% are onefold coordinated. Where chemical ordered is concerned, g-GeSe9 has 36.3% Geu Se bonds and 63.7% of Seu Se bonds. The Geu Ge homopolar bonds are nonexistent in our model. The detailed topology of our model is given in Table III. Our result is in accordance with the chemically ordered continuous random network19 which predicts that for x ⬍ 0.33, Seu Se bonds are present in addition to Geu Se bonds. Similarly Ge rich glasses, i.e., x ⬎ 0.33, contain Geu Ge as well as Geu Se bonds. The theoretical Geu Ge coordination number, nGeGe = 0.0, confirms that each Ge atom does not have any nearest neighbors of the same species within a first shell of radius 2.8 Å. We also obtain partial nGe, nSe, and average n coordination numbers 共see Table IV for details兲. The Ge and Se coordination numbers are, respectively, 3.99 and 2; that gives
FIG. 3. Calculated total neutron structure factor S共Q兲 of GeSe9 共solid line兲 compared to experimental 共Ref. 8兲 data 共circle兲. We used scattering lengths of bGe = 8.185 and bSe = 7.970 fm.
054206-4
PHYSICAL REVIEW B 71, 054206 共2005兲
MODELS AND MODELING SCHEMES FOR BINARY IV-… TABLE III. Average number m␣共l兲 共boldface characters, expressed as a percentage兲 of atoms of species ␣ 共␣ = Ge, Se兲, l-fold coordinated at a distance of 2.8 Å for GeSe9. We also give the identity and the number of the Ge and Se neighbors for each value of m␣共l兲. Ge l=5 Se5
2.5 2.5
l=4 Se4
92.5 92.5
l=1 Se Ge
19.6 7.1 12.5
l=2 Se2 SeGe Ge2
60 36.94 16.94 6.12
Ring size
3
4
5
6
7
8
9
GeSe4 GeSe9 SiO2 SiSe2
5 2 0 15
20 3 7 14
39 15 0 4
30 6 6 11
9 2 0 5
13 4 15 12
8 2 0 9
5 5
Se
l=3 Se3 Se2Ge SeGe2 Ge3
l=3 Se3
TABLE V. Ring statistics. The number of n-membered rings, n = 3 through n = 9.
20.4 16.78 3.06 0.28 0.28
an average coordination number equal to 2.2. This number is quite reasonable since it lies between 2.16 for x = 0.08 and 2.24 for x = 0.12. Rao et al.8 found a value of 2.45 for x = 0.1. There is a significant fraction of Ge共Se1/2兲4 tetrahedral units in our model. The structure of the glass consists of Se-chain segments which are cross-linked by Ge共Se1/2兲4 tetrahedra, as confirmed by nSeSe and by visual inspection using XMOL.20 We also note the presence of a few CS and a negligible fraction of ES. The structure of our model is also dominated by the presence of five- and six-member rings 共see Table V兲. C. SiO2 glass
In Fig. 4 we compare the structure factor S共Q兲 of our 648-atom model of g-SiO2 with the S共Q兲 of our 192-atom model4 and the S共Q兲 extracted from neutron diffraction experiments.21 There is nearly perfect agreement with experiment over the entire range of Q. The height and the poTABLE IV. First and second peak positions in g-GeSe9. Also first and second neighbor coordination numbers n␣ and n⬘␣. The integration ranges are 0–2.8, 2.8– 3.23 Å for Geu Ge; 0–2.8, 2.8– 4.1 Å for Geu Se and Seu Ge; 0–2.8, 2.8– 4.34 Å for Seu Se. First shell
Second shell
Bond type
r共Å兲
n␣
r⬘共Å兲
n⬘␣
Geu Ge Geu Se Seu Ge Seu Se
— 2.37 2.37 2.35
0.0 3.99 0.44 1.56
3.02 3.64 3.64 3.79
0.11 3.66 0.58 9.2
sition of the peaks coincide with the experimental results. The discrepancy between the 192- and the 648-atom models arises from finite size effects, since the same Hamiltonian and modeling procedure was used to generate both models. It is of some interest that the only substantial difference between the 192- and 648-atom models was near 2.0 Å−1, at the minimum after the FSDP. The only notable remaining discrepancy between theory and experiment appears near 12 Å−1, and is similar to both models 共and so is not due to a finite-size effect兲. The origin of various peaks in S共Q兲 can be inferred from partial structure factors. The results for partial static structure factors are shown in Fig. 5. The second peak in S共Q兲 arises from Siu Si and O u O correlations with partial cancellation arising from Siu O anticorrelations. Since S共Q兲 is weighted by concentrations and scattering lengths, the O u O contributions in this region are comparable to those of Siu Si. The third and fourth peaks receive contributions from Siu Si, O u O and Siu O correlations. The real space pair correlation functions of our vitreous silica models are illustrated in Fig. 6. The agreement between the experiment and theory is quite good. The peaks position and the bond lengths are well reproduced and comparable to experimental values from neutron diffraction data. On average, miscoordinated atoms in our 648-atom model occurred with a probability of 2.16%. These consisted of fivefold coordinated Si 共3.2% of Si兲 and of threefold coordinated O 共1.6% of O兲. Where chemical order is concerned, our model has 100% heteropolar bonding as one would expect from the chemistry of silica. The resulting amorphous model is characterized by the presence of chemically ordered bond network in which Si-atom-centered tetrahedra are linked by CS O atoms. For vitreous silica we also compute the bond angle distribution. Figure 7 shows the distribution function for the tetrahedral angle O u Siu O and Siu O u Si. The O u Siu O angle has a mean value of 109.5° which is near the tetrahedral angle ⌰T = 109.47°, and a full width at half maximum 共FWHM兲 of the order of 9°. On the other hand the Siu O u Si angle-distribution is much broader with an average value of 140° with a FWHM close to 25°. In their experiment,22 Pettifer et al. obtained an average value of 142° for the angle Siu O u Si with a FWHM of the order of 26°. In Table VI we compare our results for the bond angle distribution with experiments23,24 and theoretical results.25 The location and the width of the peaks are in good agreement with experimental values. The topology of our model is also examined through the ring structure. In Table V we report the distributions of the rings in our sample. We notice that there is no contribution from odd rings. This reiterates
054206-5
PHYSICAL REVIEW B 71, 054206 共2005兲
D. N. TAFEN AND D. A. DRABOLD
FIG. 4. Calculated total neutron static structure factor S共Q兲 of glassy SiO2 共dashed lines are for 192-atom model and solid lines are for 648atom model兲 compared to experimental data 共Ref. 21兲 共filled circles兲. We used scattering lengths of bSi = 4.149 and bO = 5.803 fm.
In Fig. 8 we display the calculated total neutron structure factor of our 648-atom model of g-SiSe2 along with the
experimental26 total neutron structure factor and the 192atom model from decorate and relax.4 The agreement is good over the entire q range, the positions of maxima and minima being properly reproduced 共though the amplitudes are not perfect兲. Our calculated partial structure factors show a FSDP at 1.0 Å−1 in SSiuSi共Q兲 and SSiuSe共Q兲, and at 1.1 Å−1 in SSeuSe共Q兲. The largest value of the first sharp diffraction peak is observed in SSiuSi共Q兲 which is primarily responsible
FIG. 5. Calculated partial structure factors S␣共Q兲 of glassy SiO2.
FIG. 6. Calculated real space partial pair correlation function g␣共r兲 of g-SiO2.
the absence of wrong bonds. We emphasize that the simple Decorate and Relax procedure seems extremely well suited to silica. D. SiSe2 glass
054206-6
PHYSICAL REVIEW B 71, 054206 共2005兲
MODELS AND MODELING SCHEMES FOR BINARY IV-…
TABLE VI. Location, and in parentheses the FWHM of the angles O u Siu O and Siu O u Si as determined from the simulation and experiments. Theory
OSiO SiOSi
FIG. 7. Bond-angle distribution function O u Siu O 共top panel兲 and Siu O u Si 共bottom panel兲.
for its appearance in the total neutron structure factor. In Celino and Massobrio’s calculations27 the FSDP was absent in the calculated Seu Se partial structure factor. To our knowledge, no experimental partial structure factors are currently available. The MD partial pair correlation functions g␣共r兲 for the 648-atom model are not so different from the 192-atom model4 except for the appearance of a peak at around 3 Å in gSiuSi共r兲. This peak is entirely due to correlations arising from ES tetrahedra. The atomic structure of our model con-
Experiment
Decorate
Ref. 25
Ref. 23
Ref. 24
109.5° 共9°兲 140° 共25°兲
108.3° 共12.8°兲 152° 共35.7°兲
109.5° 144° 共38°兲
109.7° 144°, 152°
sists of both corner-sharing and edge-sharing SiSe4 tetrahedra. The percentage of Si atoms forming homopolar bonds are less than 0.1%. On the other hand 6% of Se atoms are involved in homopolar bonding. Considering only the chemically ordered SiSe4 and SiSe2, about 80% of Si and 83.3% of Se atoms are, respectively, fourfold and twofold. Neutron diffraction and EXAFS experiments have suggested that the network of tetrahedra is mostly chemically ordered, but a small amount of homopolar bonds should not be ruled out.28 Few MD studies have determined ring statistics in amorphous SiSe2.29,30 Analysis of ring distributions 共see Table V兲 reveals that threefold, fourfold, and eightfold are most abundant. In their calculations, Antonio et al.30 found that threefold and eightfold rings were the most abundant, and chainlike fragments were revealed predominantly in eightfold rings. The appearance of odd number rings is due to homopolar bonds. There is also a significant amount of sixfold rings which together with the fourfold units are responsible for the chemical order in the glass. IV. DYNAMICAL PROPERTIES
The vibrational properties are characterized by the vibrational density of states 共VDOS兲 and species-projected vibrational density of states. Since the VDOS can be determined
FIG. 8. Calculated total neutron static structure factor S共Q兲 of glassy SiSe2 共dotted lines are for 192-atom model and solid lines are for 648atom model兲 compared to experimental data 共Ref. 26兲 共filled circles兲. We used scattering lengths of bSi = 4.149 and bSe = 7.970 fm.
054206-7
PHYSICAL REVIEW B 71, 054206 共2005兲
D. N. TAFEN AND D. A. DRABOLD
FIG. 9. Vibrational density of states 共solid lines兲 and species projected vibrational density of states for Se 共dashed lines兲 and Ge 共dotted lines兲 for g-GeSe4.
through inelastic neutron scattering, it provides a straightforward test of our models. The method has been described in previous work.31 As a brief reminder, the supercell normal mode eigenvalues and eigenvectors were obtained from the dynamical matrix which was determined by displacing each atom by 0.015 Å in three orthogonal directions and then performing ab initio force calculations for all the atoms for each such displacement to obtain a column of the force constant matrix. A. GeSe4 glass
The vibrational density of states are plotted in Fig. 9. We also plot the species-projected density of states for Se and Ge. Three bands can be distinguished: a low energy acoustic band which is strongly correlated to the connectivity of the network involving mainly extended inter-block vibrations and a high energy optic band which tends to strongly depend on the configurations of the building blocks, consisting of more localized intrablock vibrations. The two main bands are clearly separated by the tetrahedral breathing 共A1-A1c兲 band. The same features have been observed experimentally by Effey and Cappelletti,32 also by Kamitakahara et al.33 Effey and Cappelletti concluded that the broad band below 20 meV 共161.31 cm−1兲 is dominated by modes extending widely over the entire network and not by modes localized on “molecular” features in the glass such as the tetrahedron giving rise to the A1 mode. Low frequency and high frequency characteristics are well reproduced. The species projected VDOS for the Se atoms and Ge atoms clearly show that the Se atoms are responsible for most of the motion.
up to 19 meV, and the high-energy band that decays near 40 meV. The shoulder around 19 meV and the sharp peak around 31 meV can be regarded, respectively, as the bondbending and the bond-stretching vibrations. In the valley between the low-energy and the high-energy band, a feature arises at about 23.4 meV. This feature has been identified in Raman scattering measurements34,35 as an A1 mode resulting from vibrations of Se atoms with their cross-linking Ge neighbors. This feature is absent in the spectrum of Se. Experimentally,33 it has been shown that the A1 mode is a function of Ge concentration in the glass. As Ge concentration increases, the A1 mode rises in the gap. C. SiO2 glass
Amorphous silica has been extensively characterized via vibrational spectroscopies, including inelastic neutron scattering,36 infrared absorption,37 and Raman scattering experiments.38 It was found that the spectrum shows several peaks. In order to show the validity of the vibrational features of our model, we report in Fig. 11 the VDOS for the 192-atom model of g-SiO2 共the dynamical matrix for the 648 atom model has not yet been calculated兲 along with the neutron scattering experimental results of Carpenter et al.36 Shapes and positions of the principal peaks are well reproduced with low-frequency bands at 400 and 495 cm−1, and an intermediate frequency band at 790 cm−1. In the high frequency band there is a peak at 1070 cm−1 and the other peak appears at 1200 cm−1. With respect to experiment,36,38,39 and the size of our model 共192 atoms兲 the calculated VDOS shows good agreement as regards the location of the principal peaks and the distribution of their intensities.
B. GeSe9 glass
In Fig. 10 we display the calculated VDOS and the species projected density of states of g-GeSe9. The VDOS can be divided mainly into two bands. The low-energy band goes
D. SiSe2 glass
In Fig. 12 we display the VDOS along with the principal peak positions in glassy SiSe2. The general shape of the den-
054206-8
PHYSICAL REVIEW B 71, 054206 共2005兲
MODELS AND MODELING SCHEMES FOR BINARY IV-…
FIG. 10. Vibrational density of states 共solid lines兲 and species projected vibrational density of states for Se 共dashed lines兲 and Ge 共dotted lines兲 for g-GeSe4.
sity of states agrees well with the inelastic neutron scattering measurements made on the high-resolution medium-energy chopper spectrometer 共HRMECS兲.40 In the HRMECS experiment, the acoustic band reveals considerable structure, with three peaks, approximately centered at 48, 81, and 113 cm−1. In our theoretical calculation, these peaks are, respectively, found at 47.5, 70, and 112 cm−1; numbers quite consistent with inelastic neutron scattering experiment and Raman measurements.28,34,41,42 In the intermediate band two peaks appear at 215 and 240 cm−1. On Raman measurements the 48 cm−1 peak is unresolved. Based on Raman measurements, Susman et al.28 associated the 70 cm−1 peak with the edge-sharing tetrahedra while Griffiths et al.41 associated it to an Ag mode. More peaks are observed in the spectrum of the VDOS of g-SiSe2. In our model these peaks occur around 215, 240, 303, 358, 387, and 469 cm−1. Sugai34 assigned the 213 and 222 cm−1 Raman peaks to the A1 共corner sharing兲
and the 240 and 248 cm−1 共not present in our model兲 to the ES modes. Jackson and Grossman2 confirmed this result by assigning the 214 cm−1 peak to A1 modes of CS-connected tetrahedra, either isolated or in chains. V. ELECTRONIC PROPERTIES
The electronic properties of our models are analyzed through the electronic density of states 共EDOS兲 and inverse participation ratio 共IPR兲, which we denote by I. The EDOS was obtained by summing suitably broadened Gaussians centered at each eigenvalue. The IPR N
I共E兲 = N
q共n,E兲2 兺 n=1
determines the localization of electronic eigenvalues. Here N is the number of atoms in the model and q共n , E兲 is the Mul-
FIG. 11. Calculated vibrational density of states of 192 atom model of g-SiO2 compared to neutron scattering experiments 共Ref. 36兲.
054206-9
PHYSICAL REVIEW B 71, 054206 共2005兲
D. N. TAFEN AND D. A. DRABOLD
FIG. 12. Calculated vibrational density of states of g-SiSe2. Principal peaks positions are shown.
liken charge localized on atomic site n in a certain eigenstate E. Hence, I is a measure of the inverse number of sites involved in the state with energy E. For a uniformly extended state, the Mulliken charge contribution per site is uniform and I共E兲 = 1 / N. For an ideally localized state, only one atomic site contributes all the charge and I共E兲 = 1. Therefore a larger value of I means that the eigenstate is more localized in real space. A. GeSe4 glass
The EDOS is obtained by convoluting each energy eigenvalue with suitably broadened Gaussian. The calculated
EDOS of g-GeSe4 in Fig. 13 agrees quite well with experimental results obtained from x-ray photo-emission43 共XPS兲. The substantial splitting between the first two peaks of the valence bands is also well-pronounced. The valence band exhibits three features. The two lowest bands between −15.64 and −6.5 eV originate from the atomic s-like states of Ge and Se. The next band contains p-like bonding states lying between −6.37 and −3.6 eV and predominantly p-like nonbonding states in the topmost valence region 共our electronic eigenvalues have been shifted in order to place the valence band edge eigenvalue at zero兲. The characteristic of the p band in g-GeSe4 is represented by three distinct groups of peaks as indicated in the spectra of Fig. 13. The first group 共I兲 contains all the bonding states whose energies fall within 关−6.0, −4.09兴 eV. The second group 共II兲 includes the bonding states with energies in 关 −4.09, −2.6兴 eV. The last group 共III兲 is in the topmost region of 关−2.6, 0.0兴 eV. There is a substantial splitting between groups 共II兲 and 共III兲 giving rise to two peaks. These characteristics have been observed in g-GeSe2 共Ref. 44兲 and have been named the A1 and A2 peaks, respectively. By analogy to GeSe2, the shoulder in group 共I兲 has been identified as A3 peak and the peak of the second lowest band as B peak. In Table VII we compare the positions of the peaks in the EDOS to the experimental results of GeSe2.44 TABLE VII. The positions of the A1, A2, A3 and B peaks in the EDOS of GeSe4 and SiSe2 glasses compared to experimental results of GeSe2 共Ref. 44兲.
FIG. 13. Electronic density of states 共solid lines兲 and species projected electronic density of states for Se 共dashed lines兲 and Ge 共dotted lines兲 for g-GeSe4 obtained from ab initio simulations and compared to the XPS 共Ref. 43兲 results. The Fermi level is at E = 0.
共eV兲
A1
A2
A3
B
Experiment GeSe2 Quench from the melt GeSe4 Quench from the melt GeSe9 Decorate SiSe2
−1.38 −1.7 −1.36 −1.4
−3.0 −3.1 −3.16 −2.86
−4.6 −4.6 −4.62 −4.4
−7.8 −7.7 −7.1 −7.3
054206-10
PHYSICAL REVIEW B 71, 054206 共2005兲
MODELS AND MODELING SCHEMES FOR BINARY IV-…
FIG. 14. 共Color online兲 Inverse participation ratio along with the characteristic defect types causing localization of electronic eigenstates in the band gap region of g-GeSe4. The vertical dotted line indicates the position of the Fermi level. The color codes are defined as threefold Ge atoms 共red兲, fourfold Ge atoms 共white兲, threefold Se atoms 共green兲, twofold Se atoms 共orange兲, and onefold Se atoms 共yellow兲.
In order to connect localized eigenstates to particular topological/chemical irregularities we plot in Fig. 14 the IPR in the band gap region along with the defect sites. It is valuable to know how the defect sites manifest themselves in the electronic eigenstates. A close look at the localized states at the band edges shows that the localized states at the top of the valence band are mostly associated with twofold and onefold Se atoms with at least one homopolar bond, whereas the localization at the conduction band edge arises from over-coordinated 共threefold兲 Se atoms involved with at least one homopolar bond and from twofold-coordinated Se atoms involved with at least one wrong bond. A detailed examination shows that the localization of the eigenstates is mostly due to Seu Se bonds—connected with some defect sites. Figure 14 shows the typical defects structures causing the localization of eigenstates in the band gap region.
gap is of the order of 1.73 eV. It is rather interesting that there are no band-gap states in our EDOS. By analogy to g-GeSe2, we can name the principal peaks as A1, A2, A3, and B, respectively. Their values are listed on Table VII. In Fig. 16 we plot I along with the defect types causing localization of electronic eigenstates in the band gap region. The states near the band edge are well localized. It is found that the highest occupied molecular orbital 共HOMO兲 is localized on onefold coordinated Se connected to threefold Se, and on Se2 bridge tetrahedra units. The localization at the conduction band edge is partly due to the over-coordinated Se atoms associated with at least one Seu Se homopolar bond, and one over-coordinated Ge atom connected to threefold Se atoms. In our g-GeSe9 the electronic eigenstates are less localized compared to g-GeSe4 and g-SiSe2.
B. GeSe9 glass
In Fig. 15 we plot the calculated EDOS and the species projected density of states of our model along with the XPS experimental results.43 There is a good agreement between the experiment and the theory. All the relevant experimental features are found also in the calculated EDOS, providing further support for the validity and accuracy of our model. The g-GeSe9 EDOS is very close to the Se EDOS.45 The species projected density of states show that Se atoms contribute most to the spectrum. Hence, the lowest bands 关−15.0, −6.0兴 eV represent essentially the atomic s-like states of Se and Ge. The next band which lies between −6.0 and −2.2 eV contains p-like bonding states. Finally the topmost valence states are predominately nonbonding p-like in nature. Schlüter et al.45 have shown that the lower energy peak in the p-like bonding states of Se represents states involved in intrachain bonding whereas states in the higher energy peak of the p-like bonding states arise in part from hybridization and contribute to the inter-chain bonding in the crystal. This argument holds for our model due to the large contribution of Se in the EDOS. The calculated ⌫ point optical
FIG. 15. Electronic density of states 共solid lines兲 and species projected electronic density of states for Se 共dashed lines兲 and Ge 共dotted lines兲 for g-GeSe9 obtained from ab initio simulations and compared to the XPS 共Ref. 43兲 results. The Fermi level is at E = 0.
054206-11
PHYSICAL REVIEW B 71, 054206 共2005兲
D. N. TAFEN AND D. A. DRABOLD
band composed of both weak-bonding and lone pair states 共above −5 eV兲 arises from O p nonbonding orbitals. D. SiSe2 glass
FIG. 16. 共Color online兲 Inverse participation ratio along with the characteristic defect types causing localization of electronic eigenstates in the band gap region of g-GeSe9. The vertical dotted line indicates the position of the Fermi level. The color codes are defined as threefold Ge atoms 共grey兲, fourfold Ge atoms 共white兲, fivefold Ge atoms 共red兲, threefold Se atoms 共green兲, twofold Se atoms 共orange兲, and onefold Se atoms 共yellow兲.
C. SiO2 glass
Here we report the calculated EDOS for the 648-atom model of g-SiO2. The EDOS 共Fig. 17兲 is in very good agreement with the x-ray photoemission spectra 共XPS兲46,47 and is comparable to the model of Sarnthein and co-workers.48 Experimentally,46,49,50 the electronic structures of crystalline and amorphous SiO2 are known to be very similar. In the occupied states three regions can be distinguished; the lowenergy region at −20 eV is associated with oxygen 2s states. The intermediate-energy region, −11 to − 5 eV, which is strong bonding in character, involves bonding states between Si sp hybrids and O p orbitals; whereas the highest energy
The calculated EDOS and the species projected density of states are reported in Fig. 18. The valence band of the EDOS consists of two main bands. The upper band is from 0 to about −5 eV below the HOMO. For instance the ⌫ point optical gap of our model is of the order of 1.7 eV. As usual in local density approximation calculations, the experimental gap is substantially underestimated. To our knowledge, experimental information about the EDOS is unavailable for g-SiSe2, so the curve in Fig. 18 is actually a prediction. The states can be classified in the following way: the states at about −14 eV are Se s states; the states from −8.3 to − 3.3 eV are bonding states between Si sp3 hybrids and Se p nonbonding orbitals. There is a distinctive peak deriving mainly from Se atoms. The leading peak is attributed to the lone-pair band of Se,45 which is similar to topmost valence band of Se.51 By analogy to GeSe2, four peaks can be identified as A1, A2, A3, and B peaks, respectively. Their values are listed on Table VII. In Fig. 19 we plot the localization of electronic eigenstates for g-SiSe2 in the band gap region. We also plot some of the characteristic defect types causing localization of electronic eigenstates in the band gap region. Eigenstates in the region 关−6 , −5.3兴 eV of the valence band are quite extended, but as one approaches the valence band edge the eigenstates become increasingly localized. At the conduction band edge the states are also localized. As one moves away from the conduction band edge the states become less and less localized. By examining the localized states at the band edges we found that the localized states mostly derive from undercoordinated 共threefold兲 Si atoms and over-coordinated threefold Se atoms involved with Seu Se homopolar bonds. The localized states at the conduction band edge are mostly due to over-coordinated 共threefold兲 Se atoms involved with ho-
FIG. 17. Electronic density of states of gSiO2. The Fermi level is at E = 0.
054206-12
PHYSICAL REVIEW B 71, 054206 共2005兲
MODELS AND MODELING SCHEMES FOR BINARY IV-…
FIG. 18. Predicted electronic density of states 共solid lines兲 and species projected electronic density of states for Se 共dashed lines兲 and Si 共dotted lines兲 for g-SiSe2. The Fermi level is at E = 0.
mopolar bond. The Se and Si IPRs reveal that the localization is more pronounced on Se atoms than on Si. We can conclude that Seu Se wrong bonds cause more localized states than the geometrical defectives structures. VI. COMPOSITION-DEPENDENT TRENDS IN GexSe1−x GLASSES
Having fully analyzed the structural, vibrational, and electronic properties of GeSe4 and GeSe9, we illustrate in this section the composition dependent trends in GexSe1−x glasses. Other studies on the composition dependence of the glass structure have been made using both direct and indirect methods, extended x-ray absorption fine structure 共EXAFS兲,18 x-ray emission52 and Raman spectroscopy.34,53,54 In both experiment and our work, the medium-range order associated with Geu Ge correlations, which is manifested by a FSDP varies as a function of x 共Ge concentration兲. In GeSe9, this peak appears only as a shoulder as opposed to
GeSe4 where it is well pronounced. As x increases the intensity of the FSDP increases and reaches its maximum at x = 0.33. Another relevant measure is the ratio of CS to ES tetrahedra as a function of x. The ratio of CS to ES tetrahedra increases with Ge concentration. In GeSe9 共x = 0.1兲 the structural motifs are Se-chain segments cross-linked by Ge共Se1/2兲4 with negligible ratio of CS to ES tetrahedra. The addition of Ge imposes the disappearance of Se chains and the existence of Ge共Se1/2兲4, and CS and ES tetrahedra. The vibrational density of states of GexSe1−x glasses is also composition-dependent. Since the 共A1-A1c兲 band is associated to the breathing mode tetrahedra Ge共Se1/2兲4, it should vary as a function of Ge concentration. In GeSe9, the A1 band appears as a shoulder due to the small concentration of tetrahedra. As x increases, the A1 mode arises in the gap. In the same way the electronic density of states is function of x. When x increases the intensity of the Ge band increases, but this band remains narrow. On the other hand, the width of the Se band remains constant, but its shape varies. The
FIG. 19. 共Color online兲 Inverse participation ratio along with the characteristic defect types causing localization of electronic eigenstates in the band gap region of g-SiSe2. The vertical dotted lines indicates the position of the Fermi level. The color codes are defined as threefold Si atoms 共red兲, fourfold Si atoms 共yellow兲, threefold Se atoms 共green兲, and twofold Se atoms 共blue兲.
054206-13
PHYSICAL REVIEW B 71, 054206 共2005兲
D. N. TAFEN AND D. A. DRABOLD
splitting between the A1 and A2 peaks becomes smaller, indicating the disappearance of Se chains. This work supports the evidence of connectivity between the concentration of Ge, the atomic ordering associated with IRO, the 共A1-A1c兲 band, and the shape of the Ge and Se bands in GexSe1−x glasses. VII. DISCUSSION AND CONCLUSION
To illustrate the reliability and accuracy of our calculations, we give an example regarding GeSe2. We made models of g-GeSe2 using the decorate and relax method. The features of the models are reported elsewhere.4,6 The topological ordering has been extensively studied using high level calculations. In the first approach the model obtained from FIREBALL has been fully relaxed with the plane wave code VASP 共Ref. 55兲 to the nearest minimum. The second approach consists of annealing the original model using VASP. We observed that in both approaches the coordination number of Se atoms does not change significantly. A direct comparison with the one obtained from FIREBALL shows no meaningful difference. Li and Drabold56 in their study of glassy AsSe have also found the same unexpected Se coordination. XPS experiments57 on bulk glassy As2Se3 specimen prepared via the melt-quench method provide evidence for the existence of Se3 and Se1 as well in concentration up to ⬃20%. In XPS experiments, Antoine et al.57 observed that the two wrongly coordinated Se defects occur in about the same concentration. They found that 22.1%, 59.2%, and 18.7% of Se atoms are, respectively, onefold, twofold, and threefold coordinated. In a related vein, using density functional theory 共DFT兲 to study the liquid GeSe2, Massobrio et al.58 found that as much as 25% of Se atoms were threefold coordinated and 2.2 were, respectively, onefold and fourfold coordinated. These results are somewhat surprising, and further modeling and experiment is needed to clarify the unexpected threefold and onefold Se coordination. We have presented the results of a large scale computer simulation using a different approach from the usual quench from melt scheme for modeling some binary glasses. We have shown that for certain binary IV-VI glasses 共especially silica兲, decoration of bond-centered column VI atoms on tetrahedral amorphous networks leads with appropriate rescaling and relaxation to highly realistic models of the IV-VI binary glasses. We investigated the topological structure, dynamics, and electronic structure of silica and silicon diselenide and compared with the experiments. Excellent agreement is found with the experimental data in the high Q
1 The
Physics and Technology of Amorphous SiO2, edited by R. A. B. Devine 共Plenum, New York, 1988兲. 2 K. Jackson and S. Grossman, Phys. Rev. B 65, 012206 共2001兲. 3 S. Nakhmanson, Ph.D. thesis, Ohio University, 2001; http:// www.phy.ohiou.edu/˜drabold/serge; X. Zhang and D. A. Drabold, Phys. Rev. Lett. 83, 5042 共1999兲.
region for all the S共Q兲 indicating that the short-range order is well reproduced for all configurations. In the low Q region, the appearance of the first sharp diffraction peak 共peak amplitude and position兲 in S共Q兲 and its partials describes the intermediate-range order. In the Bhatia-Thornton concentration-concentration structure factor of g-SiSe2, a FSDP is observed, indicating concentration fluctuations over intermediate-range distances. SiO2 is strikingly good unlike GeSe2, SiSe2 which are good but not nearly so perfect. This may be due to the fact that silica consists entirely of corner sharing tetrahedra since our starting configuration already contains higher number of corner sharing, it makes easier to eliminate the few edge sharing present in the system. A simple decoration scheme works quite well for this system. We also carried out first-principles molecular dynamics simulations to study the properties of GeSe4 and GeSe9. We performed a comparison between the results of our simulation and available experimental data. The comparison comprised the neutron structure factor and the vibrational density of states. The agreement with experiment is very good. We presented a detailed analysis of the atomic structure of these glasses. We found that the Ge-centered tetrahedra are the predominant coordination motifs in g-GeSe4. In g-GeSe9, the structure consists of Se-chain segments which are crosslinked by Ge共Se1/2兲4 tetrahedra. We investigated the intermediate-range order by calculating the partial and the Bathia-Thornton structure factors. We observed a FSDP in each partial and Bhatia-Thornton structure factors of GeSe4. Finally we investigated the electronic properties of these glasses by computing the electronic density of sates and the inverse participation ratio. The IPR shows that the localization in the SiSe2 and GeSe4 glass is mostly due to homopolar bonds than the geometrical defectives structures. ACKNOWLEDGMENTS
We thank the US National Science Foundation for support under Grants Nos. DMR-0074624 and DMR-0205858 and DMR-0310933. We also gratefully acknowledge the support of Axon Technologies, Inc. We especially wish to thank Dr. P. Biswas for many discussions. We thank Dr. Maria Mitkova and Professor Mike Kozicki for collaborations, and Dr. R. L. Cappelletti for helpful discussions. We are grateful to Professor Normand Mousseau for providing us with the 64 and 216 atom WWW cells and also for many helpful discussions. We thank P. Salmon for providing us with the experimental data for GeSe4.
N. Tafen and D. A. Drabold, Phys. Rev. B 68, 165208 共2003兲. Biswas, D. Tafen, and D. A. Drabold, Phys. Rev. B 71, 054204 共2005兲; P. Biswas, D. N. Tafen, R. Atta-Fynn, and D. A. Drabold, J. Phys.: Condens. Matter 16, S5173 共2004兲. 6 D. A. Drabold, J. Li, and D. N. Tafen, J. Phys.: Condens. Matter 15, 1529 共2003兲. 4 D. 5 P.
054206-14
PHYSICAL REVIEW B 71, 054206 共2005兲
MODELS AND MODELING SCHEMES FOR BINARY IV-… 7 M.
Mitkova and M. N. Kozicki, J. Non-Cryst. Solids 299, 1023 共2002兲. 8 N. R. Rao, P. S. R. Krishna, S. Basu, B. A. Dasannacharya, K. S. Sangunni, and E. S. R. Gopal, J. Non-Cryst. Solids 240, 221 共1998兲; N. R. Rao, K. S. Sangunni, E. S. R. Gopal, P. S. R. Krishna, R. Chakravarthy, and B. A. Dasannacharya, Physica B 213 & 214, 561 共1995兲. 9 A. A. Demkov, J. Ortega, O. F. Sankey, and M. Grumbach, Phys. Rev. B 52, 1618 共1995兲. 10 O. F. Sankey and D. J. Niklewski, Phys. Rev. B 40, 3979 共1989兲; O. F. Sankey, D. A. Drabold, and G. B. Adams, Bull. Am. Phys. Soc. 36, 924 共1991兲. 11 For example, J. M. Soler, E. Artacho, J. D. Gale, J. Junquera, P. Ordejón, and D. Sanchez-Portal, J. Phys.: Condens. Matter 14, 2745 共2002兲, and references therein. 12 F. Wooten and D. Weaire, Solid State Physics, edited by H. Ehrenreich, D. Turnbull, and F. Seitz 共Academic, New York, 1987兲, p. 40. 13 G. T. Barkema and N. Mousseau, Phys. Rev. B 62, 4985 共1996兲. 14 I. Petri and P. S. Salmon, Phys. Chem. Glasses 43C, 185 共2002兲. 15 P. Vashishta, R. K. Kalia, J. P. Rino, and I. Ebbsjö, Phys. Rev. B 41, 12 197 共1990兲. 16 C. Massobrio, A. Pasquarello, and R. Car, Phys. Rev. Lett. 80, 2342 共1998兲; Comput. Mater. Sci. 17, 115 共2000兲. 17 S. Susman, K. J. Volin, D. G. Montague, and D. L. Price, J. Non-Cryst. Solids 125, 168 共1990兲. 18 W. Zhou, M. Pasesler, and D. E. Sayers, Phys. Rev. B 43, 2315 共1991兲. 19 G. Lucovsky and T. M. Hayes, Amorphous Semiconductors, edited by M. H. Brodsky 共Springer, Berlin, 1979兲, p. 125. 20 XMOL, version 1.3.1, 1993, Minnesota Supercomputer Center, Inc., Minneapolis, MN 55415. 21 P. A. V. Johnson, A. C. Wright, and R. N. Sinclair, J. Non-Cryst. Solids 58, 109 共1983兲. 22 R. F. Pettifer, R. Dupree, I. Farnan, and U. Sternberg, J. NonCryst. Solids 106, 408 共1988兲. 23 R. L. Mozzi and B. E. Warren, J. Appl. Crystallogr. 2, 164 共1969兲. 24 P. G. Coombs, J. F. De Natale, P. J. Hood, E. K. McElfresh, R. S. Wortman, and J. F. Schackelford, Philos. Mag. A 51, L39 共1985兲. 25 K. Vollmayr, W. Kob, and K. Binder, Phys. Rev. B 54, 15 808 共1996兲. 26 R. W. Johnson, D. L. Price, S. Susman, M. Arai, T. I. Morrison, and G. K. Shenoy, J. Non-Cryst. Solids 83, 251 共1986兲. 27 M. Celino, Ph.D. dissertation, Université Louis Pasteur, Strasbourg, 2002. 28 S. Susman, R. W. Johnson, D. L. Price, and K. J. Volin, Mater. Res. Soc. Symp. Proc. 61, 91 共1986兲. 29 M. Celino and C. Massobrio, Phys. Rev. Lett. 90, 125502 共2003兲. 30 G. A. Antonio, R. K. Kalia, A. Nakano, and P. Vashishta, Phys. Rev. B 45, 7455 共1992兲. 31 M. Cobb, D. A. Drabold, and R. L. Cappelletti, Phys. Rev. B 54, 12 162 共1996兲. 32 B. Effey and R. L. Cappelletti, Phys. Rev. B 59, 4119 共1999兲.
33 W.
A. Kamitakahara, R. L. Cappelletti, P. Boolchand, B. Halfpap, F. Gompf, D. A. Neumann, and H. Mutka, Phys. Rev. B 44, 94 共1991兲. 34 S. Sugai, Phys. Rev. B 35, 1345 共1987兲. 35 P. M. Bridenbaugh, G. P. Espinosa, J. E. Griffiths, J. C. Phillips, and J. P. Remeika, Phys. Rev. B 20, 4140 共1979兲. 36 M. J. Carpenter and D. L. Price, Phys. Rev. Lett. 54, 441 共1985兲. 37 C. T. Kirk, Phys. Rev. B 38, 1255 共1988兲. 38 F. L. Galeener and G. Lucovsky, Phys. Rev. Lett. 37, 1474 共1976兲. 39 A. Kucirková and K. Navrátil, Appl. Spectrosc. 48, 113 共1994兲. 40 M. Arai, D. L. Price, S. Susman, K. J. Volin, and U. Walter, Phys. Rev. B 37, 4240 共1988兲. 41 J. E. Griffiths, M. Malyj, G. P. Espinosa, and J. P. Remeika, Phys. Rev. B 30, 6978 共1984兲; M. Malyj, G. P. Espinosa, and J. E. Griffiths, ibid. 31, 3672 共1985兲. 42 M. Tenhover, M. A. Hazle, and R. K. Grasselli, Phys. Rev. Lett. 51, 404 共1983兲; M. Tenhover, M. A. Hazle, R. K. Grasselli, and C. W. Tompson, Phys. Rev. B 28, 4608 共1983兲; M. Tenhover, R. S. Henderson, D. Lukco, M. A. Hazle, and R. K. Grasselli, Solid State Commun. 51, 455 共1984兲. 43 E. Bergignat, G. Hollinger, H. Chermette, and P. Pertosa, Phys. Rev. B 37, 4506 共1988兲. 44 S. Hino, T. Takaharshi, and Y. Harada, Solid State Commun. 35, 379 共1980兲. 45 M. Schlüter, J. D. Joannopoulos, and M. L. Cohen, Phys. Rev. Lett. 33, 89 共1974兲; N. J. Shevchik, J. Tejeda, M. Cardona, and D. W. Langer, Solid State Commun. 12, 1285 共1973兲. 46 B. Fischer, R. A. Pollak, T. H. DiStefano, and W. D. Grobman, Phys. Rev. B 15, 3193 共1977兲. 47 R. B. Laughlin, J. D. Joannopoulos, and D. J. Chadi, Phys. Rev. B 20, 5228 共1979兲. 48 J. Sarnthein, A. Pasquarello, and R. Car, Phys. Rev. Lett. 74, 4682 共1995兲. 49 H. R. Phillip, Solid State Commun. 4, 73 共1966兲; J. Phys. Chem. Solids 32, 1935 共1971兲. 50 E. Loh, Solid State Commun. 2, 269 共1964兲; G. Klein and H. U. Chun, Phys. Status Solidi B 49, 167 共1972兲. 51 K. S. Liang, J. Non-Cryst. Solids 18, 197 共1975兲. 52 S. B. Mamedov, N. D. Aksenov, L. L. Makarov, and Y. F. Batrakov, J. Non-Cryst. Solids 195, 272 共1996兲. 53 X. Feng, W. J. Bresser, and P. Boolchand, Phys. Rev. Lett. 78, 4422 共1997兲. 54 Y. Wang, O. Matsuda, K. Inoue, O. Yamamuro, T. Matsuo, and K. Murase, J. Non-Cryst. Solids 232–234, 702 共1998兲. 55 G. Kresse and J. Furthmüller, Phys. Rev. B 54, 11 169 共1996兲; Comput. Mater. Sci. 6, 15 共1996兲; see also http:// cms.mpi.univie.ac.at/vasp. 56 J. Li and D. A. Drabold, Phys. Rev. B 61, 11 998 共2000兲; 64, 104206 共2001兲. 57 K. Antoine, J. Li, D. A. Drabold, H. Jain, M. Viček, and A. C. Miller, J. Non-Cryst. Solids 326, 248 共2003兲. 58 C. Massobrio, A. Pasquarello, and R. Car, Phys. Rev. B 64, 144205 共2001兲.
054206-15