Ŕ periodica polytechnica Electrical Engineering 51/3-4 (2007) 111–118 doi: 10.3311/pp.ee.2007-3-4.05 web: http:// www.pp.bme.hu/ ee c Periodica Polytechnica 2007
Models for predicting the performance of ASP.NET Web applications Ágnes Bogárdi-Mészöly / Tihamér Levendovszky / Hassan Charaf
RESEARCH ARTICLE Received 2007-10-03
Abstract The most common consideration of web-based information systems is performance. Performance metrics depend on many factors. The first goal of our work is to analyse how some of them affect the response time. Our results have shown that the thread pool properties and the queue size limits are performance factors. In addition, the distribution of the response time has been determined. With the help of properly designed performance models and evaluation algorithms, the performance metrics of a system can be determined at the early stages of the development process. The second goal of our work is to predict the response time, the throughput, and the tier utilization of ASP.NET web applications, based on queueing models handling one and multiple session classes. In addition, web applications have been tested with concurrent user sessions to validate the models in different versions of the ASP.NET environment. Keywords Performance factor · queueing model · performance prediction Acknowledgement The authors would like to express their thanks to Prof. Takeshi Hashimoto for his support (Shizuoka University, Department of Electrical & Electronics Engineering, Hamamatsu, Japan).
Ágnes Bogárdi-Mészöly Department of Automation and Applied Informatics, BME, 1111 Budapest, Goldmann György tér 3., Hungary e-mail:
[email protected] Tihamér Levendovszky Department of Automation and Applied Informatics, BME, 1111 Budapest,
Goldmann György tér 3., Hungary e-mail:
[email protected] Hassan Charaf
Department of Automation and Applied Informatics, BME, 1111 Budapest, Goldmann György tér 3., Hungary e-mail:
[email protected]
Models for predicting the performance of ASP.NET Web applications
1 Introduction
Developing web-based information systems is not the only issue anymore: operating, maintenance, and performance questions have become of key importance. One of the most important factors is performance, because network systems face a large number of users, they must provide high-availability services with low response time, while they guarantee a certain level of throughput. These performance-related requirements of a web application are often recorded in a Service Level Agreement (SLA). These performance metrics depend on many factors. Several papers have investigated various configurable parameters, how they affect the performance of a web-based information system. Statistical methods, hypothesis tests have been used in order to retrieve factors influencing the performance. An approach [1] applies analysis of variance. The performance-related problems emerge very often only at the end of a software project. With the help of properly designed performance models, the performance metrics of a system can be determined at the earlier stages of the development process [2]. In the past few years several methods have been proposed to address this goal. A group of them is based on queueing networks or extended versions of queueing networks [3] [4] [5]. Another group uses Petri-nets or generalized stochastic Petrinets [6] [7]. The third proposed approach uses a stochastic extension of process algebras, like TIPP (Time Processes and Performability Evaluation) [8], EMPA (Extended Markovian Process Algebra) [9], and PEPA (Performance Evaluation Process Algebra) [10]. Today one of the most prominent technologies of distributed and web-based information systems is Microsoft .NET. Our first goal was to investigate factors influencing the performance. A web application has been tested with concurrent user sessions, focusing on the effect of the different thread pool properties, the global and the application queue size limits, and the measurement results are analysed using statistical methods. Our second goal was to predict the performance metrics based on queueing models handling one and multiple session classes. The paper is organized as follows. Section 2 covers backgrounds and related work. Section 3 describes our performance
2007 51 3-4
111
measurements. Section 4 demonstrates the issue of the performed independence tests and determines the distribution of the response time. Section 5 presents the estimation of the model parameters, the prediction of the performance metrics, and the experimental validation of the models in different versions of the ASP.NET environment. Finally, Section 6 presents our conclusions and future work. 2 Backgrounds and Related Work
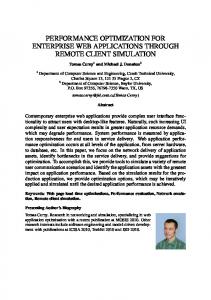
An application server has several settings which can affect the performance [11]. As illustrated in Fig. 1, the request of the client goes through several subsystems before it is served. From the Internet Information Services (IIS), the accepted HTTP connections are placed into a named pipe. This is a global queue between IIS and ASP.NET, where requests are posted from native code to the managed thread pool. The global queue is managed by the process that runs ASP.NET, and it is configured by the processModel requestQueueLimit property. When the limit is reached, the requests are rejected with a HTTP error 503. From the named pipe, the requests are placed into an application queue (also known as virtual directory queue). There is one queue for each virtual directory. The number of requests in these queues increases if the number of available workers and I/O threads falls below the limit specified by httpRuntime minFreeThreads property. The application queue limit is configured by the httpRuntime appRequestQueueLimit property. When this limit is exceeded, the requests are rejected with a HTTP error 503.
Fig. 1. Architecture of ASP.NET
When an application pool receives requests faster, than it can handle, the unprocessed requests might consume all of the memory, slowing the server and preventing other application pools from processing requests. This can happen, when the queue size limit is large and requests are coming in at a rapid rate or in case of a denial of service (DoS) attack. The size of the global queue and the size of the application queue must be limited to prevent requests from consuming all the memory for the server and for an application queue. The maxWorkerThreads attribute means the maximum number of worker threads, the maxIOThreads parameter is the maximum number of I/O threads in the .NET thread pool (automatically multiplied by the number of available CPUs). The minFreeThreads attribute limits the number of concurrent requests, 112
Per. Pol. Elec. Eng.
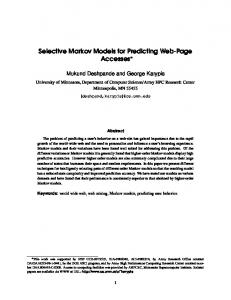
because all incoming requests will be queued if the number of available threads in the thread pool falls below the value for this setting. The minLocalRequestFreeThreads parameter is similar to minFreeThreads, but it is related to requests from localhost (for example a local web service call). These two attributes can be used to prevent deadlocks by ensuring that a thread is available to handle callbacks from pending asynchronous requests. According to the connections and limitations, the partition of the .NET thread pool is shown in Fig. 2.
.NET Thread Pool Free Worker
I/O Local Request Free
Fig. 2. Partitioning the threads in the .NET thread pool
Queueing theory [3] is one of the key analytical modelling techniques used for computer system performance analysis. Queueing networks and their extensions (such as queueing Petri nets [12]) are proposed to model web applications [4] [5] [13]. In [5], a basic queueing model with some enhancements is presented for multi-tier web applications. An application is modelled as a network of M queues: Q 1 , ..., Q M (Fig. 3). Each queue represents an application tier. A request can take multiple visits to each queue during its overall execution, thus, there are transitions from each queue to its successor and its predecessor as well. Namely, a request from queue Q m either returns to Q m−1 with a certain probability pm , or proceeds to Q m+1 with the probability 1 − pm . There are only two exceptions: the last queue Q M , where all the requests return to the previous queue ( p M = 1) and the first queue Q 1 , where the transition to the preceding queue denotes the completion of a request. Sm denotes the service time of a request at Q m (1 ≤ m ≤ M).
Fig. 3. Modelling a multi-tier web application using a queueing network
Internet workloads are usually session-based. The model can handle session-based workloads as an infinite server queueing system Q 0 that feeds the network of queues and forms the closed Ágnes Bogárdi-Mészöly / Tihamér Levendovszky / Hassan Charaf
queueing network depicted in Fig. 3. Each active session is in accordance with occupying one server in Q 0 . The time spent at Q 0 corresponds to the user think time Z . It is assumed that sessions never terminate. An enhancement of the baseline model [5] can handle multiple session classes. Incoming sessions of a web application can be classified into multiple (C) classes. N is the total number of sessions as previously, and Nc denotes the number of sessions P of class c, thus, N = C c=1 Nc . A feasible population with n sessions means that the number of sessions within each class c is between 0 and Nc , and the sum of the number of sessions in all classes is n. In order to evaluate the model, the service times, the visit ratios, and the user think time must be measured on a per-class basis. The model can be evaluated for a given number of concurrent sessions N . A session in the model corresponds to a customer in the evaluation algorithm. The MVA algorithm for closed queueing networks [3] [14] iteratively computes the average response time of a request and the throughput. The algorithm introduces the customers into the queueing network one by one, and the cycle terminates when all the customers have been entered. In addition, the utilization of the queues can be determined from the model, using the utilization law [3]. The utilization of the queue m is Um = X Vm Sm , where X is the throughput and Vm is the visit number (the number of visits to Q m made by a request during its processing). MVA is a recursive algorithm. Handling one session class for large values of customers, or if the performance for smaller values is not required, MVA can be too expensive computationally. If we handle multiple session classes, the time and space complexities of MVA are proportional to the number of feasible populations, and this number rapidly grows for relatively few classes and jobs per class. Thus, it can be worth using an approximate MVA algorithm [3] or a set of two-sided bounds [3] [15]. These bounds referred to as balanced job bounds are based on the issue that a balanced system has a better performance than a similar unbalanced system. A system without a bottleneck device is called a balanced system, in other words, the total service time demands are equal in all queues. The balanced job bounds are very tight, the upper and lower bounds are very close to each other as well as to the real performance. 3 Performance Measurements
The web server of our test web application was IIS 6.0. The server runs on a 2.8 GHz Intel Pentium 4 processor with HyperThreading technology enabled. It had 1GB of system memory; the operating system was Windows Server 2003 with Service Pack 1. The clients ran on another PC on a Windows XP Professional computer with Service Pack 2. They run on a 3 GHz Intel Pentium 4 processor with Hyper-Threading technology enabled, and it also had 1GB system memory. The connection among the computers was provided by a 100 Mb/s network. The emulation of the browsing clients and measuring the response time Models for predicting the performance of ASP.NET Web applications
was performed by ACT (Application Center Test) and JMeter. Virtual users send a list of HTTP requests to the web server concurrently. ACT is a stress testing tool included in Visual Studio .NET Enterprise and Architect Editions. The test script can be recorded or manually created. Each test run has warm-up time for the load to reach a steady-state. In the user scenario, random sleep times are included to simulate the realistic usage of the application. JMeter is an open source load tester. The test can be created on a graphical interface. Each virtual user inserts an exponentially distributed think time between its requests with mean 4 seconds. The threads started gradually, in a 50 seconds interval. With the help of JMeter, the measurement process can be automated easily. There were two environments. In the first environment, the application server was ASP.NET 1.1 runtime environment, the database management system was Microsoft SQL Server 2000 with Service Pack 3. In the second environment, ASP.NET 2.0 and Microsoft SQL Server 2005 with Service Pack 1 were used. Three-tier ASP.NET test web applications have been implemented in different versions of the ASP.NET environments (Fig. 4). Compared to a typical web application, they have been slightly modified to suit the needs of the measurement process. Presentation layer
ASP.NET web forms
Business logic layer
C# classes
Data access layer
ADO.NET
Database layer
SQL server
Fig. 4. The test web application architecture
4 Methods for Retrieving and Investigating Performance Factors
According to the connections and limitations, the settings of our measurements are demonstrated in details in Table 1 and Table 2. One line means one set of measurements. In each set, one of the parameters is changed in the noted interval, the others are held on default (d) or recommended (r) values. HyperThreading technology is enabled on the processor of the server. Thus, it seems to have two processors, although physically there is only one processor. Therefore, the recommended values [11] which are automatically multiplied by the number of processors, are divided by two. With the values in Table 2, it is expected that both the saturation of the global and the application queues can be observed. During the measurements, the number of simultaneous browser connections was 50, while firstly the thread pool properties, secondly the global and the application queue limits are varied. The response time, the throughput, and the rate of unsuccessful requests were measured. Furthermore, the CPU utilization and available memory are monitored with the help of
2007 51 3-4
113
Tab. 1. Settings of the thread pool properties (the global and the application queue limits are held on default values) maxWorkerThreads
maxIOThreads
minFreeThreads
5-104
20 (d)
8 (d)
4 (d)
20 (d)
5-104
8 (d)
4 (d)
50 (r)
50 (r)
4-92
4 (d)
50 (r)
50 (r)
88 (r)
2-88
the integrated counters. The results of the measurement process are analysed using statistical methods [3] with the help of MATLAB. Tab. 2. Settings of the global and the application queue limits (the thread
pool properties are held on default values) requestQueueLimit
appRequestQueueLimit
30-69
100 (d)
5000 (d)
5-44
the null hypothesis when in fact it is true. In case of maxIOThreads and minFreeThreads the null hypothesis is rejected at 0.05 level of significance. In other words, in 5 % or 1/20 cases we will reject the null hypothesis when it should be accepted. Therefore, these can be enough evidence to reject the H0 hypothesis in case of every parameter. Tab. 3. The detailed results of the executed chi square statistics Input Worker
4.1 Searching Factors Influencing the Performance
The chi square test of independence must be performed to investigate whether each input and output are independent (whereas in case of other inputs the default or recommended values are preserved). The inputs are maxWorkerThreads, maxIOThreads, minFreeThreads, minLocalRequestFreeThreads, requestQueueLimit, and appRequestQueueLimit; the investigated output is the response time. The inputs (individual values) are classified into categories according to the increasing order with the same number of values. Since the output follows a continuous distribution, it is discretized. Practically intervals of equal lengths and intervals with integer endpoints are used. The length of intervals is enlarged, we would like to see as many values more than 5-6 as possible, according to the recommendations. The null hypothesis (H0 ) is: There is no relationship between each input and output (variables are independent). Alternate hypothesis (H1 ) is the following: There is a relationship between them (variables are dependent). The chi square statistic is χ2 =
X i, j
(Oi j − E i j )2 , Ei j
(1)
where Oi j is the observed frequency and E i j is the expected frequency under the assumption ki. ∗ k. j . (2) N The detailed results are depicted in Table 3. In cases of the maxWorkerThreads, requestQueueLimit, and appRequestQueueLimit parameters, the null hypothesis is rejected at every acceptable level of significance, because the chi square statistic is larger than the critical values belonged to each acceptable level of significance. In case of the minLocalRequestFreeThreads the null hypothesis is rejected at 0.01 level of significance. This means that in 1 % or 1/100 cases we will reject Ei j =
114
minLocalRequestFreeThreads
Per. Pol. Elec. Eng.
Chi square statistic
Degrees of freedom
Alpha
Critical value
35.2273
12
0.0005
34.8213
False
21.0261 23.3367
False True
H0
I/O
22.9695
12
0.05 0.025
Free
17.9158
9
0.05 0.025
16.919 19.0228
False True
Local Free
22.7033
9
0.01 0.005
21.666 23.5894
False True
Global
39.4053
6
0.0005
24.1028
False
Application
46.1099
6
0.0005
24.1028
False
In IIS 5.0, ASP.NET makes use of the I/O threads first, only then it will jump over to the working threads and start to make use the working threads. In IIS 6.0, worker threads have taken the role of I/O threads, and I/O threads are only related to I/O calls. Thus, the response time depends on the number of I/O threads ‘less’ than worker threads. Theorem 1 The .NET thread pool limits (maxWorkerThreads, maxIOThreads, minFreeThreads, and minLocalRequestFreeThreads), as well as the global and the application queue size limits (requestQueueLimit and appRequestQueueLimit) are performance factors, what is proven by a statistical method, namely, the chi square test of independence. 4.2 Determining the Distribution of the Response Time
The simplest way of the determination is to plot a histogram of the observed response times (Fig. 5). But there is a key problem with histogram: depending upon the used bin size, it is possible to draw very different conclusions. A better technique is to plot the observed quantiles versus the theoretical quantiles in a quantile-quantile plot. The applied theoretical distribution is normal distribution according to the conjecture from histograms. If the distribution of observed response times is normal, the plot will be close to linear. The result plot can be seen in Fig. 5. Based on the data, the response times do appear to be normally distributed.
Ágnes Bogárdi-Mészöly / Tihamér Levendovszky / Hassan Charaf
Fig. 5. Histogram (uses 20 bins), quantile-quantile plot and normal probability plot
The test of normality can be executed graphically using the normal probability plot. If the data comes from a normal distribution, the plot will appear linear (other probability density functions will introduce curvature in the plot). The normal probability plot of the response times is shown in Fig. 5. The data follows a straight line but departs from it at ends. This means that the data has longer tails than the normal distribution. The test of normality can be performed numerically with the help of certain hypothesis tests. The Bera-Jarque test [16] statistic is based on estimates of the sample skewness and kurtosis. The test evaluates the hypothesis that the response time is normal with unspecified mean and variance, against the alternative that response time is not normally distributed. The detailed results are represented in Table 4. In most cases the null hypothesis is true at every acceptable level of significance (in case of minFreeThreads the null hypothesis is rejected only at 0.01 level of significance). This would mean that the response time follows a normal distribution. But this test is an asymptotic test, thus care should be taken with small sample sizes. Tab. 4. The detailed results of the performed Bera-Jarque tests Parameter
Test statistic
Alphas
Critical value
H0
Worker
1.0069
0.1
4.6052
True
I/O
1.4451
0.1
4.6052
True
Free
7.1708
0.025 0.05
7.3778 5.9915
True False
Local Free
1.4786
0.1
4.6052
True
Models for predicting the performance of ASP.NET Web applications
Tab. 5. The detailed outcomes of the executed Lilliefors tests Parameter
Test statistic
Alphas
Critical value
H0
Worker
0.143
0.1
0.184
True
I/O
0.1507
0.1
0.201
True
Free
0.1554
0.1
0.184
True
Local Free
0.1644
0.1
0.184
True
The hypotheses of the Lilliefors test [17] are the same. The test compares the empirical cumulative distribution function of the response time (S(x)) with a normal cumulative distribution function having the same mean and variance as response time (C D F). The test statistic is T = max |S(x) − C D F| .
(3)
The detailed outcomes are described in Table 5. The null hypothesis is true at every acceptable level of significance. This test is not asymptotic, thus, the response time is unambiguously normal. Theorem 2 The response time tends to a normal distribution in case of all four thread pool parameters (namely, maxWorkerThreads, maxIOThreads, minFreeThreads and minLocalRequestFreeThreads), what is proven by a statistical method, namely, the Lilliefors hypothesis test.
2007 51 3-4
115
5 Models for Predicting the Performance
The queueing models have been demonstrated and validated in ASP.NET environments. Firstly, the input values of the model parameters have been estimated from one measurement. Secondly, the MVA and approximate MVA algorithms, along with the calculation of the balanced job bounds have been implemented with the help of MATLAB, and the models have been evaluated to predict the response time, the throughput, and the tier utilization. Finally, typical web applications have been tested with concurrent user sessions, comparing the observed and predicted values in order to validate the models in the ASP.NET environments. 5.1 Estimating the Model Parameters
The web applications were designed in a way that the input values of the model parameters can be determined from the results of one measurement. Each page and class belonging to the presentation, business logic or database was measured separately. Handling one session class, the input parameters of the model are the number of tiers, the maximum number of customers (simultaneous browser connections), the average user think time Z¯ , the visit number Vm and the average service time S¯m for Q m (1 ≤ m ≤ M). During the measurements, the number of tiers was constant (three). The maximum number of customers means that the load was characterized as follows: we started form one simultaneous browser connection, then we continued with two, until 52 had been reached. In order to determine the average user think time, the sleep times in the user scenario were averaged. To determine Vm , the number of requests of each page and class belonging to the given tier in the user scenario was summed. To estimate S¯m , the service times of each page and class belonging to the given tier were averaged. Handling multiple session classes, the input model parameters are the number of tiers, the number and the maximum number of customers, respectively, on a per-class basis, the average user think time Z¯ c , the visit number Vm,c , and the average service time S¯m,c for Q m (1 ≤ m ≤ M, 1 ≤ c ≤ C ). There were two classes. The number of sessions for one class was constant 10, while the number of simultaneous browser connections for the other class varied up to a maximum number of customers. The load was characterized as follows: we started from one simultaneous browser connection then we continued with 5, 10, until 70 had been reached. To determine Z¯ c , the sleep times in the user scenario were averaged per class. In order to determine Vm,c , the number of requests of each page and class belonging to the given tier and class in the user scenario was summed. In order to estimate S¯m,c , the service times of each page and class belonging to the given tier and class were averaged. 5.2 Model Evaluation
The MVA and approximate MVA algorithm for closed queueing networks, along with the calculation of the balanced job 116
Per. Pol. Elec. Eng.
bounds have been implemented with the help of MATLAB. Handling one session class, the inputs of the script are the number of tiers, the maximum number of customers, the average service times, the visit numbers, and the average user think time. Handling multiple session classes, the inputs the number of tiers, the number and the maximum number of customers, respectively, on a per-class basis the average service times, the visit numbers, and the average user think time. The scripts predict the response times, the throughputs and the tier utilizations up to a maximum number of customers. MVA provides a recursive way, approximate MVA computes these in a few steps, while balanced job bounds method completes in one step. 5.3 Model Validation
Finally, our experimental validation of the model in different versions of the ASP.NET environment are demonstrated. Handling one session class, while the number of simultaneous browser connections varied, the average response time and throughput per class were measured (Fig. 6). Handling multiple session classes, there were two classes of sessions: a database reader and a database writer. The number of simultaneous browser connections of one class was fixed at 10, while the number of simultaneous browser connections of the other class varied, and the average response time and throughput were measured per class.
Fig. 6. The observed response time and throughput handling one session class
Fig. 8. The tier utilization handling one session class with MVA
The results correspond to the common shape of response time and throughput performance metrics. Increasing the number of concurrent clients, the throughput grows linearly, while the average response time advances barely. After the saturation the throughput remains approximately constant, and an increase in the response time can be observed. In the overloaded phase, the throughput falls, while the response time becomes unacceptably high. Ágnes Bogárdi-Mészöly / Tihamér Levendovszky / Hassan Charaf
Fig. 7. The observed and predicted response times and throughputs handling one session class with MVA
Fig. 9. The observed and predicted response times and throughputs handling one session class with balanced job bounds
Handling one session class, we experimentally validated the model to demonstrate its ability to predict the response time and the throughput of ASP.NET web applications with MVA (Fig. 7), and approximate MVA algorithm. We have found that the model handling one session class predicts the response time and throughput acceptably. Moreover, from the model, the utilization of the tiers can be predicted. The results are depicted in Fig. 8. The presentation tier is the first that becomes congested. The utilization of the database queue is the second (29%), and the utilization of the business logic queue is the last one (17%). Thereafter, we demonstrate that the response time, the throughput and the tier utilization of ASP.NET web applications move within tight upper and lower bounds (Fig. 9). We have found that the response time, the throughput, and the queue utilization from the observations fell into the upper and lower bounds. Thus, the balanced job bounds handling one session class predict the response time, the throughput, and the utilization of the tiers acceptably. Finally, the model handling multiple session classes was experimentally validated. We have found that the model predicts the response time and throughput with approximate MVA acceptably (Fig. 10). While the presentation tier is congested, the utilization of the database queue is about 84%, and the utilization of the business logic queue is about 16% (Fig. 11). We have found that the response time, the throughput, and the utilization from the observations as well as from the approximate MVA fell into the upper and lower bounds. Hence, the balanced job bounds predict the response time, the throughput, and the utilization acceptably. Theorem 3 The models predict the response time, the throughput, and the tier utilization within an error rate. The validity of the queueing models handling one and multiple session classes has been proven by measurements in ASP.NET environment. Models for predicting the performance of ASP.NET Web applications
6 Conclusions and Future Work
A web application has been tested with concurrent user sessions in order to statistically analyse the effect of the thread pool properties, the global and the application queue size limits. Our results have shown that the maxWorkerThreads, maxIOThreads, minFreeThreads, minLocalRequestFreeThreads, requestQueueLimit, and appRequestQueueLimit parameters have a considerable effect on the performance, in other words, they are performance factors. The distribution of the response time has been determinded as a function of each thread pool property. The normality has been intuitively founded by graphical methods, and has been proven with hypothesis tests. The normality of the response time facilitates to construct model. Queueing models handling one and multiple session classes have been demonstrated and validated in different versions of the ASP.NET environment, namely, the input model parameters have been estimated from one measurement, the MVA and approximate MVA evaluation algorithms, and the calculation of the balanced job bounds have been implemented with the help of MATLAB, the models have been evaluated to predict performance metrics, and a measurement process has been executed in order to experimentally validate the models. Our results have shown that the models handling one and multiple session classes predict the response time and the throughput acceptably with the MVA and approximate MVA evaluation algorithms, along with the calculation of balanced job bounds. In order to improve the model, the performance factors retrieved above must be handled along with other features. The extension of the model and the validation of the enhanced models are subjects of future work.
2007 51 3-4
117
Fig. 10. The observed and predicted response times and throughputs handling multiple session classes with approximate MVA
Fig. 11. The tier utilization handling multiple session classes with approximate MVA
References
14 Reiser M, Lavenberg SS, Mean-Value Analysis of Closed Multichain
1 Sopitkamol M, Menascé DA, A Method for Evaluating the Impact of Software Configuration Parameters on E-commerce Sites, ACM 5th International Workshop on Software and Performance, 2005, pp. 53–64. 2 Smith CU, Performance Engineering of Software Systems, Addison-Wesley, 1990. 3 Jain R, The Art of Computer Systems Performance Analysis, John Wiley and Sons, 1991. 4 Menascé DA, Almeida V, Capacity Planning for Web Services: Metrics, Models, and Methods, Prentice Hall PTR., 2001. 5 Urgaonkar U, Dynamic Resource Management in Internet Hosting Platforms, Massachusetts, 2005. Dissertation. 6 Bernardi S, Donatelli S, Merseguer J, From UML Sequence Diagrams
Queuing Networks, Association for Computing Machinery 27 (1980), 313– 322. 15 Zahorjan J, Sevcik KC, Eager DL, Galler B, Balanced Job Bound Analysis of Queueing Networks, Communications of the ACM 25 (1982), no. 2, 134–141. 16 Bera AK, Jarque CM, Efficient test for normalitiy, homoscedasticity and serial independence of regression residuals, Economics Letters 6 (1980), no. 3, 255–259. 17 Lilliefors H, On the Kolmogorov-Smirnov test for normality with mean and variance unknown, Journal of the American Statistical Association 62 (1967), 399–402.
and Statecharts to Analysable Petri Net Models, ACM International Workshop Software and Performance, 2002, pp. 35–45. 7 King P, Pooley R, Derivation of Petri Net Performance Models from UML Specifications of Communication Software, 25th UK Performance Eng. Workshop., 1999. 8 Herzog U, Klehmet U, Mertsiotakis V, Siegle M, Compositional Performance Modelling with the TIPPtool, Performance Evaluation 39 (2000), 5– 35. 9 Bernardo M, Gorrieri R, A Tutorial on EMPA: A Theory of Concurrent Processes with Nondeterminism, Priorities, Probabilities and Time, Theoretical Computer Science 202 (1998), 11–54. 10 Gilmore S, Hillston J, The PEPA Workbench: A Tool to Support a Process Algebra-Based Approach to Performance Modelling, 7th International Conference Modelling Techniques and Tools for Performance Evaluation, 1994, pp. 353–368. 11 Meier JD, Vasireddy S, Babbar A, Mackman A, Improving .NET Application Performance and Scalability (Patters & Practices), Microsoft Corporation, 2004. 12 Kounev S, Buchmann A, Performance Modelling of Distributed EBusiness Applications using Queuing Petri Nets, IEEE International Symposium on Performance Analysis of Systems and Software, Austin, Texas, USA, March, 2003, 2003. 13 Smith CU, Williams LG, Building responsive and scalable web applications, Computer Measurement Group Conference, 2000, pp. 127–138.
118
Per. Pol. Elec. Eng.
Ágnes Bogárdi-Mészöly / Tihamér Levendovszky / Hassan Charaf