December, 2013
Agric Eng Int: CIGR Journal
Open access at http://www.cigrjournal.org
Vol. 15, No.4
293
Moisture-dependent physical and mechanical properties of hawthorn (Crataegus aronia) Zahra Azizi, Ali Nejat Lorestani*, Farzad Jaliliantabar , Zeinab Azizi (Agricultural Machinery Department, Faculty of Agriculture, Razi University, Kermanshah, Iran) Abstract: In this study, some important physical and mechanical properties of the hawthorn and the effect of moisture on them were investigated. The effect of moisture at two levels (64.01% and 70.1%, w.b.) on the geometric dimensions (length, width, thickness, arithmetic mean diameter, geometric mean diameter, degree of sphericity, surface area, projected area, criteria projected area, mass, volume and the apparent), true density, porosity, coefficient of static friction and coefficient of rolling on three levels (wood, glass and galvanized) and mechanical properties obtained by impact testing machine using a randomized factorial design was evaluated by software SPSS18. Results indicate that moisture has an effect on the physical properties of the hawthorn.
The moisture content of 70.1% of all physical properties except the true density and porosity values is greater
than 64.01% moisture there. decreased.
Coefficient of static friction with increasing moisture increased and coefficient of rolling
Moisture has an effect on the mechanical properties of hawthorn also.
With increasing moisture, all the
mechanical properties except dL in Fmax decreased (dL is changing the shape of the force and Fmax is the maximum force). Keywords: hawthorn, physical properties, maximum force at impact, mechanical properties, moisture content Citation: Azizi, Z., A. N. Lorestani, F. Jaliliantabar, and Z. Azizi. 2013. Moisture-dependent physical and mechanical properties of hawthorn (Crataegus aronia). Agric Eng Int: CIGR Journal, 15(4): 293-299.
1
separation, drying and other processes required to appear.
Introduction
There is little information on the physical properties of
Hawthorn (Crataegus aronia), a prickly plant that
the hawthorn.
The purpose of this study was to evaluate
normally reaches five feet in length grows on sunny
the physical and mechanical properties of hawthorn in the
slopes of mountains and forest lands throughout the world
moisture level of 64.01% and 70.1% and effects of
(www. Pezeshk. Us).
moisture content on physical and mechanical properties.
Determining the physical and mechanical properties of agricultural products as the basis for the design and
2 Materials and methods
manufacture of machinery and transport equipment as
Many hawthorns (unripe and ripe) were purchased
well as grading and processing of agricultural products,
from local market in Iran (Kermanshah) and were
has always been considered.
transferred to the university laboratory properties.
To primarily design for
One
agricultural machinery, regardless of the parameters will
hundred and twenty hawthorns were randomly selected
be incomplete and lead to poor results (Tavakkoli
from each category to determine moisture content, and
Hashtjin, 2003).
the samples were put into an oven at 104°C for 24 hours.
Measurement of physical and mechanical properties of hawthorn for the proper design for handling, transport,
Experiments were performed at room temperature. To measure the dimensions of hawthorn, 120 hawthorns were randomly selected first and then later
Received date: 2013-09-23 Accepted date: 2013-11-20 * Corresponding author: Ali Nejat Lorestani, Agricultural Machinery Department, Faculty of Agriculture, Razi University, Kermanshah. Email:
[email protected].
measured using a 0.01 mm size caliper. Accurate mass was measured using a digital scale with 0.1 g.
The
following formula was used to calculate the mean
294
December, 2013
Agric Eng Int: CIGR Journal
Open access at http://www.cigrjournal.org
diameters (Mohsenin, 1980):
The following formula was used to calculate the
Dg ( a.b.c)1/3
(1)
abc 3
(2)
Da
porosity (Mohsenin, 1980; Jalilian Tabar and Lorestani, 2012): 1 b 100 t
where, Dg is the geometric mean diameter, mm; Da is the
0.51 and for moisture70.1 (g/mL) was equal to 0.45.
the width, mm and c is the thicken, mm.
To measure the coefficient of static friction and the
To determine the coefficient of spherical formula
coefficient of rolling, the static coefficient of friction
provided by Mohsenin (1980) was used: Dg a
(8)
Mass density for moisture 64.01 (g/mL) was equal to
arithmetic mean diameter, mm; a is the length, mm; b is
sph
Vol. 15, No.4
measuring device was used in the laboratory. (3)
100
Surface area and of the fruit were criteria projected
These
coefficients were measured at three levels of wood, galvanized and glass.
To measure the coefficient of
area calculated by using the following relationship
rolling, hawthorn was placed on the device.
(Mohsenin, 1980):
hawthorn turns on the surface, the device uses sensors S ( Dg ) 2
cpA
(4)
PA PB PC 3
When the
embedded in it, giving us the coefficient of rolling.
To
measure the coefficient of static friction, first metal cube (5)
that has no head and the bottom, was placed on a ramp
where, S is the surface area, mm2; cpA is the criteria
and hawthorn was placed inside it.
projected area, mm2; PA is the surface vertical to a, mm2;
as the electric was increased to move the cube down
PB is the surface vertical to b and PC is the surface
(Cube is not in contact with the ramp) (Fraser et al., 1978;
2
Angle of the ramp,
Shepherd and Bhardwaj, 1986; Dutta et al., 1988; Nimkar
vertical to c, mm . The appearance (Ra) was obtained from the following equation: (Altuntas et al., 2005)
et al., 2005).
The experiments were repeated with 20
coefficients.
a Ra 100 b
To obtain mechanical parameters such as modulus of
(6)
elasticity, impact testing device that is connected to a
To calculate the volume and true density of fruit (ρt)
computer was used.
To help test the software
the water displacement method was used (Mohsenin,
configuration and chart of the applied force-deformation
1980).
were recorded for each test.
To obtain the criteria projected area the device
was used to measure leaf area meter and levels were measured in the perpendicular direction.
horizontal and vertical velocities in this system 10, 15 and
To measure the mass density, mass and volume of the container was filled with hawthorn .
Fruits with constant
speed were thrown from a height 150 mm. Fruits pouring from a height of 150 mm with the container during filling, cause effects of sedimentation during store (Kashaninejad
et al., 2006). was removed.
After filling the container, additional fruit Experiments with five replicates were
performed to determine the density. Mass density of the grain mass (mb, g) ratio within the total volume (Vt, mL) was calculated using the following
20 mm min-1 each with six replicates are obtained.
3
Results and discussion Summary analysis of variance testing on the physical
properties of hawthorn in Table 1 is presented. Statistical analysis of the effect of moisture on the geometric
dimensions
(length,
width,
thickness,
arithmetic mean diameter, geometric mean diameter, levels image, mass, volume, degree of sphericity, surface area, criteria projected area and the appearance) showed
equation (Mohsenin,1980):
b
Mechanical parameters of the fruit in both the
mb Vt
significant differences between the figures (at 5% level) (7)
(Askari Asli-Ardeh et al., 2011).
December, 2013
Moisture-dependent physical and mechanical properties of hawthorn (Crataegus aronia)
Vol. 15, No.4
295
Table 1 Analysis of variance of the physical properties of
with increasing moisture content (Cetin, 2007), but reported
hawthorn
by Aviara et al. (2005), Yalçin and Özarshan (2004), Garnayak et al. (2008), Askari Asli-Ardeh et al. (2011),
Physical properties
Mean squares
a (mm)
177.831*
b (mm)
109.202*
c (mm)
255.049*
m (mm)
7.135*
(Visvanathan et al., 1996), but the report by Gupta and Das (1997), Ogat (1998), Garnayak et al. (2008), Selvi et al.
V (mm)
21.301*
PA (mm)
31586.087*
PB (mm)
373395.237*
PC (mm)
41039.811*
ρt (mm)
7.696*
Dg (mm)
185.945*
Da (mm)
175.611*
S (mm)
1881709.715*
sph (%)
77.913*
cpA (mm2)
34865.713*
Ra
0.017*
ε
582.498*
true density increased with increasing moisture content. Porosity decreases with increasing moisture content
(2006), Işik and Ŭnal (2007), porosity increased with increasing moisture content.
coefficient of static friction and rolling coefficient in Table 2 is presented.
All traits except the true density, porosity increased with increasing moisture content.
The results indicate significant effect of
level on coefficient of friction and moisture×level on coefficient of rolling. Table 2 Analysis of variance (mean squares) of coefficient of rolling and coefficient of friction Source
Note: * P < 0.05.
Analysis of variance
Coefficient of friction
Coefficient of rolling
Moisture
0.012
0.028
Level
0.414*
0.032
Moisture×Level
0.001
0.72*
Note: * P < 0.05.
Within increasing moisture content, arithmetic mean diameter and geometric mean diameter significantly
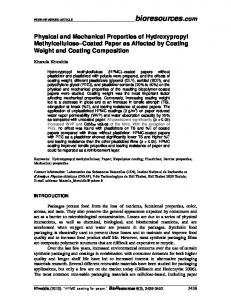
Figure 1, the coefficient of rolling and the coefficient
increase (Al-Mohasneh and Rababah, 2007; Garnyak et al.,
of friction average value chart shows different levels of
2008; Selvi et al., 2006; Işik and Ŭnal, 2007).
moisture.
According to these charts all levels have
Surface and volume increases with increase in
increased coefficient of friction with increasing moisture
moisture (Al-Mohasneh and Rababah, 2007; Askari
(Reddy and Chakravertty, 2004; Al-Mahasneh and
Asli-Ardeh et al., 2011).
Rababah, 2007; Gubta and Das, 1997; Singh and
As said mass density (bulk density) decreased with
Goswami 1996; Nimkar and Chattopadyay, 2001; Aydin,
increasing moisture content (Garnayak et al., 2008;
2003; Calisir et al., 2004) if the coefficient of rolling on
Shepherd and Bhardwaj 1986; Dutta et al., 1988; Gupta and
all surfaces except glass surface is reduced with
Prakash, 1990; Carman, 1996). The true density decreases
increasing moisture.
a. Rolling curve
b. Friction curve
Figure 1 Average coefficient of rolling curve and friction curve in terms of moisture in different levels
296
December, 2013
Agric Eng Int: CIGR Journal
Open access at http://www.cigrjournal.org
Vol. 15, No.4
According to the chart, the wood that has the highest
significant effect of moisture on all properties. Mode of
coefficient of friction and the glass has the lowest
exposure is effective in all cases except dL in Fmax.
coefficient of friction (Amin et al., 2003; Garnayak et al.,
Interaction speed and mode of exposure were effective
2008; Shepherd and Bhardwaj, 1986; Dutta et al., 1988;
only on the dL in Fmax.
Kulkelko et al., 1988; Visvanathan et al., 1996). Analysis of variance in the mechanical properties of hawthorn in Table 3 is presented. The results indicate
Interaction of three factors: moisture, speed and mode of exposure were effective only on the modulus of elasticity. Where, W is the work done of the force.
Table 3 Analysis of variance (mean squares) of mechanical properties dL in Fmax, mm
Source
*
Fmax, N 13006.1570
Modulus of elasticity, Gpa *
0.230
*
W in Fmax, N·mm 100094.565*
Moisture
32.805
Mode of exposure
2.645
13560.300*
0.038*
38370.502*
Speed
4.969
826.052
0.003
4573.184
Moisture×Mode of exposure
0.347
1232.561
0
3913.028
Moisture×Speed
3.947
431.595
0.003
501.897
Speed×Mode of exposure
11.191*
935.96
0.006
5654.562
Moisture×Speed×Mode of exposure
3.822
512.861
0.022*
607.839
Note: * P < 0.05.
Figure 2, the average value of dL in Fmax relative
Figure 4, the average value of modulus of elasticity
moisture chart shows in both horizontal and vertical mode.
relative moisture chart shows in both horizontal and
According to these charts in speed of 10 (horizontal) and
vertical mode. According to these charts in speed of 10
speed of 20 (vertical) dL in Fmax has the highest increase.
(horizontal) and speed of 20 (vertical) modulus of
This means that dL in Fmax increases with increasing
elasticity has the highest reduction.
speed in vertical mode and decreases with increasing
modulus of elasticity decreases with increasing speed in
speed in horizontal mode.
vertical mode and increases with increasing speed in
Figure 3, the average value of Fmax relative moisture
This means that
horizontal mode.
chart shows in both horizontal and vertical mode.
As it can be seen in Figure 5, the average value of W
According to these charts in speed of 15 (horizontal) and
in Fmax relative moisture chart shows in both horizontal
speed of 20 (vertical) Fmax has the highest reduction.
and vertical modes. According to these charts in speed
This means that Fmax decreases with increasing speed in
of 15 (horizontal and vertical) W in Fmax has the highest
both horizontal and vertical mode.
increase.
a. Horizontal
b. Vertical
Figure 2 Average dL in Fmax curve in terms of moisture in mode of exposure
December, 2013
Moisture-dependent physical and mechanical properties of hawthorn (Crataegus aronia)
a. Horizontal
b. Vertical
Figure 3 Average Fmax curve in terms of moisture in mode of exposure
a. Horizontal
b. Vertical
Figure 4 Average modulus of elasticity curve in terms of moisture in mode of exposure
a. Horizontal
b. Vertical
Figure 5 Average W in Fmax curve in terms of moisture in mode of exposure
Vol. 15, No.4
297
298
December, 2013
Agric Eng Int: CIGR Journal
Open access at http://www.cigrjournal.org
Vol. 15, No.4
CPA
criteria projected area, mm2
ρt
true density of fruit, g cm-
properties of hawthorn it was found that moisture has a
mb
grain mass, g
significant effect on physical properties of hawthorn.
Vt
total volume, cm3
The results showed that moisture on the characteristics of
ρb
mass density, g cm-3
the surface area and spherical has the most effective and
ε
Porosity
Fmax
maximum force, N
dL
changing the shape, mm
W
work done of the force, N.mm
interaction of moisture and levels have a significant effect
M
fruit mass, g
on coefficient of rolling.
V
fruit Volume, cm3
According to analysis of variance of mechanical
Dg
geometric mean diameter, mm
properties of hawthorn, the interaction three elements
Da
arithmetic mean diameter, mm
Sph
coefficient of spherical
S
surface area, mm2
a
length of fruits, mm
b
width of fruit, mm
c
thickness of fruit, mm
PA
surface vertical to a, mm2
PB
surface vertical to b, mm2
4
Conclusions With the study on the effect of moisture on physical
on the characteristic of apparent has the least effective. Analysis of variance results of coefficient of friction and coefficient of rolling showed that levels have a significant effect on coefficient of friction and the
(moisture, speed and mode of exposure) have a significant effect on modulus of elasticity and moisture has a significant effect on all factors and speed has a significant effect on any of the factors. With increasing moisture, all the mechanical properties decreased except dL in Fmax.
Nomenclature PC
surface vertical to c, mm2
Ra
Appearance
References Al-Mahasneh, M. A., and T. M. Rababah.
2007.
Effect of
moisture content on some engineering properties of green wheat. Journal of Food Engineering, 79(4): 1467-1473.
Journal of Food Engineering, 60(3): 315-320. Calisir, S., T. Marakoglu, H. Ogut, and O. Ozturk.
Altuntaş, E., E. Özgӧz, and Ö. F. Taşer. 2005. Some physical properties of fenugreek (Trigonella foenum-graceum L.) seed. Journal of Food Engineering, 71(1): 37-43. Amin, M. N., M. A. Hossain, and K. C. Roy.
Aydin, C. 2003. Physical properties of almond nut and kernel.
Physical properties of rapeseed. Journal of Food Engineering, 69(1): 61-66. Carman, K.
2003.
Effects of
moisture content on some physical properties of lentil seeds. Journal of Food Engineering, 65(1): 83-87.
1996.
Some physical properties of white lupin.
Journal of Agricultural Engineering Research, 69(3): 87-92. Cetin, M.
2007.
Physical properties of barbunia bean
(Phaseolus vulgaris L. cv. ‘Barbuniz’) seed.
Askari Asli-Ardeh, E., S. Shojaei, and S. shakarbeygi.
2011.
Determination of some mechanical properties of three paddy
Engineering, 80(1): 353-358. properties of gram.
Science and Technology, 7(4): 99-106.
Research, 39(4): 259-267.
properties
of
Balanites
Engineering, 92 (3):325-334.
aegyptiaca
nuts.
Biosystems
Journal of Food
Dutta, S. K., V. K. Nema, and R. K. Bhardwaj. 1998. Physical
varieties in different moisture levels. Iranian Journal of Food Aviara, N. A., E. Mamman, and B. Umar. 2005. Some physical
2004.
Journal of Agricultural Engineering
Fraser, B. M., S. S. Verma, and W. E. Muir. physical properties of fababeans. Engineering Research, 23(1): 53-57.
1978.
Some
Journal of Agricultural
December, 2013
Moisture-dependent physical and mechanical properties of hawthorn (Crataegus aronia)
Garnayak, D. K., R. C. Pradhan, S. N. Naik, and N. Bhatnagar. 2008.
Moisture-dependent physical properties of jatropha
seed (Jatropha curcas L.).
Industrial Crops and Products,
27(1): 123-129. 1997.
Physical properties of
Journal of Agricultural Engineering
Research, 66(1):1-8.
Nimkar, P. M., and P. K. Chattopadyay. 2001. Some physical Journal of Agricultural Engineering
properties of green gram. Research, 80(2): 183-189. properties
of
moth
on some engineering properties of pulses. Paper presented at XXVI Annual convention of Indian society of Agricultural Engineers, Hissar, February, 7-9. 2007.
Moisture-dependent physical
of Food Engineering, 82(2): 209-216. Jalilian Tabar, F. and A. Lorestani. 2012. Physical properties and
Engineering,
91(2):183-189. raw and parboiled paddy.
2004. Physical properties of
Biosystems Engineering, 88(4):
461-466. Selvi, K. C., Y. Pinar, and E. Yeşiloǧlu. 2006. Some physical properties of linseed.
properties of white speckled red kidney bean grains. Journal
Biosystem
gram.
Reddy, B. S., and A. Chakravertty.
Gupta, R. K., and S. Prakash. 1990. Effect of moisture content
Işik, E., and H. Ưnal.
299
Nimkar, P. M., S. M. Dipali, and M. D. Renu. 2005. Physical
Gupta, R. K., and S. K. Das. sunflower seeds.
Vol. 15, No.4
Biosystems Engineering, 95(4):
607-612. Shepherd, H., and R. K. BhardwaJ. 1986. Moisture dependent Physical properties of pigeon pea.
Journal of Agricultural
Engineering Research, 35(4): 227-234.
effect of loading orientation on the mechanical properties of
Singh, K. K., and T. K. Goswami. 1996. Physical properties of
black chickpea. Agricultural Engineering International: CIGR
cumin seed. Journal of Agricultural Engineering Research,
Journal., 14(3): 230-235.
64(2): 93-98.
Kashaninejad, M., A. Mortazavi, A. Safekordi, and L. G. Tabil. 2006.
Some physical properties of pistachino (pistacia verb L.)
nut and its kernel. Journal of Food Engineering, 72(1): 30-38. Kulkelko, D. A., D. S. Jayas, N. D. G. White, and M. G. Britton. 1988.
Physical properties of canola (rapeseed) meal.
Canadian Agricultural Engineering, 30(1): 61-64. Mohsenin, N. N. 1980. Physical properties of plant and animal material.
New York: Gorden and Breach.
Tavakkoli Hashtjin, T. 2003.
Agricultural products mechanics
(Translate). Zanjan University Publications. Visvanathan, R., P. T. Palanisamy, L. Gothandapani, and V. V. Sreenarayanan.
1996.
Physical properties of neem nut.
Journal of Agricultural Engineering Research, 63(1): 19-26. www. Pezeshk. Us Yalçin, L., and C. Özarslan. 2004. Physical properties of vetch seed. Biosystems Engineering, 88(4): 407-512.