MOLECULAR, CELLULAR, AND DEVELOPMENTAL BIOLOGY Toxicological and gene expression analysis of the impact of aflatoxin B1 on hepatic function of male broiler chicks L. P. Yarru,* R. S. Settivari,* E. Antoniou,* D. R. Ledoux,*1 and G. E. Rottinghaus† *Department of Animal Sciences, and †Veterinary Medical Diagnostic Laboratory, University of Missouri, Columbia 65211 ABSTRACT The objective of this study was to determine the effects of dietary aflatoxin B1 (AFB1) on hepatic gene expression in male broiler chicks. Seventy-five 1-d-old male broiler chicks were assigned to 3 dietary treatments (5 replicates of 5 chicks each) from hatch to d 21. The diets contained 0, 1 and 2 mg of AFB1/kg of feed. Aflatoxin B1 reduced (P < 0.05) feed intake, BW gain, serum total proteins, and serum Ca and P, but increased (P < 0.01) liver weights in a dose-dependent manner. Microarray analysis was used to identify shifts in genetic expression associated with the affected physiological processes in chicks fed 0 and 2 mg of AFB1/ kg of feed to identify potential targets for pharmacological/toxicological intervention. A loop design was used for microarray experiments with 3 technical and 4 biological replicates per treatment group. Ribonucleic acid was extracted from liver tissue, and its quality was determined using gel electrophoresis and spectrophotometry. High-quality RNA was purified from DNA
contamination, reverse transcribed, and hybridized to an oligonucleotide microarray chip. Microarray data were analyzed using a 2-step ANOVA model and validated by quantitative real-time PCR of selected genes. Genes with false discovery rates less than 13% and fold change greater than 1.4 were considered differentially expressed. Compared with controls (0 mg of AFB1/kg), various genes associated with energy production and fatty acid metabolism (carnitine palmitoyl transferase), growth and development (insulin-like growth factor 1), antioxidant protection (glutathione S transferase), detoxification (epoxide hydrolase), coagulation (coagulation factors IX and X), and immune protection (interleukins) were downregulated, whereas genes associated with cell proliferation (ornithine decarboxylase) were upregulated in birds fed 2 mg of AFB1/kg. This study demonstrates that AFB1 exposure at a concentration of 2 mg/kg results in physiological responses associated with altered gene expression in chick livers.
Key words: aflatoxin B1, gene expression, broiler, liver, microarray 2009 Poultry Science 88:360–371 doi:10.3382/ps.2008-00258
INTRODUCTION
biologically active form and causes poor performance, liver lesions, and immunosuppression in poultry (Kubena et al., 1990; Ledoux et al., 1999). Aflatoxin B1 also increases free radical production, leading to oxidative damage and lipid peroxidation, which might ultimately lead to cell damage and death (Surai, 2002). Eraslan et al. (2005) studied the effects of AF on oxidative stress and observed a reduction in antioxidant activity in the erythrocytes of chicks fed AF compared with controls. Although problems associated with AF have been known for decades and a great deal of research has been conducted on the effects of AF at the animal level, very little research has been done at the gene level. Microarrays are being used for global gene expression profiling to identify candidate genes and to map growth, metabolic, and regulatory pathways that control important production traits. To date, no study has been reported regarding the measurement of gene expression in chicks fed AFB1 using microarrays. The current project will allow us to determine genes that are specifically ex-
Mycotoxins are naturally occurring toxic secondary metabolites of fungi that may be present in food ingredients (Kuiper-Goodman, 1995). Several mycotoxins have been associated with various animal and poultry diseases. Mycotoxins encompass a wide spectrum of different chemical structures and affect many target organs such as liver and kidney and systems such as the nervous and immune systems (Kuiper-Goodman, 1995). A major contaminant of common feed ingredients used in poultry rations is the aflatoxins (AF; Smith et al., 1995). Aflatoxins are a class of mycotoxins produced by the fungi Aspergillus parasiticus and Aspergillus flavus (Smith et al., 1995). Aflatoxin B1 (AFB1) is the most ©2009 Poultry Science Association Inc. Received June 25, 2008. Accepted September 29, 2008. 1 Corresponding author:
[email protected]
360
HEPATIC GENE EXPRESSION IN BROILER CHICKS FED AFLATOXIN B1
pressed in response to AF and thus enable us to identify various pathways that control growth, development, coagulation, immune, metabolism, detoxification, and antioxidant status of broiler chicken.
MATERIALS AND METHODS Experimental Design and Birds Seventy-five 1-d-old (Cobb × Cobb) male broiler chicks were purchased from a commercial hatchery (Hoover’s Hatchery Inc., Rudd, IA), weighed, wingbanded, and assigned to pens in stainless-steel chick batteries for 21 d. Chicks were maintained on a 24-h continuous light schedule and allowed ad libitum access to feed and water. The animal care and use protocol was reviewed and approved by the University of Missouri-Columbia Animal Care and Use Committee. The chicks were randomly assigned to 3 treatments with 5 replicates of 5 birds each. Mortality was recorded, and birds were inspected daily for any health problems.
Diets The basal diet was a commercial type corn-soybean meal diet formulated to meet the nutritional requirement of growing chicks as recommended by the National Research Council (1994). Dietary treatments included A) a basal diet containing 0 mg of AFB1/kg of diet (control); B) a basal diet with 1.0 mg of AFB1/kg of diet; and C) a basal diet with 2.0 mg of AFB1/kg of diet. Aflatoxin B1 was supplied by Aspergillus parasiticus (NRRL 2999) culture material containing 760 mg/ kg of AFB1.
Sample Collection On d 21, all birds were weighed and feed intake was measured for each pen. Average feed intake and BW gain were determined. Fifteen chicks (5 replicates of 3 chicks each) from each treatment were killed with carbon dioxide, and blood was collected via cardiac puncture for serum chemistry analysis. Liver weight of each bird was recorded, and a piece of liver tissue was collected, snap-frozen in liquid nitrogen, and stored at −80°C for microarray and real time-PCR analyses.
Serum Biochemistry Collected blood was centrifuged to obtain serum, which was immediately frozen until submitted for serum biochemistry analysis. Serum analyses included determinations of serum total protein (TP), Ca, and P using standard procedures. These measurements are components of a larger biochemical profile determined at the Veterinary Medical Diagnostic Laboratory using an auto-analyzer (Kodak Ektachem Analyzer, Eastman Kodak Co., Rochester, NY).
361
Statistical Analysis of Physiological Responses Data were analyzed using the General Linear Model procedures of SAS (SAS Institute, 1996). The means for treatments showing significant differences in the ANOVA were compared using Fisher’s protected least significant difference procedure at a significance based on the 0.05 level of probability.
Microarray Slide Preparation Microarray slides containing 21,120 oligonucleotides (70 bp; representing entire chicken genome) were purchased from the Genomic Research Laboratory (University of Arizona, Tucson). Before hybridization, the microarray slides were rehydrated to increase the spot size and to spread the DNA more uniformly within each spot. Following rehydration for 30 s at 55°C, the slides were snap-dried on a 100°C hot plate surface for 5 s. The slides were cross-linked using an ultraviolet cross-linker (600 mJ). Microarray slides were incubated in 0.2% I-block (Applied Biosystems, Foster City, CA) at 42°C to decrease background and increase specificity. The slides were washed once with 0.2% SDS and twice with water (3 min each wash). The slides were dried by centrifugation and stored in the dark until used.
RNA Extraction Ribonucleic acid was extracted from the liver samples of birds fed 0 and 2 mg of AFB1/kg using an RNeasy Midi Kit (Qiagen Inc., Valencia, CA), purified using DNase-1 (Ambion Inc., Austin, TX) and phenol:chloroform:isoamyl alcohol (25:24:1), and concentrated using Microcon YM30 filters (Millipore Corp., Bedford, MA) as described previously (Settivari et al., 2006). The quality and integrity of the purified RNA was checked through agarose gel electrophoresis, and the quantity was measured using an ND-1000 spectrophotometer (Nanodrop Technologies, Wilmington, DE; Flanagan, 2005). The purified RNA samples were preserved at −80°C until used.
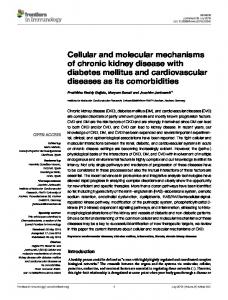
Microarray Hybridization A loop design was used for microarray experiments, with 4 biological replicates (4 animals/treatment group) and 3 technical replicates (each RNA sample repeated on 3 different arrays; Figure 1). Concentrated and purified total RNA (15 µg) from each chick liver was reverse-transcribed to cDNA using oligo dT (5 µg/µL; IDT DNA, Coralville, IA), random hexamers (5 µg/µL; IDT DNA), 25× amino-allyl dUTP/dNTP (Sigma Chemicals, St. Louis, MO), and reverse transcriptase (StrataScript RT, Stratagene, La Jolla, CA). The resulting cDNA was purified using Microcon-30 filters (Millipore) and conjugated separately with Cy3
362
YARRU ET AL.
or Cy5 mono reaction dyes (Amersham Biosciences, Piscataway, NJ) by incubating in the dark for 1 h. Conjugated cDNA was separated from free, unconjugated dye using a Qia-quick PCR purification kit (Qiagen) following the manufacturer’s instructions. The 2 cDNA samples, labeled with Cy3 and Cy5 dyes, were mixed together and dried. Dried cDNA pellets were resuspended with the hybridization mixture, which consisted of 1× 4-(2-hydroxyethyl)-1-piperazineethanesulfonic acid (pH 7.0), poly A (10 µg/µL; Stratagene), 20× saline sodium citrate (SSC; Stratagene), and 10% SDS. The slides were incubated in a water bath (60°C) for 12 to 16 h. After incubation, the slides were rinsed in wash solution I (20× SSC, and 10% SDS) for 15 min and then in wash solution II (20× SSC) for 15 min.
Microarray Slide Scanning and Analysis Microarray slides were scanned using a GenePix 4000B Microarray Scanner (Axon Instruments, Union City, CA) at 5-µm resolution, and the image was analyzed using GenePix Pro 4.0.1.12 software (Axon Instruments Inc.). The resulting files and images were linked together and stored in the local BioArray Software Environment database (Saal et al., 2002). Microarray raw data files were deposited with the National Center for Biotechnology Information Gene Expression Omnibus (http://www.ncbi.nlm.nih.gov/projects/geo/). The serial entry number for the microarray data is GSE8603, and the platform number is GPL5618. Hybridizations in the microarray experiment were given the following serial numbers: GSM213349, GSM213358, GSM213359,
GSM213360, GSM213392, GSM213395, GSM213399, GSM213402, and GSM213405.
Self-Self Hybridization Five self-self hybridizations were performed to measure the variation in gene expression due to technical errors. In these hybridizations, the same chick liver was used for different RNA isolations; labeling and hybridizations were carried out with the same RNA labeled with Cy3 and Cy5 on the arrays. Slides were hybridized, scanned, and analyzed as described previously. Because the same RNA sample is hybridized to the arrays, the theoretical mean ratio of Cy3 to Cy5 is equal to 1. Deviation from this theoretical mean can only be attributed to technical noise. Means and SD for Cy5 and Cy3 ratios were calculated for 5 hybridizations, and a threshold was set as mean ± 2 SD (±1.4). Genes with expression above or below this threshold were considered as up- or downregulated, respectively, and were used for further analysis.
Statistical Analysis of Microarray Data Microarray data were first filtered to remove all the blank spots. The background corrected median intensities were normalized using pin-based LOWESS normalization within BioArray Software Environment. The microarray spot intensities were first log2 transformed and genes with greater than 20% missing values (genes with spot intensities absent/below threshold level due to hybridization problems) were filtered using CLUSTER 3.0 software (Eisen et al., 1998). Missing values for each gene were imputed using the k-nearest neighbor method (k = 20) and significant analysis of microarrays software. The normalized intensities were then inputted into the software package microarray ANOVA (MAANOVA; Wu et al., 2003) to model the data and run statistical analyses. A 2-stage ANOVA model (Wolfinger et al., 2001) was applied to the microarray data using MAANOVA and its Java graphic user interface JMAANOVA (Wu, 1995) software. The first stage was the normalization model to remove the effect of array and dye at the across gene level. Ygnlijk = µ + Ai + Dk +(AD)ik + sgnlijk. The second stage was the gene-specific model in which the effects of treatment-gene interaction and array-gene interaction were modeled as random effects. €gnlijk = (GV)gi + (GD)gk + rgnlijk.
Figure 1. Loop design used for micro array experiments. A1, A2, A3, A4 are chicks fed 2 mg of aflatoxin/kg of feed. C1, C2, C3, C4 are control chicks fed no aflatoxin B1. Four biological and 3 technical replicates were used for the microarray experiment.
For these models ygnlijk = log2(wgnlijk), w is the observed median intensity for each color channel by gene, µ is the model grand mean, A is the array, D is the dye, G is the gene, V is the animal, and € and r are the residuals from the linear models. A permutation Fs test (a modified F test designed specifically for mi-
HEPATIC GENE EXPRESSION IN BROILER CHICKS FED AFLATOXIN B1
363
Table 1. Primer sequences (5′ 3′) used in real-time PCR Name
Symbol
Forward primer
Reverse primer
Coagulation factor 9 Insulin-like growth factor 1 Ornithine decarboxylase Glyceraldehyde-3 phosphate dehydrogenase Glutathione S transferase-α
F9 IGF-1 OD GAPDH GSTα
CTTTTCTTGGTGCCGAAAGT TGCACTTTTAAGAAGCAATGGA CCTTGACGAGGGCTTTACTG CCTCTCTGGCAAAGTCCAAG GCCTGACTTCAGTCCTTGGT
TCCCGGGAATTAACTCTTCC GCAAACACAGGCCAAGGTAG CCGCATGTGCTTCTTTACAA CAACATCAAATGGGCAGATG CCACCGAATTGACTCCATCT
croarray data; Cui and Churchill, 2003) was run to test the significance of sample effect for each probe (500 permutations). Genes with an adjusted permutation Fs test (false discovery rate) value less than 13% were regarded as significantly differentially expressed across samples. This differentially expressed gene list was then filtered to remove genes with a fold change of less than 1.4 (value obtained from mean ± 2 SD of 5 self-self hybridizations; Settivari et al., 2006). A second type of microarray analysis was performed to measure the gene expression across each individual animal (gene × animal model). Values obtained from both ANOVA analyses were inputted into TIGR multi-experiment viewer software (TM4-Mev; Saeed et al., 2003) to run hierarchical clustering (Eisen et al., 1998) analysis. The hierarchical tree was confirmed using bootstrap (Kerr and Churchill, 2002). The DAVID (Dennis et al., 2003) and Entrez-Gene (http://www.ncbi.nih.gov/entrez) databases from the National Center for Biotechnology Information were used to find gene annotations of the differentially expressed genes.
Quantitative Real-Time PCR Two-step quantitative real-time-PCR was used to confirm expression patterns of randomly selected 4 differentially expressed genes [ornithine decarboxylase, insulin-like growth factor 1, coagulation factor I×, glutathione S-transferase (GST) α]. From each chick liver, 10 µg of total RNA was reverse transcribed using Stratascript RT (Stratagene) with oligo dT (5 µg/µL; IDT DNA, Coralville, IA) and random hexamers (5 µg/ µL; IDT DNA). Then, 6.25 ng of cDNA was added to a 25-µL PCR reaction to get a final concentration of 0.25 ng/µL of cDNA in a SYBR green assay (Applied Biosystems, Foster City, CA). Forward and reverse primer final concentrations were 100 nM in the SYBR green assay. Primers were designed using Primer3 program with an annealing temperature of 60°C and amplification size of less than 250 bp (Table 1). Glyceraldehyde phosphate dehydrogenase (GAPDH), β actin, and 18s RNA were tested to identify a suitable endogenous control gene and GAPDH was selected because its gene expression did not differ between the control and AFB1 groups. Thermal cycling was carried out with an ABI Prism 7500 sequence detection system (Applied Biosystems) under factory default conditions (50°C, 2 min; 95°C 10 min; and 40 cycles at 95°C, 15 s; 60°C 1 min). Each gene was measured in triplicate, and the formation of single PCR products was confirmed using melt-
ing curves. Negative controls, which consisted of all the components of the PCR mix except cDNA, were used for all primers. The relative quantification of gene expression changes were recorded after normalizing for GAPDH gene expression was computed by using the 2-∆∆Ct method (user manual 2, ABI Prism 7700 SDS). In the 2-∆∆CT analysis, the threshold cycle (Ct; cycle number at which the expression exceeds threshold level) from control birds was used as a calibrator sample. A 2-tailed t-test with unequal group variance was used for the Ct values of each gene to analyze differences between control and AFB1-fed birds.
RESULTS Performance of Broiler Chicks Data on average feed intake, BW gains, and relative liver weights are presented in Figure 2. Compared with controls, chicks fed 1 mg of AFB1/kg and 2 mg of AFB1/kg had significantly (P < 0.05) less feed intake and weight gain in a dose-dependent manner. Relative liver weight was increased (P < 0.05) in chicks fed the diet containing 1 mg of AFB1/kg and 2 mg of AFB1/ kg compared with control chicks in a dose-dependent manner.
Serum Biochemical Parameters The effects of dietary treatments on serum chemistry are summarized in Figure 3. Feeding chicks 1 mg of AFB1/kg and 2 mg of AFB1/kg resulted in significantly (P < 0.05) reduced serum TP, serum Ca, and serum P levels compared with controls.
Genomic Responses to Aflatoxicosis Microarray analysis identified 177 genes (false discovery rate ≤13% and fold change ≥1.4) as differentially expressed between controls and chicks fed 2 mg of AFB1/kg. Of these, 97 genes were upregulated and 80 genes were downregulated in chicks fed AF compared with controls. Hierarchical clustering was used to group the chicks based on their profile of gene expression. The clustering program divided the chicks into 2 groups, with all the birds from each treatment group clustering together, which suggests low biological variation within each treatment group. Bootstrap testing supported the hierarchical clustering results with 100% confidence. The differentially expressed genes between the treat-
364
YARRU ET AL.
Figure 2. Effect of aflatoxin B1 (AFB1) on feed intake, BW gain, and relative liver weights of broiler chicks. a–cBars with no common letter are significantly different (P < 0.05).
ment groups represented various important pathways such as detoxification, fatty acid metabolism, oxidative phosphorylation, energy production, cell proliferation, coagulation, metabolism, growth and development, immune response, and antioxidant activities (Tables 2 to 8).
Real-Time PCR Results Quantitative real-time PCR was used to confirm the validity of the microarray results. All 4 of the randomly selected differentially expressed genes (ornithine decarboxylase, insulin-like growth factor 1, F9, GSTα) had a similar expression pattern as observed in microarray results, thereby validating the microarray results (Figure 4).
DISCUSSION Physiological Responses to Aflatoxicosis Decreased feed intake and BW gain along with increased liver weights in birds fed AFB1 are consistent with earlier reports (Huff et al., 1988; Ortatatli and Oğuz, 2001; Verma et al., 2004) on the effects of AF
Figure 3. Effect of aflatoxin B1 (AFB1) on serum P, Ca, and total protein. a–cBars with no common letter are significantly different (P < 0.05).
in young broiler chicks. Similarly, reduced levels of TP, Ca, and P in birds fed AFB1 are in agreement with earlier reports (Huff et al., 1988). A decrease in TP levels would lead to decreased efficiency of the immune system because the key mechanisms of some immune responses are the production of factors that kill pathogens, such as antimicrobial peptides and proteins (Büchau and Gallo, 2007). Decreased serum Ca and P levels could probably be one of the reasons for the leg and bone abnormalities associated with rubbery leg syndrome in birds fed AF (Washburn et al., 1976).
Genomic Responses to AFB1 Intake of the AFB1 diet was hypothesized to result in changes in liver gene expression representing characteristic pathophysiology associated with aflatoxicosis. Microarray results demonstrated that the expression of genes coding for specific physiological pathways, including detoxification, fatty acid metabolism, oxidative phosphorylation, energy production, cell proliferation, immune response, metabolism, growth and development, coagulation, and antioxidant activities were altered in chicks fed 2 mg of AFB1/kg of diet. The altered genomic responses observed in the present study could be due to the direct effects of stress associated with AF. These genomic effects and their relationship
365
HEPATIC GENE EXPRESSION IN BROILER CHICKS FED AFLATOXIN B1
Table 2. Differentially expressed genes associated with oxidative phosphorylation and energy synthesis in B1-fed chicks compared with control birds at the end of 21-d treatment period1
Transcript ID
Gene symbol
ENSGALT00000000598.1
KCNA10
ENSGALT00000027702.1
FDX1
ChEST492f11 ChEST371g7 ChEST1027e3 ENSGALT00000011328.1
CYP2C45 CYP2P3 ACVR1 UBE2I
ENSGALT00000024891.1
ABCA1
ENSGALT00000008501.1
CYB5R
CK607798
CPT
Carnitine palmitoyl transferase
NM_008898
Por
ENSGALT00000020816.1
IGF1
P450 (cytochrome) oxidoreductase Insulin-like growth factor I precursor (IGF-I; Somatomedin)
ENSGALT00000024891.1
ABCA1
ENSGALT00000013008.1
GRB2
Ratio, aflatoxin/ control (log values)
FDR, %
Gene name
Gene ontology
Shaker subfamily potassium channel Adrenodoxin mitochondrial precursor (adrenal ferredoxin) Cytochrome p-450 2c45 Cytochrome P450 2P3 Collagen alpha1 BMP/retinoic acid-inducible neural-specific protein
Voltage-gated ion channel activity Electron transport
Up, 0.63
12.76
Down, 0.49
12.66
Electron transport Electron transport Anion transport, ion transport ATP binding, pyrophosphatase activity ATP-binding cassette transporter
Down, 1.59 Down, 0.77 Up, 0.69 Up, 1.43
12.66 12.93 12.57 12.59
Up, 0.93
12.64
Electron transport
Down, 1.13
12.53
Transport long-chain fatty acids into mitochondria Electron transport
Down,0.57
12.56
Up, 0.20
12.50
Growth-promoting activity
Down, 1.63
12.55
ATP-binding cassette transporter
Up, 0.93
12.64
Growth factor stimulation
Down, 0.46
13.00
ATPbinding cassette sub-family A NADHcytochrome b5 reductase
ATPbinding cassette sub-family A Growth factor receptor-bound protein 2
1 FDR = false discovery rate; NADH = nicotinamide adenine dinucleotide phosphate; ATP = adenosine triphosphate; BMP = bone morphogenic protein.
to the observed physiological responses are expected to provide additional insight into the pathophysiology of aflatoxicosis. Oxidative Phosphorylation and Energy Production. Genes associated with oxidative phosphorylation and adenosine triphosphate (ATP) synthesis were downregulated in liver of chicks fed 2 mg of AFB1/kg of diet (Table 2). Genes such as adrenodoxin mitochondrial precursor (adrenal ferredoxin), cytochrome P450 2C5, cytochrome P450 2P3, and nicotinamide adenine dinucleotide phosphate (NADH)-cytochrome b5 reductase play a major role in electron transport. Downregulation of these genes in chicks fed 2 mg of AFB1/kg of diet could result in impaired oxidative phosphorylation as well as electron leak, resulting in formation of superoxide radicals. The major purpose of electron transport is ATP synthesis, and therefore we speculate that oxidative phosphorylation and ATP synthesis pathways are more affected in chicks fed 2 mg of AFB1/kg leading to decreased energy production. Carnitine palmitoyl transferase 1A transports long-chain fatty acids into mitochondria for energy release, especially when hepatic glycogen is depleted during starvation (Shin et al., 2006). Long-chain fatty acids cross the outer and inner membranes of mitochondria with the help of carnitine palmitoyl transferase and undergo β-oxidation. The
resulting end product enters the Krebs’s cycle in the mitochondrial matrix. The by-products of the Krebs’s cycle, NADH, and flavin adenine dinucleotide enter the electron transport chain, resulting in ATP synthesis. Because the carnitine palmitoyl transferase gene was
Figure 4. Validation of micro array results with real-time PCR. Treatment and control birds consisted of 3 biological replicates. IGF-1 = insulin-like growth factor 1; OD = ornithine decarboxylase; F9 = coagulation factor IX; GST = glutathione S-transferase; RT-PCR = real-time-PCR.
366
YARRU ET AL.
downregulated in chicks fed AFB1, a decreased number of long chain fatty acids would be able to cross the mitochondrial membranes leading to a decrease in ATP production. Metabolism and Growth. Differentially expressed genes associated with metabolism are listed in Table 3. To compensate for the reduced caloric intake and energy utilization, some of the genes associated with carbohydrate metabolism [glycogen synthase 1, lactate dehydrogenase H subunit, pyruvate dehydrogenase complex E1 component, malic enzyme 1 nicotinamide adenine diculeotide phosphate (+)-dependent cytosolic] and protein metabolism (muller glia protein tyrosine phosphatase 2, LIM domain kinase 2, presenilin 1, hepatocyte growth factor-like/macrophage stimulating protein, hect domain, and regulator of chromosome condensation 1 domain 4) were upregulated in birds
fed 2 mg of AFB1/kg, likely resulting in an upregulation of gluconeogenic pathways. The genes involved in fatty acid metabolism (lipoprotein lipase precursor, peroxisomal bifunctional enzyme) were downregulated in birds fed AFB1 compared with controls. As a result, fatty acids were not metabolized and they accumulated in the liver. This could be the reason for the fatty livers and increased liver weights observed in the present study. Furthermore, downregulation of carnitine palmitoyl transferase gene in birds fed 2 mg of AFB1/ kg could contribute to fatty liver condition because of impaired long chain fatty acid transport into mitochondria. Similar increases in the relative liver weights were observed in chicks fed AF by Ortatatli and Oğuz (2001) and Huff et al. (1988). Previous reports suggest that AF at dietary concentrations of 1 mg/kg or more causes severe reduction in growth of broiler chicks
Table 3. Differentially expressed genes associated with metabolism in aflatoxin B1-fed chicks compared with control birds at the end of 21-d treatment period1 Ratio, aflatoxin/ control (log values)
FDR, %
Transcript ID
Gene symbol
Gene name
Gene ontology
ENSGALT00000021664.1 ENSGALT00000008794.1
GYS1 NAT1
12.53 12.51
GLUL
Carbohydrate metabolism Coenzyme metabolism, cofactor biosynthesis Amine metabolism
Up, 2.33 Up, 1.49
ENSGALT00000005829.1
Up, 1.26
13.03
ChEST771a4
RPL5
Carboxylic acid metabolism
Up, 0.76
12.57
ENSGALT00000022490.1
MULLER
Cellular macromolecule metabolism
Up, 1.4
12.87
ChEST1010o8 ChEST214h19
Bbox1 Slc45a2
Glycogen synthase1 N-acetyltransferase 1 (arylamine n-acetyltransferase) Glutamine synthetase (glutamate– ammonia ligase) GTP cyclohydrolase I feedback regulator Muller glia protein tyrosine phosphatase 2 γ-butyrobetaine,2-oxoglutarate diox Solute carrier family 45, member 2
Up, 1.09 Up, 0.85
12.51 12.71
ENSGALT00000017326.1 ENSGALT00000007741.1 ENSGALT00000011263.1 ENSGALT00000022490.1
SCP-2 YBX1 LIMK2 PTPRG
Amino acid derivative metabolism Lipid metabolism, steroid metabolism Nucleic acid metabolism Nucleic acid metabolism Protein metabolism Protein metabolism
Up, Up, Up, Up,
0.55 0.61 0.54 1.40
13.04 12.74 12.52 12.87
ChEST748i8 ChEST532d8 NM_001006164.1
LDH-B PSEN1 Pemt
Up, 1.58 Up, 0.69 Up, 1.02
12.08 12.72 12.59
ENSGALT00000024882.1 ChEST496l3
lplp PDK3
Carbohydrate metabolism Protein metabolism Cellular lipid metabolism, lipid biosynthesis Lipid metabolism Glucose metabolism
Down, 2.73 Up, 0.78
12.48 12.53
ENSGALT00000025553.1
ME1
Carboxylic acid metabolism
Up, 1.72
12.56
ChEST859c9 ENSGALG0000002722.1 NM_001012591.1 ENSGALG00000001139.1
PBE ALG6 HERC4 PTK7
Down, 1.03 Up, 0.92 Up, 0.81 Up, 0.71
12.66 12.61 12.79 12.61
ENSGALT00000001542.1 ENSGALT00000001334.1 ChEST993m11 ChEST568g13 ENSGALT00000000960.1
RPL35 RCJMB04_9m1 RPL5 RPL7A LOC395465
Ribosomal protein 135 Lysyl-trna synthetase Ribosomal protein 15 Ribosomal protein 17a cbp/p300-interacting transactivator
Down, Down, Down, Down, Down,
0.47 0.62 0.49 0.69 0.74
12.69 12.55 12.61 12.74 12.72
ChEST337c15 ENSGALT00000013370.1 ENSGALT00000000422.1
LOC395492 RPL30 PKNOX2
Aldolase a Ribosomal protein 130 pbx/knotted 1 homeobox 2
Down, 1.91 Down, 0.44 Down, 0.55
12.55 12.57 13.04
ENSGALT00000006295.1
ALAS1
5-aminolevulinate synthase
Cellular lipid metabolism Protein metabolism Protein metabolism Cellular macromolecule metabolism, phosphorus metabolism Protein metabolism Amino acid metabolism Cellular protein metabolism, Cellular protein metabolism Nucleobase, nucleoside, nucleotide and nucleic acid metabolism Carbohydrate catabolism Protein metabolism Nucleobase, nucleoside, nucleotide and nucleic acid metabolism Coenzyme metabolism porphyrin metabolism
Down, 0.87
13.01
1
Nonspecific lipid-transfer protein y box binding protein 1 LIM domain kinase 2 MULLER glia protein tyrosine phosphatase 2 Lactate dehydrogenase H subunit Presenilin 1 Phosphatidylethanolamine N-methyltransferase isoform 1 Lipoprotein lipase precursor Pyruvate dehydrogenase complex, E1 component Malic enzyme 1 NADP(+)dependent cytosolic Peroxisomal bifunctional enzyme Hepatocyte growth factor-like hect domain and RLD 4 Fibroblast growth factor receptor CPE-FGFR
FDR = false discovery rate; GTP = guanosine triphosphate.
HEPATIC GENE EXPRESSION IN BROILER CHICKS FED AFLATOXIN B1
367
Table 4. Differentially expressed genes associated with immune system in B1-fed chicks compared with control birds at the end of 21-d treatment period
Transcript ID
Gene symbol
Gene name
Gene ontology
ENSGALT00000005554.1 ChEST691m10 ENSGALT00000001934.1
Gal d I IL10 MAPKK2
Ovomucoid precursor Interleukin 10 receptor, β Mitogen-activated protein kinase kinase 2
ggTRAIL
TNFSF10
ChEST691m6
IL6
Tumor necrosis factor (ligand) superfamily, member 10 Interleukin 6 receptor
Immune response Immune system Plays a critical role in the production of cytokines Tumor necrosis factor receptor binding Immune system
Ratio, aflatoxin/ control (log values)
FDR,1 %
Down, 1.28 Down, 1.28 Down, 0.80
12.71 12.53 12.65
Up, 0.81
12.72
Down, 2.28
12.00
1
FDR = false discovery rate.
(Verma et al., 2004). Insulin like growth factor-1, an important growth promoting gene was downregulated in birds fed 2 mg of AFB1/kg. This could contribute to the observed reduction in growth rates of birds fed AFB1, and these results are consistent with earlier reports on the growth depressing effect of AF in broiler chicks (Huff et al., 1988). Immune Response: Many genes associated with immune function, such as mitogen-activated protein kinase kinase 2, interleukin 10 receptor β, ovomucoid precursor, and interleukin 6 receptor were downregulated, whereas tumor necrosis factor 10 was upregulated in chicks fed 2 mg of AFB1/kg suggesting that AF is also immunotoxic (Table 4). Previous reports suggest that AF at dietary concentrations of 1 mg/kg or more causes a significant reduction in the immune response (Verma et al., 2004). Similar reductions in immune response were also reported earlier in chicks fed 1 mg of AF/kg of diet (Shivachandra et al., 2003). These results indicate an immunosuppressive effect of AF on both humoral and cell-mediated immune responses. Because AF exerts part of its immunosuppressive effects through cytokines (Han et al., 1999), downregulation of interleukins (interleukin 10 and interleukin 6) in the current study is consistent with earlier reports. Decreased immunity in chicks fed AF could make them
susceptible to secondary bacterial and viral infections, which could cause detrimental effects and even lead to death. This hypothesis is supported by the increased mortality rates that were observed in chicks fed AFB1 in the present study. Biotransformation, Detoxification, and Antioxidant Activity. Differentially expressed genes associated with biotransformation, detoxification, and antioxidant activity are summarized in Table 5. Primary hepatic detoxification processes include, xenobiotic biotransformation (phase I metabolism) and the subsequent conjugation of the resulting metabolites (phase II metabolism), making them more water soluble and available for excretion from the body. Phase I metabolism mainly involves the cytochrome P450 (CYP) enzymes. Cytochrome P450 enzymes are associated with several biological interactions involving hydroxylation, epoxidation, dehydrogenation, nitrogen dealkylation, and oxidative deamination (Kumar et al., 2006). Although CYP-mediated reactions are essential for xenobiotic detoxification, they can also generate reactive oxygen species. The microsomal CYP-dependent mono-oxygenase system in the liver plays an essential role in the metabolism of xenobiotics (Akahori et al., 2005). Various CYP isoforms exist in species ranging from archaebacteria to humans (Zuber et al., 2002). The CYP1A1
Table 5. Differentially expressed genes associated with biotransformation, detoxification, and antioxidant activities in aflatoxin B1fed chicks compared with control birds at the end of 21-d treatment period1
Transcript ID
Gene symbol
Gene name
Gene ontology
ChEST332h21
IMP-3
Metalloproteinase inhibitor
ENSGALT00000027702.1
FDX1
ChEST492f11 ENSGALT00000020496.1
CYP2C45 TGFB3
Adrenodoxin mitochondrial precursor (Adrenal ferredoxin) Cytochrome p-450 2c45 Heme oxygenase
Endopeptidase inhibitor activity Electron transport
ENSGALT00000008501.1 ChEST126e10
CYB5R GST α, LOC395611 EH P24369 CYP1A1 CYP2H1 GPx
ChEST807d3 ChEST175g3 X99454.1 M13454.1 NC0061002 1
Ratio, aflatoxin/ control (log values)
FDR, %
Down, 1.07
12.57
Down, 0.49
12.66
Down, 1.59 Up, 0.70
12.66 12.80
NADH-cytochrome b5 reductase Glutathione s-transferase class-α
Electron transport Antiinflammatory, antioxidant Electron transport Antioxidant activity
Down, 1.13 Down, 1.66
12.53 12.53
Epoxide hydrolase CYPB Peptidyl-prolyl cis-trans isomerase Cytochrome P450 1A1 Cytochrome P450 2H1 Glutathione peroxidase
Detoxification Xenobiotic metabolism Xenobiotic metabolism Xenobiotic metabolism Xenobiotic metabolism
Down, 0.57 Up, 0.86 Up, 1.63 Up, 2.01 Down, 1.59
12.77 12.60 12.02 11.59 10.63
FDR = false discovery rate; NADH = nicotinamide adenine dinucleotide phosphate.
368
YARRU ET AL.
Table 6. Differentially expressed genes associated with cell proliferation in aflatoxin B1-fed chicks compared with control birds at the end of 21-d treatment period1
Transcript ID
Gene symbol
ChEST752c24
NR1D2
ENSGALT00000026260.1
DAX1
ENSGALT00000006822.1 ENSGALG00000017034.1
HDAC4 FOXO1A
ENSGALG00000001139.1 NM_205187.1 ENSGALT00000000605.1 ENSGALT00000001011.1
FGFRL1 SOX11 Bach2 ATBF1
FDR, %
Gene name
Gene ontology
Nuclear receptor subfamily 1, group d, member 2 Adrenal hyoplasia protein
Nucleobase, nucleoside, nucleotide, and nucleic acid metabolism Nucleobase, nucleoside, nucleotide, and nucleic acid metabolism Cell cycle progression Nucleic acid metabolism, transcription
Up, 2.12
12.66
Up, 0.44
12.79
Up, 0.71 Up, 0.80
12.79 12.61
Cell proliferation Transcription regulation Transcriptional regulator Transcription factor
Up, 0.71 Down, 1.19 Down, 1.02 Up, 0.62
12.67 12.68 12.61 12.67
Transcription factor
Up, 0.56
12.54
Transcription factor Transcription Nucleic acid metabolism
Up, 1.74 Up, 1.40 Up, 0.53
12.51 12.56 12.89
Required for entry into S-phase and mitosis in cell proliferation Cell cycle progression and development. Inhibits Wnt signaling pathway Cellular protein metabolism mRNA splicing, nonsense mediated decay pathway Nucleic acid metabolism Rate-limiting step in the pathway of polyamine biosynthesis Regulate cell growth and differentiation Transcription cofactor activity Cellular proliferation and differentiation in target tissues. Pyrimidine-specific nuclease with preference for C Nucleotide-binding
Down, 0.86
12.59
Up, 0.44 Down, 3.50 Down, 1.20 Down, 0.55
12.79 11.80 12.67 12.52
Down, 0.51 Up, 1.09
12.73 12.53
Up, 0.98 Down, 0.44 Up, 0.70
12.51 12.69 12.82
Up, 1.38
12.57
Up, 0.82
12.59
Down, 0.53
12.59
Down, 0.54 Down, 0.76
12.56 12.65
Down, 1.14
12.65
ENSGALT00000006994.1 ChEST752i6 ChEST800g22
TF9 SOX5 PPARA
M_001012559.1
CDC2
ENSGALT00000024179.1 ChEST372k22 Contig_114_reverse ENSGALT00000017388.1
HDAC2 DKK3 FKBP1B P50594
Histone deacetylase 4 forkhead box O1A (rhabdomyosarcoma) Fibroblast growth factor receptor Sox11 transcription factor btb and cnc homology 2 α-fetoprotein enhancer-binding protein v-jun sarcoma virus 17 oncogene homolog (avian) Transcription factor sox-9 sry (sex determining region y)-box 5 Peroxisome proliferator-activated receptor α Cell division cycle 10, g1 to s and g2 to m Histone deacetylase 2 Dickkopf homolog 3 (Xenopus laevis) fk506 binding protein 1b, 12.6 kda Protein mago nashi homolog
ChEST90f21 ENSGALT00000026527.1
PAPOLA ODC1
Poly(a) polymerase α Ornithine decarboxylase 1
ENSGALT00000026837.1 ENSGALT00000023380.1 ENSGALT00000021168.1
FRZB LDB2 ESR1
ENSGALT00000018678.1
NPM1
Frizzled-related protein Lim domain binding 2 Estrogen receptor (ER; estradiol receptor) Ribonuclease
ChEST200a12
Cpeb3
ENSGALT00000012486.1
NCL
ENSGALT00000003436.1 ENSGALT00000010377.1
NPM1 UBE2I
ChEST200b24
TGFB3,
JUN
Ratio, aflatoxin/ control (log values)
Cytoplasmic polyadenylation element binding protein 3 Nucleolin Nucleophosmin Ubiquitin-conjugating enzyme e2i (ubc9 homolog, yeast) Transforming growth factor, β 3
rRNA transcription and ribosome assembly Nucleolar ribonucleoprotein structures Covalent attachment of ubiquitin-like protein SUMO-1 to other proteins Cellular morphogenesis, regulation of cell cycle, regulation of cell size
1
FDR = false discovery rate.
is known to metabolize various drugs and xenobiotics (Klein et al., 2003), and is also known to activate certain pro-mutagens to their carcinogenic forms (Haas et al., 2006; Kumar et al., 2006). Similarly, CYP 2H1 is known to be actively involved in xenobiotic metabolism (Hamilton et al., 1993). These CYP isoforms are involved in biotransformation of AFB1 to the highly toxic and carcinogenic metabolite AF-8, 9-epoxide in poultry (Klein et al., 2003). Aflatoxin-8, 9- epoxide is detoxified by epoxide hydrolase (Tiemersma et al., 2001) and GST enzymes (Tiemersma et al., 2001; Klein et al., 2003). Because CYP genes were upregulated and epoxide hydrolase and GST genes were downregulated in birds fed 2 mg of AFB1/kg, there could be a greater chance for formation of AF-8, 9-epoxide and less chance for AFB1 detoxification. Furthermore, overexpression of
these CYP450 isoforms was shown to induce chronic oxidative stress by generating more reactive oxygen species, possibly leading to hepatocellular injury and death (Kumar et al., 2006). It is evident from the results of the present study that transcriptional activation of CYP1A1 and CYP2H1 isoforms, in response to AF has the potential to increase oxidative stress. Furthermore, antioxidant genes such as GST and glutathione peroxidase, which could protect against oxidative stress, were downregulated in birds fed 2 mg of AFB1/ kg, and this could further hamper the bird’s ability to protect itself from oxidative damage. All of these factors could contribute to the toxicological and pathological effects of AF. Cell Proliferation. Cell proliferation is a representation of cell growth and its active cell division. Aflatoxin
369
HEPATIC GENE EXPRESSION IN BROILER CHICKS FED AFLATOXIN B1
Table 7. Differentially expressed genes associated with blood clotting in aflatoxin B1-fed chicks compared with control birds at the end of 21-d treatment period
Transcript ID
Gene symbol
ENSGALT00000010110.1
HS2ST1
ENSGALT00000009795.1
HS6ST2
ENSGALG00000001780.1–1
PROC
ENSGALT00000010525.1 ENSGALG00000016833.1
F9 VAP
ENSGALT00000010525.1 ENSGALG00000004591.1
F9 ATIII
Gene name
Gene ontology
Ratio, aflatoxin/ control (log values)
Heparan sulfate 2-O-sulfotransferase Heparan sulfate 6-O-sulfotransferase-2 Anticoagulant protein C precursor Coagulation factor IX Coagulation factor X precursor (Stuart factor) Coagulation factor Antithrombin-III precursor
Blood coagulation
Up, 0.70
12.75
Blood coagulation
Up, 0.89
12.60
Inactivator of coagulation factors va and viiia Blood coagulation Blood coagulation
Up, 0.94
12.77
Down, 1.29 Down, 0.81
11.36 12.52
Blood coagulation Generation of antithrombin-III
Down, 1.29 Up, 0.57
11.36 12.87
FDR,1 %
1
FDR = false discovery rate.
B1 in the present study upregulated many genes associated with cell proliferation, including peroxisome proliferator-activated receptor α, nuclear receptor subfamily 1 d 2, bHLH transcription factor, ornithine decarboxylase, histone deacetylase 2, transcription factor sox-9, v-jun sarcoma virus 17 oncogene homolog, α-fetoprotein enhancer-binding protein, and forkhead box O1A (Table 6). Upregulation of the above mentioned genes could contribute to increased cell proliferation rates in birds fed 2 mg of AFB1/kg. This could be the reason for hepatocarcinomas observed in rats fed AF (Kalengayi and Desmet, 1975; Butler and Hempsall, 1981). Even though broilers do not generally live long enough to develop cancer, AF-related diseases adversely affect their health and could cause slowing of growth and decreased resistance to microbial pathogens. Blood Clotting. Genes involved in blood coagulation [coagulation factor IX, coagulation factor X precursor (Stuart factor)] were downregulated, and anticoagulant protein C precursor, which is an inactivator of coagulation factors Va and VIIIa, and antithrombin-III precur-
sor were upregulated in birds fed 2 mg of AFB1/kg (Table 7). Previous reports suggest that AF intoxication would lead to changes in coagulation profiles in lambs leading to an increased prothrombin time (Fernandez et al., 1995). The authors suggested that prothrombin times could be used as an indicator of aflatoxicosis in lambs. Increased clotting time was observed previously in chicks treated with single oral doses of AFB1 (50 µg/kg of BW; Obasi et al., 1994), and in chicks fed 10.0 µg/g of AF (Doerr and Hamilton, 1981). Baker and Green (1987) stated that the coagulation defect in aflatoxicosis is primarily due to diminished hepatic synthesis of coagulation factors. Clark et al. (1986) observed a significant decrease in factor IX, VIII, and V activities in AF-treated rabbits. They concluded that the coagulation factor deficiencies were the result of decreased factor synthesis due to hepatic insufficiency. Bababunmi and Bassir (1982) found relatively low concentrations of blood clotting factors II, VII, IX, and X in the plasma of birds fed AF. Alteration in the expression of the above-mentioned genes could be the reason
Table 8. Differentially expressed genes associated with cell skeletal structure in aflatoxin B1-fed chicks compared with control birds at the end of 21-d treatment period1 Ratio, aflatoxin/ control (log values)
FDR, %
Up, 0.76
12.72
Up, 0.99
12.77 12.59
12.97 12.61 12.63 12.55
Transcript ID
Gene symbol
Gene name
Gene ontology
ChEST471d22
Dnm1
Dynamin-1
ENSGALT00000008890.1
GJA1
Gap junction protein
ChEST148d1
LOC396480
Otokeratin
Microtubule-associated forceproducing protein Form connexons between cells for low molecular weight material diffusion Cytoskeleton
ENSGALT00000014968.1
KRT19
Keratin 19
Cytoskeleton
ENSGALT00000019859.1
arp3
Cell motility
ENSGALT00000019859.1 ENSGALT00000009107.1 ENSGALT00000015293.1 ENSGALT00000018395.1
ACTA2 LOC395261 RCJMB04_23c5 DCN
Actin-related protein 3 homolog (yeast) Actin, α 2, smooth muscle, aorta Filamin Actinin, α 2 Decorin
Down, 2.76 13.01 Up, 0.68 13.01 Down, 0.58
Cell motility Actin binding F-actin cross-linking bundling protein Affect the rate of fibril formation
Down, Down, Down, Down,
1
FDR = false discovery rate.
0.58 1.26 0.71 0.48
13.01 12.97
370
YARRU ET AL.
for the impaired coagulation in birds fed AF ultimately leading to hemorrhaging in the birds (Sandhu et al., 1995). Cell Skeletal Structure. Nine genes associated with cell skeletal structure were differentially expressed in the livers of chicks fed AFB1 (Table 8). Six of the 9 genes were downregulated, and 3 were upregulated. The cytoskeleton of cells is a dynamic structure whose functions include maintaining cell shape, cell protection, enabling cellular motion, and it also plays important roles in intracellular transport and cellular division. Therefore, changes in the expression of genes associated with cytoskeletal structure may negatively affect cell function. Ellinger-Ziegelbauer et al. (2004) hypothesized that changes in gene expression associated with cell structure organization may also be related to the lesions observed in the hepatocytes of rats fed AF. Ellinger-Ziegelbauer et al. (2004) dosed rats with AF and observed an upregulation of several genes encoding proteins that function in cytoskeletal organization. The authors concluded that changes in the cytoskeleton are likely both induced by and have an influence on the necrotic process. As suggested by Ellinger-Ziegelbauer et al. (2004), changes in gene expression in the current study may be an effort by cells to prevent cell necrosis, to assist in the regeneration of surrounding cells, or both. Current findings suggest that AFB1 at concentrations of 1 and 2 mg/kg has detrimental effects on feed intake, BW gain, and liver weights and adverse effects on serum TP, Ca, and P. Exposure of chicks to a 2 mg of AFB1/kg of diet results in physiological responses associated with altered gene expression in broiler chick livers. However, future studies with pair fed birds will determine whether the differential hepatic expression of these genes is related to direct effects of AFB1 or to secondary effects on the liver associated with reduced feed intake.
ACKNOWLEDGMENTS I would like to thank Chada S. Reddy, associate professor, biomedical sciences, University of Missouri, Columbia, MO, for his valuable suggestions. I also thank Roxanne Kutz, laboratory technician, Department of Animal Sciences, University of Missouri, Columbia, MO for ordering materials and reagents required for the study.
REFERENCES Akahori, M., A. Takatori, S. Kawamura, S. Itagaki, and Y. Yoshikawa. 2005. No regional differences of cytochrome P450 expression in the liver of cynomolgus monkeys (Macaca fascicularis). Exp. Anim. 54:131–136. Bababunmi, E. A., and O. Bassir. 1982. A delay in blood clotting of chickens and ducks induced by aflatoxin treatment. Poult. Sci. 61:166–168. Baker, D. C., and R. A. Green. 1987. Coagulation defects of aflatoxin intoxicated rabbits. Vet. Pathol. 24:62–70.
Büchau, A. S., and R. L. Gallo. 2007. Innate immunity and antimicrobial defense systems in psoriasis. Clin. Dermatol. 25:616– 624. Butler, W. H., and V. Hempsall. 1981. Histochemical studies of hepatocellular carcinomas in the rat induced by aflatoxin. J. Pathol. 134:157–170. Clark, J. D., C. E. Greene, J. P. Calpin, R. C. Hatch, and A. V. Jain. 1986. Induced aflatoxicosis in rabbits: Blood coagulation defects. Toxicol. Appl. Pharmacol. 86:353–361. Cui, X., and G. A. Churchill. 2003. Statistical tests for differential expression in cDNA microarray experiments. Genome Biol. 4:210–215. Dennis, G., B. Sherman, D. Hosack, J. Yang, W. Gao, H. C. Lane, and R. Lempicki. 2003. DAVID: Database for annotation, visualization, and integrated discovery. Genome Biol. 4:3. Doerr, J. A., and P. B. Hamilton. 1981. Aflatoxicosis and intrinsic coagulation function in broiler chickens. Poult. Sci. 60:1406– 1411. Eisen, M. B., P. T. Spellman, P. O. Brown, and D. Botstein. 1998. Cluster analysis and display of genome-wide expression patterns. Proc. Natl. Acad. Sci. USA 95:14863–14868. Ellinger-Ziegelbauer, H., B. Stuart, B. Wahle, W. Bomann, and H. Ahr. 2004. Characteristic expression profiles induced by genotoxic carcinogens in rat liver. Toxicol. Sci. 7:19–34. Eraslan, G., M. Akdogan, E. Yarsan, F. Sahindokuyucu, D. Essiz, and L. Altintas. 2005. The effects of aflatoxins on oxidative stress in broiler chickens. Turk. J. Vet. Anim. Sci. 29:701–707. Fernández, A., J. J. Ramos, T. Saez, M. C. Sanz, and M. T. Verde. 1995. Changes in the coagulation profile of lambs intoxicated with aflatoxin in their feed. Vet. Res. 26:180–184. Flanagan, N. 2005. Advances in microgenomics: Less is more. Genet. Eng. News 25:1–3. Haas, S., C. Pierl, V. Harth, B. Pesch, S. Rabstein, T. Bruning, Y. Ko, U. Hamann, C. Justenhoven, H. Brauch, and H. Fischer. 2006. Expression of xenobiotic and steroid hormone metabolizing enzymes in human breast carcinomas. Int. J. Cancer 119:1785– 1791. Hamilton, J. W., C. A. Louis, K. A. Doherty, S. R. Hunt, M. J. Reed, and M. D. Treadwell. 1993. Preferential alteration of inducible gene expression in vivo by carcinogens that induce bulky DNA lesions. Mol. Carcinog. 8:34–43. Han, S. H., Y. J. Jeon, S. S. Yea, and K. H. Yang. 1999. Suppression of the interleukin-2 gene expression by aflatoxin B1 is mediated through the down-regulation of the NF- AT and AP-1 transcription factors. Toxicol. Lett. 108:1–10. Huff, W. E., R. B. Harvey, L. F. Kubena, and G. E. Rottinghaus. 1988. Toxic synergism between aflatoxin and T-2 toxin in broiler chickens. Poult. Sci. 67:1418–1423. Kalengayi, M. M., and V. J. Desmet. 1975. Sequential histological and histochemical study of the rat liver during aflatoxin B1induced carcinogenesis. Cancer Res. 35:2845–2852. Kerr, K. M., and G. A. Churchill. 2002. Bootstrapping cluster analysis: Assessing the reliability of conclusions from microarray experiments. Proc. Natl. Acad. Sci. USA 98:8961–8965. Klein, P. J., T. R. Van Vleet, J. O. Hall, and R. A. Coulumbe. 2003. Effects of dietary butylated hydroxytoluene on aflatoxin B1-relevant metabolic enzymes in turkeys. Food Chem. Toxicol. 41:671–678. Kubena, L. F., R. B. Harvey, W. E. Huff, D. E. Corrier, T. D. Phillips, and G. E. Rottinghaus. 1990. Efficacy of hydrated sodium calcium aluminosilicate to reduce the toxicity of aflatoxin and T-2 toxin. Poult. Sci. 69:1078–1086. Kuiper-Goodman, T. 1995. Mycotoxins: Risk assessment and legislation. Toxicol. Lett. 82–83:853–859. Kumar, H., K. Bhaskarannair, and R. Kuttan. 2006. Inhibition of drug metabolizing enzymes (Cytochrome P450) in vitro as well as in vivo by Phyllanthus amarus Schum & Thonn. Biol. Pharm. Bull. 29:1310–1313. Ledoux, D. R., G. E. Rottinghaus, A. J. Bermudez, and M. Alonso– Debolt. 1999. Efficacy of hydrated sodium calcium aluminosilicate to ameliorate the toxic effects of aflatoxin in broiler chicks. Poult. Sci. 78:204–210. National Research Council. 1994. Nutrient Requirements of Poultry. 9th rev. ed. Natl. Acad. Sci., Washington, DC.
HEPATIC GENE EXPRESSION IN BROILER CHICKS FED AFLATOXIN B1 Obasi, S. C., O. U. Njoku, and O. Obidoa. 1994. Effects of single oral doses of scopoletin and aflatoxin B1 on the clotting time, serum cholesterol and phospholipid levels of chicks. Indian J. Physiol. Pharmacol. 38:89–94. Ortatatli, M., and H. Oğuz. 2001. Ameliorative effects of dietary clinoptilolite on pathological changes in broiler chickens during aflatoxicosis. Res. Vet. Sci. 71:59–66. Saal, L., C. Troein, J. Vallon-Christersson, S. Gruvberger, A. Borg, and C. Peterson. 2002. BioArray Software Environment (BASE): A platform for comprehensive management and analysis of microarray data. http://genomebiology.com/2002/3/8/ software/0003 Saeed, A. I., V. Sharov, J. White, W. Li, N. Liang, J. Bhagabati, M. Braisted, T. Klapa, M. Currier, A. Thiagarajan, M. Strun, A. Snuffin, D. Rezantsev, A. Popov, E. Ryltsov, I. Kostukovich, Z. Borisovsky, A. Liu, V. Vinsavich, and J. Quackenbush. 2003. TM4: A free, open-source system for microarray data management and analysis. Biotechniques 34:374–378. Sandhu, B. S., H. Singh, and B. Singh. 1995. Pathological studies in broiler chicks fed aflatoxin or ochratoxin and inoculated with inclusion body hepatitis virus singly and in concurrence. Vet. Res. Commun. 19:27–37. SAS Institute. 1996. SAS User’s Guide: Statistics. SAS Institute, Cary, NC. Settivari, R. S., S. Bhusari, T. E. Evans, P. A. Eichen, L. B. Hearne, E. Antoniou, and D. E. Spiers. 2006. Genomic analysis of the impact of fescue toxicosis on hepatic function. J. Anim. Sci. 84:1279–1294. Shin, E. S., S. Y. Cho, E. H. Lee, S. J. Lee, I. S. Chang, and T. R. Lee. 2006. Positive regulation of hepatic carnitine palmitoyl transferase 1A (CPT1A) activities by soy isoflavones and L-carnitine. Eur. J. Nutr. 45:159–164. Shivachandra, S. B., R. L. Sah, S. D. Singh, J. M. Kataria, and K. Manimaran. 2003. Immunosuppression in broiler chicks fed aflatoxin and inoculated with fowl adenovirus serotype-4 (FAV-4)
371
associated with hydropericardium syndrome. Vet. Res. Commun. 27:39–51. Smith, J. E., G. Solomons, C. Lewis, and J. G. Anderson. 1995. Role of mycotoxins in human and animal nutrition and health. Nat. Toxins 3:187–192. Surai, P. F. 2002. Natural antioxidants and mycotoxins. Pages 455– 509 in Natural Antioxidants in Avian Nutrition and Reproduction. 1st ed. Nottingham University Press, Nottingham, UK. Tiemersma, E. W., R. E. Omer, A. Bunschoten, P. Van’t veer, F. J. Kok, M. O. Idris, A. M. Kadaru, S. S. Fedail, and E. Kampman. 2001. Role of genetic polymorphism of glutathione-S transferase T1 and microsomal epoxide hydrolase in aflatoxin-associated hepaticellular carcinoma. Cancer Epidemiol. Biomarkers Prev. 10:785–791. Verma, J., T. S. Johri, B. K. Swain, and S. Ameena. 2004. Effect of graded levels of aflatoxin, ochratoxin and their combinations on the performance and immune response of broilers. Br. Poult. Sci. 45:512–518. Washburn, K. W., D. Ames, and R. D. Wyatt. 1976. Effects of dietary citrinin and aflatoxin on leg problems of broilers grown on wire floors. Poult. Sci. 55:1977–1979. Wolfinger, R. D., G. Gibson, E. D. Wolfinger, L. Bennett, H. Hamadeh, P. Bushel, C. Afshari, and R. S. Paules. 2001. Assessing gene significance from cDNA microarray expression data via mixed models. J. Comput. Biol. 8:625–637. Wu, C. 1995. Heat shock transcription factors: Structure and regulation. Annu. Rev. Cell Dev. Biol. 11:441–469. Wu, H., K. Kerr, and G. Churchill. 2003. Maanova: A software package for the analysis of spotted cDNA microarray experiments. Pages 313–431 in the Analysis of Gene Expression Data: An Overview of Methods and Software. Springer, New York, NY. Zuber, R., E. Anzenbacherova, and P. Anzenbacher. 2002. Cytochrome P450 and experimental models of drug metabolism. J. Cell. Mol. Med. 6:189–198.