Aug 25, 2004 - Chem. 273(44), 29202-29209. 65. Nelms K, Keegan AD, Zamorano J, Ryan JJ, and Paul ... Rudd CE. (1995) Proc. Natl. Acad. Sci.
August 25, 2004 AfCS Research Reports
Vol. 2 No. 14 DA www.signaling-gateway.org/reports/v2/DA0014/DA0014.htm
Molecular Interaction Map of a Macrophage Kanae Oda,1- 3 Tomomi Kimura,1, 3 Yukiko Matsuoka,4 Akira Funahashi,4 Masaaki Muramatsu,3 and Hiroaki Kitano1, 2, 5 1. The Systems Biology Institute, Tokyo, Japan 2. Department of Fundamental Science and Technology, Keio University 3. Dept. Molecular Epidemiology, Medical Research Institute. Tokyo Medical and Dental University, Tokyo, Japan 4. ERATO-SORST Kitano Symbiotic Systems Project, Japan Science and Technology Agency, Tokyo, Japan 5. Sony Computer Science Laboratory, Inc., Tokyo, Japan KO and TK equally contributed to this paper. Abstract Identifying intracellular molecular interactions is the first step toward understanding complex dynamics and mechanisms of the cell. We have created a comprehensive map of molecular interactions in a macrophage based on published literature. The map was created to analyze the experimental data sets produced by the Alliance for Cellular Signaling (AfCS). Therefore, we have extensively focused on signal transduction pathways that are targeted by the AfCS and have included essential metabolism, transcription, and secretion pathways that may be relevant. The map was created using CellDesigner, a software we have developed for molecular interaction map construction, and represented in Systems Biology Markup Language (SBML). This report describes notations used in the interaction map and the main features of CellDesigner and provides a list of all published literature that has been referenced in creating version 1.0 of the map.
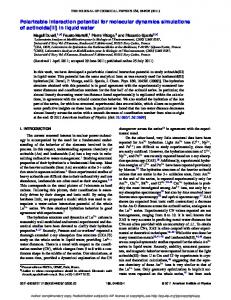
1. The Macrophage Map 1.1 General Features We created a comprehensive macrophage model of molecular interactions, including Ca 2+ signaling via G protein-coupled receptors (GPCRs), cytokine signaling, phagocytosis of oxidized low-density lipoprotein (oxLDL), production of reactive oxygen species (ROS) as well as glucose and lipid metabolism, that can be used as a first step towards a model-based analysis of a signaling network (Fig. 1). The map data (PDF and XML files in SBML format) can be downloaded from the AfCS/Nature Signaling Gateway via this document and the Systems Biology Institute Web site (http://www.systems-biology.org/002/). To create this model, we collected legacy knowledge from 234 published manuscripts (see the list of references for the Molecular Interaction Map of a Macrophage) and also referred to the ligand descriptions on the AfCS/Nature Signaling Gateway Web site. Although there were some exceptions, the criteria used to include possible molecular interactions from the literature were 1) modules that were confirmed to exist in macrophage cell, in culture cell lines, or in vivo; 2) signals that were confirmed by at least two independent articles; and 3) data published in the last decade.
1.2 Modules A total of 506 reactions and 678 species were included in this map. A “species” is a term defined by SBML as “an entity that takes part in reactions,” and it distinguishes the different states that are caused by enzymatic modification, combination, dissociation, and translocation. To distinguish the different states of a component in the same compartment in detail, we only need to assign a unique name to each state using suitable subscripts. For example, states of the protein that translocates from cytosol to plasma membrane can be distinguishable by names such as “XXcyt” and “XXpm.” Since SBML is a machine-readable format, all the information can be used for a range of computational analysis, including computer simulation. The breakdown of the species shown on this map is as follows: 363 proteins, 15 ions, 135 simple molecules, 113 oligomers, and 39 genes. In the number of species, 11 degraded products and 2 unknown molecules are also included. The nucleotides, ROS, carbohydrates, lipids, coenzymes, peptides, and amino acids are all shown as “simple molecules” in this version. Among 363 protein species, we identified 281 molecules, that is, 6 G protein subunits, 121 enzymes (including 47 kinases), 40 receptors, 7 ion channels, 40 transcription factors and their cofactors, 7 transporters, 14 cytokines, and 46 adaptor proteins. 1.3 Inputs and Outputs As inputs, we included 22 out of 26 ligands that were selected and tested for the ligand screening project in RAW 264.7 cells by the AfCS. The list includes interleukin1â (IL-1â), interleukin-4 (IL-4), interleukin-6 (IL-6), interleukin-10 (IL-10), interferon-á (IFN-á), interferon-â (IFN-â ), interferon-ã (IFN-ã), macrophage colonystimulating factor (M-CSF), granulocyte-macrophage colonystimulating factor (GM-CSF), transforming growth factor-â (TGF-â), macrophage inflammatory protein-1á (MIP-1á), monocyte chemotactic protein 1 (MCP-1), platelet activating factor (PAF), sphingosine-1-phosphate (S1P), lysophosphatidic acid (LPA), prostaglandin E2 (PGE2), complement component 5a (C5a), uridine 5’-diphosphate (UDP), uridine 5’-triphosphate (UTP), adenosine 5’triphosphate (ATP) (in place of 2-methyl-thio-ATP), lipopolysaccharide (LPS), and immunoglobulin 2a (IgG2a).
1
Fig. 1. Molecular Interaction Map of a Macrophage. This map was created with CellDesigner version 2.0 (http:// www.systems-biology.org/002/). A total number of 506 reactions and 678 species were included. This map is available in a higher resolution PDF file via the online report.
August 25, 2004 AfCS Research Reports Vol. 2 No. 14 DA www.signaling-gateway.org/reports/v2/DA0014/DA0014.htm
2
August 25, 2004 AfCS Research Reports
Vol. 2 No. 14 DA www.signaling-gateway.org/reports/v2/DA0014/DA0014.htm
The four other synthesized ligands (isoproterenol, PAM2CSK4, PAM3CSK4, and resiquimod [R-848]) were not included in this map. In addition, we also included tumor necrosis factor-á (TNF-á) and oxLDL as input signals because they have well-established roles in macrophages during immune response and formation of foam cells in atherosclerotic lesions, respectively. As outputs, we described the induction of second messengers (such as Ca2+ and cAMP) and the release of 9 cytokines, 10 biogenic lipids, and 4 ROS.
show a paradoxical relationship with gene expression, thus it is important that we directly assess the presence of signaling proteins using direct measurement and not just by inference. In addition, detailed time-course measurements of protein levels combined with phosphoprotein assays and shRNAi data generated by AfCS labs will help researchers to reproduce and analyze dynamics of the network. We will periodically update the map on the AfCS Web site based on the most current data available.
1.4 Ambiguity Issues and Updating During the construction of the map, there arose unclear cases for the specific expression of a gene in RAW 264.7 cells as well as for the specific occurance of proteinprotein interactions. For example, the cross talk between NFêB and PPARã was shown in pluripotent mesenchymal stem cells, but it is not clear if such cross talk also exists in macrophages. In addition, there are conflicts among published papers and possible alternative explanations for certain interactions because of the varied experimental systems studied. For legacy data that depend fully on published literature, there are no clear means for making decisions on such cases. Therefore, we have taken a heuristic approach. First, we ensure that we incorporate molecules and interactions that are certain to exist and well agreed upon in the community. This can be determined on the basis of consistency among research papers as well as numbers of review papers. In cases where several interacting partners for one protein are reported, priority is given to those with demonstrated biological activity in macrophages. For example, there are several reported ligands for PPARgamma, but only 9-HODE and 13-HODE are represented because they have known effects in macrophages. Selections of this kind are made because of space constraints on the map. However, when space permits, all possible interactions are included. Second, when ambiguity exists between papers based on in vivo and in vitro experiments, we opt for conclusions from in vivo experiments. When certain interactions are only ambiguously reported, or not reported but known to exist in a variety of different cell types, we look at reports that use the embryologically nearer cell types to monocyte-derived macrophages, such as bone marrow stem cells, to increase the reliability of the map. Although some interactions are incorporated hypothetically, such as the IRAK1-TRAF6-TAK1-TAB1-TAB2 cascade, molecules and interactions that do not meet the criteria described above are not included in version 1.0 of the map. In the future we hope to develop a consistent methodology to score the reliability of the map based on legacy data and recalibration based on controlled comprehensive measurements. The version 1.0 map is intended to be comprehensive but not necessarily exhaustive. To create an exhaustive map we need hard evidence on which proteins exist in RAW 264.7 cells as well as which genes are expressed. However, the presence of a protein can sometimes
1.5 Future Plan Our next step will be a systems-level analysis using real data retrieved from quantitative experiments (1). To do this, we need a highly reliable data set that includes expression levels, time course information, and results of perturbation effects. Quantitative modeling, simulation, and analysis of a particular focused subset of the system, as seen in the FXM (Focus on X Module) project, will be the next step. Based on this map, we are going to create another smaller but more detailed model, including isoforms. Using the SBW-SBML platform, we can easily share and revise this map, which will facilitate sharing and exchange of views in this project. The other aspect of our future plan is to incorporate data derived from the RIKEN FANTOM3 project, which measures the expression profile of all transcription start sites, including that of noncoding RNA. Contrary to FXM, which is focused on specific cascades but measured in depth, FAMTON3-based analysis will be genome-wide but only with expression profiles. Our challenge is to create a system of model-based analysis methods that can accommodate these two extremes. 2. Graphical Notations 2.1 Rationale behind the Notations Most diagrams in published papers are drawn using informal notations with sets of arrows, bar-headed lines, and circles roughly representing activation, inhibition, and the proteins involved, respectively. Fig. 2 is a typical example of just such a diagram for a MAPK cascade in a mammalian cell. In this diagram, the arrows may implicate several different reactions. For example, the arrow from Ras to Raf (marked as 1 in Fig. 2) appears to indicate that Ras activates Raf. However, in reality, Ras enhances plasma membrane translocation of Raf. Thus, this arrow is more accurately read as recruitment or translocation, rather than activation. Two arrows originating from ERK to RSK and c-Myc (marked as 2 in Fig. 2) are interpreted as activation of RSK and c-Myc by ERK. However, the same representation could also be interpreted as one complex (ERK) that splits into two subcomponents (RSK and c-Myc). The reason that we exclude this interpretation is because we already know some of the properties of the components involved, not because of anything within the diagram itself. How should we interpret
3
August 25, 2004 AfCS Research Reports
Vol. 2 No. 14 DA www.signaling-gateway.org/reports/v2/DA0014/DA0014.htm
PDK-1
SOS
Ras
1
Raf
MKK
ERK
2
RSK
nucleus
3
RSK
CREB
c-Myc PKC
Src
Fig. 2. An example of an informal arrows-and-bars diagram. In this example, the same arrow pattern is used to represent three different reactions: activation, dissociation, or translocation, as follows. (1) The arrow (blue) from Ras to Raf indicates that Ras activates Raf. However, in reality, Ras enhances plasma membrane translocation of Raf. This arrow is more accurately read as “recruitment” or “translocation,” rather than activation. (2) Two arrows (light green) originating from ERK to RSK and c-Myc are interpreted as activation of RSK and c-Myc by ERK. However, the same representation could also be interpreted as one complex (ERK) that splits into two subcomponents (RSK and c-Myc). (3) The arrow (orange) is meant to indicate translocation of RSK from cytosol to nucleus rather than activation of RSK by RSK itself.
the arrow leading from RSK to RSK (marked as 3 in Fig. 2)? In this case, the arrow is meant to be read as the translocation of RSK from cytosol to nucleus, instead of activation of RSK by RSK itself. Therefore, among these simple examples, there are three possible interpretations of the same arrow symbol—activation, dissociation, and translocation. Not only do notations in Fig. 2 have multiple meanings, they are ambiguous and unable to represent essential information (and therefore not machine readable). Correct interpretation depends upon the reader’s foreknowledge. For example, two arrows leading to Raf from PKC and Src indicate the activation of Raf by these two kinases. However, it is unclear what the mechanisms are, which residues are phosphorylated, or which is the first modulator of Raf. Accompanying text can supplement missing information to explain otherwise ambiguous points; however, in some cases the text can be more ambiguous than the diagrams.
Kurt Kohn may have been the first to propose well-defined canonical representations for molecular interactions (2,3), and other researchers have been working on alternative representations (4-6). Unfortunately, none of the proposals has been widely used for a variety reasons. For example, there is no software tool to create a Kohn map efficiently, and this type of representation does not allow for explicit display of temporal processes. Other notations have different shortcomings. Circuit schematics used in electronics are ideal examples of information display in a graphical but unambiguous manner. Engineers can reproduce the circuits drawn in the schematics simply from the information contained in the diagram. Although the interactions may be substantially more complex, one of our first goals in systems biology is to create standard graphical notations that unambiguously represent molecular interactions of biological systems. 2.2 A Process Diagram A successful graphical notation system must (1) allow representation of diverse biological objects and interactions; (2) be semantically and visually unambiguous; (3) be able to incorporate notations; (4) allow tools to convert a graphically represented model into mathematical formulas for analysis and simulation; and (5) have software support to draw the diagrams. Although several graphical notation systems have already been proposed (2-6), each has obstacles to becoming a standard. Kitano proposed a graphical notation system for biological networks (7) designed to express sufficient information in a clearly visible and unambiguous way. Using these notations, the molecular interactions shown in Fig. 2 can be graphically represented as shown in Fig. 3. The filled arrow (blue) in Fig. 2 is replaced by an open arrow and a circle-headed line in Fig. 3. The open arrow (blue) indicates translocation of Raf from cytosol to plasma membrane, and the circle-headed line (blue) from Ras to the open arrow indicates that Ras promotes translo-
Fig. 3. A process diagram with a consistently defined notation system. The notation system used by CellDesigner can describe biochemical reactions in more detail than that used in Fig. 2. The use of specific symbols helps to distinguish events such as activation, translocation, or dissociation. In addition, the specific biochemical state of a molecule can be defined.
4
August 25, 2004 AfCS Research Reports
Vol. 2 No. 14 DA www.signaling-gateway.org/reports/v2/DA0014/DA0014.htm
cation of Raf to plasma membrane, where Raf is fully activated via phosphorylation on both tyrosine-341 and serine338 residues by Src and PKC, respectively. Indeed, the interaction of Ras with Raf is generally indicated by an arrow used for activation, but this process is actually the translocation of Raf, which is stimulated by Ras. Each of the two arrows (light green) originating from ERK to RSK and cMyc in Fig. 2 is represented in a very different way in Fig. 3. The arrow heading to RSK is replaced by a circle-headed line that indicates that RSK is phosphorylated by ERK and subsequently stimulates its autophosphorylation. The three filled arrows (light green) between four RSK nodes indicate the state transitions caused by phosphorylation. Each state of phosphorylation can be described sequentially. On the other hand, the pathway from ERK to c-Myc is interpreted as ERK homodimer formation and translocation to the nucleus, where homodimerized ERK activates c-Myc. When the reaction is described in this manner, an interpretation such as “one complex (ERK) split into two subcomponents (RSK and c-Myc)” is impossible. The translocation of RSK from cytosol to Species:
Reactions:
Protein
State Transition
nucleus is shown with the open arrow (orange) and can be easily distinguished from state transition or catalysis. Overall, all reactions in Fig. 3 are easy to understand at a glance compared with the conventional informal notations. The notations also show specific characteristics of a protein. For example, readers can quickly recognize that SOS is a guanine nucleotide exchange factor for Ras just by looking at this diagram because sufficient information is presented. We believe that our notation system could be a convenient tool to enable researchers to share information involved in molecular interactions. Fig. 3 is essentially a state transition diagram, often used in engineering and software development. This is an example of the process diagram, one of two representation modes, that allows the processes involved in the molecular interactions to be easily recognized. The alternative mode of visualization, the relationship diagram (not shown), is an extension of a Kohn map, where interactions for each molecular species are solidly represented but the temporal order of interactions is only implicit. Representation between
Catalysis
Known Transition Omitted Receptor Unknown Transition
Ion Channel
Inhibition
Transport
Transcriptional Activation Truncated Protein Heterodimer formation
Transcriptional Inhibition Gene RNA Antisense RNA Phenotype
Translational Activation
Translational Inhibition
Dissociation
Degradataion
Ion Simple Molecule
Add Reactant
Truncation
Unknown
Add Product
Compartments:
Fig. 4. Main symbols adopted by CellDesigner version 2.0. These symbols are provided in CellDesigner version 2.0. Size and color of each module are changeable. CellDesigner also provides X-Y coordinates for each module and can distinguish between cellular compartments.
5
August 25, 2004 AfCS Research Reports
the two display modes can be switched. Although these representations are unambiguous, they require software support (such as CellDesigner http://www.systemsbiology.org/) to be drawn. 2.3 Diagram Legend The symbols used to represent molecules and interactions are shown in Fig. 4 and Fig. 5.. Each roundcornered box represents a specific state of a molecular species. The closed arrows (arrow head filled) represent changes in the state of modification (or allostericity) rather than indicating activation (as in Fig. 2). The schema avoids using symbols that directly point to the molecule to indicate activation and inhibition. Instead, the diagram directly indicates a transition from an inactive to an active state for activation and a transition from an active state to an inactive state for inhibition. When these transitions are promoted or inhibited by other mediating molecules, such as active kinases, these reactions are represented by circle-headed lines for activation and bar-headed lines for inhibition. An open arrow (arrow head not filled) indicates the translocation of a molecule. 3. CellDesigner CellDesigner is a structured diagram editor for drawing gene-regulatory and biochemical networks (8). Networks are drawn based on the process diagram, the graphical notation system described above, and are stored using the Systems Biology Markup Language (SBML), a standard for representing models of biochemical and generegulatory networks (9). Networks are able to link with simulation and other analysis packages through Systems Biology Workbench (SBW) (10). CellDesigner can be downloaded from http://www.systems-biology.org/ or corresponding links from the AfCS/Nature Signaling Gateway. The aim of CellDesigner is to supply a process diagram editor with standardized technology for every computing platform so that it benefits as many users as possible. By using standardized technology, the model can be easily used with other applications, thereby reducing the need for users to create a specific model for each editing,
Vol. 2 No. 14 DA www.signaling-gateway.org/reports/v2/DA0014/DA0014.htm
simulation, or analysis task. The main standardized features that CellDesigner supports are in “graphical0notation,” “model description,” and “application integration environment.” The standard for graphical notation shown in Fig. 4 and Fig. 5 plays an important role for efficient and accurate dissemination of knowledge (7), and the standard for model description will enhance the portability of models between software tools. Similarly, the standard for application integration environment will help software developers provide the ability for their applications to communicate with other tools. Even if the proposed notation system satisfies the requirements of biologists, lack of software support will drastically decrease its advantages. CellDesigner supports a process diagram, and extension to include the other form of diagram, a block diagram, is now experimentally implemented. CellDesigner provides a user-friendly interface to organize information of biological networks (Fig. 6). CellDesigner enables models of biological networks for further analyses. There are two aspects that are essential: (1) a machine-readable standard model representation and (2) a seamless link with analysis software. CellDesigner is an SBML-compliant application, which means that it supports SBML reading and writing capabilities. SBML is the standard model definition language in the systems biology field; it is now used by the BASIS Project (http://www.basis.ncl.ac.uk/technology.html), the DARPA BioSPICE project (http://www.biospice.org), and the International E. coli Alliance. CellDesigner can read all SBML Level-1 documents, so users can use existing SBML models such as the KEGG database. We have already converted more than 12,000 metabolic pathways of KEGG to SBML (available from http://www.systems-biology.org/). Other SBML models are available from the SBML model repository (http://sbml.org/models/). The compliance of CellDesigner to SBML enables researchers to store models and use them for analyses by other SBML-compliant applications. CellDesigner is also an SBW-enabled application. With SBW installed, CellDesigner can integrate with all SBW-enabled modules (Fig. 7). For example, users can browse or modify a model converted from an existing database with CellDesigner and launch a simulator from CellDesigner (by selecting “Simulation Service” from the
Fig. 5. Expressions of the inner structures and the states. The active state of the molecule is indicated by a dashed line surrounding the molecule. Although the example in Fig. 3 only describes phosphorylation as the possible alternative state, other state changes such as acetylation, ubiquitination, and allosteric changes can be represented with specific information such as target residue and position.
6
August 25, 2004 AfCS Research Reports
Vol. 2 No. 14 DA www.signaling-gateway.org/reports/v2/DA0014/DA0014.htm
comments. We also thank members of Sony Computer Science Laboratories, Inc. and the ERATO Kitano Symbiotic Systems Project for valuable discussions. This research is, in part, supported by the Exploratory Research for Advanced Technology (ERATO) and the Solution-Oriented Research for Science and Technology (SORST) programs (Japan Science and Technology Organization), the NEDO Grant (New Energy and Industrial Technology Development Organization)/Japanese Ministry of Economy, Trade and Industry (METI), the Special Coordination Funds for Promoting Science and Technology and the Center of Excellence Program for Keio University (Ministry of Education, Culture, Sports, Science, and Technology), the Rice Genome and Simulation Project (Ministry of Agriculture), and the Air Force Office of Scientific Research (AFOSR). Fig. 6. Screenshot of CellDesigner.
SBW menu) to run simulations in real time. There are many other SBW-enabled modules, such as ODE-based simulator, stochastic simulator, Matlab translator, bifurcation analysis tool, and optimization module. These SBW-enabled modules are freely available from http://www.sbw-sbml.org/. Using these capabilities, CellDesigner enables researchers to carry out a range of analyses on biological networks, including parameter optimization based on experimental data and dynamic simulations. CellDesigner functions as an information organizer. For each molecule and interaction, notes and links can be added to store legacy data relevant to that molecule and interaction, as well as being linked to genome and proteome databases. While the current release of the macrophage map does not include stored legacy information for each molecule and interaction, future versions may include such information. In addition, links to AfCS Molecule Pages can be added to a note, which enables CellDesigner to function as an efficient interface to AfCS resources. There are limitations in the current version of CellDesigner 2.0. First, representation of complexes and receptor substructures are too simplified. Second, transcription and translation processes are too simplified. However, these shortcomings, as well as other issues not mentioned, will be improved in future versions of the software. One of the major issues for future development of CellDesigner is possible implementation of community-ware that enables correction, updates, and insertion of additional information, so that community-based refinement can be accomplished. Such software is not only consistent with the philosophy behind the AfCS but also may explore novel and practical approaches to creating and maintaining large-scale network models of biological systems.
References 1. 2. 3. 4.
Kitano H. (2002) Nature 420(6912), 206-210. Kohn KW. (2001) Chaos 11(1), 84-97. Kohn KW. (1999) Mol. Biol. Cell 10(8), 2703-2734. Maimon R and Browning S. In: Tau-Mu Y, Hucka M, Morohashi M, Kitano H, eds. Proceedings of the Second International Conference on Systems Biology. Madison, Wis: Omnipress; 2001:311-317. 5. Pirson I, Fortemaison N, Jacobs C, Dremier S, Dumont JE, and Maenhaut C. (2000) Trends Cell Biol. 10(10), 404-408. 6. Cook DL, Farley JF, and Tapscott SJ. (2001) Genome Biol. 2(4), RESEARCH0012. 7. Kitano H. (2003) BioSilico 1(5), 169-176. 8. Funahashi A, Morohashi M, Tanimura N, and Kitano H. (2003) BioSilico 1(5), 160-162. 9. Hucka M, Finney A, Sauro HM, et al. (2003) Bioinformatics 19(4), 524-531. 10. Hucka M, et al. In: Kitano H, ed. Foundations of Systems Biology. Cambridge, Mass: The MIT Press; 2001:125143.
9LVXDO�'HVLJQ�7RRO
6LPXODWLRQ�&RQWURO�,QWHUIDFH
6LPXODWLRQ�(QJLQH
Acknowledgments The authors wish to thank members of the AfCS for insightful discussions and informative and constructive
6%: %URNHU
Fig. 7. Illustration of the relationship between SBW Broker and SBW modules.
7
August 25, 2004 AfCS Research Reports
References for the Molecular Interaction Map of a Macrophage Cytokine Signaling 11. Aaronson DS and Horvath CM. (2002) Science 296(5573), 1653-1655. 12. Alexander WS and Hilton DJ. (2004) Annu. Rev. Immunol. 22, 503-529. 13. Wormald S and Hilton DJ. (2004) J. Biol. Chem. 279(2), 821-824. 14. Kubo M, Hanada T, and Yoshimura A. (2003) Nat. Immunol. 4(12), 1169-1176. Tumor necrosis factor-á (TNF-á) 15. MacEwan DJ. (2002) Cell. Signal. 14(6), 477-492. 16. Qi C and Pekala PH. (2000) Proc. Soc. Exp. Biol. Med. 223(2), 128-135. 17. Song HY, Rothe M, and Goeddel DV. (1996) Proc. Natl. Acad. Sci. U.S.A. 93(13), 6721-6725. 18. Idel S, Dansky HM, and Breslow JL. (2003) Proc. Natl. Acad. Sci. U.S.A. 100(24), 14235-14240. 19. Meldrum DR. (1998) Am. J. Physiol. 274(3 Pt 2), R577595. 20. Yuasa T, Ohno S, Kehrl JH, and Kyriakis JM. (1998) J. Biol. Chem. 273(35), 22681-22692. 21. Cuenda A and Dorow DS. (1998) Biochem. J. 333(Pt 1), 11-15. 22. Matsuzawa A, Nishtoh H, Tobiume K, Takeda K, and Ichijo H. (2002) Antioxid. Redox. Signal. 4(3), 415-425. 23. Kishimoto H, Nakagawa K, Watanabe T, et al. (2003) J. Biol. Chem. 278(19), 16595-16601. 24. Aguirre V, Werner ED, Giraud J, Lee YH, Shoelson SE, and White MF. (2002) J. Biol. Chem. 277(2), 1531-1537. 25. Ichijo H, Nishida E, Irie K, et al. (1997) Science 275(5296), 90-94. Interleukin-1 (IL-1), Lipopolysaccharide (LPS) 26. Nagai Y, Akashi S, Nagafuku M, et al. (2002) Nat. Immunol. 3(7), 667-672. 27. Takeda K, Kaisho T, and Akira S. (2003) Annu. Rev. Immunol. 21, 335-376. 28. Suzuki N, Suzuki S, Duncan GS, et al. (2002) Nature 416(6882), 750-756. 29. Akira S, Takeda K, and Kaisho T. (2001) Nat. Immunol. 2(8), 675-680. 30. Yamamoto M, Sato S, Hemmi H, et al. (2003) Nat. Immunol. 4(11), 1144-1150. 31. Dunne A and O’Neill LA. (2003) Sci. STKE 2003(171), re3. 32. Kobayashi K, Hernandez LD, Galan JE, Janeway CA Jr, Medzhitov R, and Flavell RA. (2002) Cell 110(2), 191-202. 33. Kinjyo I, Hanada T, Inagaki-Ohara K, et al. (2002) Immunity 17(5), 583-591. 34. Nakagawa R, Naka T, Tsutsui H, et al. (2002) Immunity 17(5), 677-687. 35. Burns K, Clatworthy J, Martin L, et al. (2000) Nat. Cell Biol. 2(6), 346-351. 36. Fitzgerald KA, McWhirter SM, Faia KL, et al. (2003) Nat. Immunol. 4(5), 491-496. 37. Mori M, Yoneyama M, Ito T, Takahashi K, Ingaki F, and Fujita T. (2004) J. Biol. Chem. 279(11), 9698-9702. 38. Jiang Z, Ninomiya-Tsuji J, Qian Y, Matsumoto K, and Li
Vol. 2 No. 14 DA www.signaling-gateway.org/reports/v2/DA0014/DA0014.htm
39. 40.
X. (2002) Mol. Cell Biol. 22(20), 7158-7167. Yamin TT and Miller DK. (1997) J. Biol. Chem. 272(34), 21540-21547. Wang CDeng L, Hong M, Akkaraju GR, Inoue J, and Chen ZJ. (2001) Nature 412(6844), 346-351.
Interleukin-10 (IL-10) , Interleukin-6 (IL-6) 41. Cassatella MA, Gasperini S, Bovolenta C. et al. (1999) Blood 94(8), 2880-2889. 42. Niemand C, Nimmesgern A, Haan S, et al. (2003) J. Immunol. 170(6), 3263-3272. 43. Lang R, Patel D, Morris JJ, Rutschman RL, and Murray PJ. (2002) J. Immunol. 169(5), 2253-2263. 44. Moore KW, de Waal Malefyt R, Coffman RL, and O’Garra A. (2001) Annu. Rev. Immunol. 19, 683-765. 45. Bode JG, Schweigart J, Kehrmann J, et al. (2003) J. Immunol. 171(1), 257-266. 46. Heinrich PC, Behrmann I, Muller-Newen G, Schaper F, and Graeve L. (1998) Biochem. J. 334(Pt 2), 297-314. 47. Heinrich PC, Behrmann I, Haan S, Hermanns HM, Muller-Newen G, and Schaper F. (2003) Biochem. J. 374(Pt 1), 1-20. 48. Massa PT, Saha S, Wu C, and Jarosinski KW. (2000) Glia 29(4), 376-385. 49. Crepaldi L, Silveri L, Calzetti F, Pinardi C, and Cassatella MA. (2002) Int. Immunol. 14(10), 11451153. 50. Taga T and Kishimoto T. (1997) Annu. Rev. Immunol. 15, 797-819. 51. Tilg H, Trehu E, Atkins MB, Dinarello CA, and Mier JW. (1994) Blood 83(1), 113-118. 52. You M, Flick LM, Yu D, and Feng GS. (2001) J. Exp. Med. 193(1), 101-110. 53. Mori N and Prager D. (1997) Eur. J. Haematol. 59(3), 162-170. 54. Beetz A, Peter RU, Oppel T, et al. (2000) Int. J. Radiat. Biol. 76(11), 1443-1453. Interferon-ã (IFN-ã) 55. Bach EA, Aguet M, and Schreiber RD. (1997) Annu. Rev. Immunol. 15, 563-591. 56. Gil MP, Bohn E, O’Guin AK, et al. (2001) Proc. Natl. Acad. Sci. U.S.A. 98(12), 6680-6685. 57. Contursi C, Wang IM, Gabriele L, et al. (2000) Proc. Natl. Acad. Sci. U.S.A. 97(1), 91-96. 58. Venema RC, Venema VJ, Eaton DC, and Marrero MB. (1998) J. Biol. Chem. 273(46), 30795-30800. 59. Terui K, Haga S, Enosawa S, Ohnuma N, and Ozaki M. (2004) Biochem. J. 380(Pt 1), 203-209. 60. Lee J, Shin JS, Park JY, et al. (2003) J. Neurosci. Res. 74(6), 884-890. 61. Kovarik P, Stoiber D, Eyers PA, et al. (1999) Proc. Natl. Acad. Sci. U.S.A. 96(24), 13956-13961. 62. Abe J and Berk BC. (1999) J. Biol. Chem. 274(30), 21003-21010. 63. De Lucca FL, Sales VS, Souza LR, Murad JM, and Watanabe MA. (2003) Mol. Cell Biochem. 247(1-2), 211-217. Interleukin-4 (IL-4) 64. Ohmori Y and Hamilton TA. (1998) J. Biol. Chem. 273(44), 29202-29209. 65. Nelms K, Keegan AD, Zamorano J, Ryan JJ, and Paul
8
August 25, 2004 AfCS Research Reports
66. 67. 68.
69. 70. 71.
72. 73.
WE. (1999) Annu. Rev. Immunol. 17, 701-738. Gessner A and Rollinghoff M. (2000) Immunobiology 201(3-4), 285-307. Jiang H, Harris MB, and Rothman P. (2000) J. Allergy Clin. Immunol. 105(6 Pt 1), 1063-1070. Andrews RP, Ericksen MB, Cunningham CM, Daines MO, and Hershey GK. (2002) J. Biol. Chem. 277(39), 36563-36569. Nelson G, Wilde GJ, Spiller DG, et al. (2003) J. Cell Sci. 116(Pt 12), 2495-2503. Gordon S. (2003) Nat. Rev. Immunol. 3(1), 23-35. Brightling CE, Symon FA, Birring SS, Bradding P, Pavord ID, and Wardlaw AJ. (2002) J. Allergy Clin. Immunol. 110(6), 899-905. Giallourakis C, Kashiwada M, Pan PY, et al. (2000) J. Biol. Chem. 275(38), 29275-29282. Hartman ME, O’Connor JC, Godbout JP, Minor KD, Mazzocco VR, and Freund GG. (2004) J. Biol. Chem. 279(27), 28045-28050.
Macrophage colony-stimulating factor (M-CSF) 74. Rohrschneider LR, Bourette RP, Lioubin MN, Algate PA, Myles GM, and Carlberg K. (1997) Mol. Reprod. Dev. 46(1), 96-103. 75. Liu Y, Jenkins B, Shin JL, and Rohrschneider LR. (2001) Mol. Cell Biol. 21(9), 3047-3056. 76. Feng X, Takeshita S, Namba N, Wei S, Teitelbaum SL, and Ross FP. (2002) Endocrinology 143(12), 48684874. 77. Kanagasundaram V, Jaworowski A, and Hamilton JA. (1996) Biochem. J. 320(Pt 1), 69-77. 78. Dey A, She H, Kim L, et al. (2000) Mol. Biol. Cell 11(11), 3835-3848. 79. Raab M, Cai YC, Bunnell SC, Heyeck SD, Berg LD, and Rudd CE. (1995) Proc. Natl. Acad. Sci. U.S.A. 92(19), 8891-8895. 80. Imai Y and Kohsaka S. (2002) Glia 40(2), 164-174. 81. Yeung YG and Stanley ER. (2003) Mol. Cell Proteomics 2(11), 1143-1155. 82. White MF. (2002) Am. J. Physiol. Endocrinol. Metab. 283(3), E413-422. 83. Saltiel AR and Kahn CR. (2001) Nature 414(6865), 799806. 84. Fucini RV, Okada S, and Pessin JE. (1999) J. Biol. Chem. 274(26), 18651-18658. 85. Bourette RP, Myles GM, Choi JL, and Rohrschneider LR. (1997) EMBO J. 16(19), 5880-5893. 86. Kim MJ, Kim E, Ryu SH, and Suh PG. (2000) Exp. Mol. Med. 32(3), 101-109. 87. Xu S, Khoo S, Dang A, et al. (1997) Mol. Endocrinol. 11(11), 1618-1625. 88. Balsinde J, Winstead MV, and Dennis EA. (2002) FEBS Lett. 531(1), 2-6. 89. Matsubayashi Y, Fukuda M, and Nishida E. (2001) J. Biol. Chem. 276(45), 41755-41760. 90. Shapiro PS and Ahn NG. (1998) J. Biol. Chem. 273(3), 1788-1793. 91. Zhou B, Wang ZX, Zhao Y, Brautigan DL, and Zhang ZY. (2002) J. Biol. Chem. 277(35), 31818-31825. 92. Poteet-Smith CE, Smith JA, Lannigan DA, Freed TA, and Sturgill TW. (1999) J. Biol. Chem. 274(32), 2213522138. 93. Douville E and Downward J. (1997) Oncogene 15(4),
Vol. 2 No. 14 DA www.signaling-gateway.org/reports/v2/DA0014/DA0014.htm
94.
95.
373-383. Jensen CJ, Buch MB, Krag TO, Hemmings BA, Gammeltoft S, and Frodin M. (1999) J. Biol. Chem. 274(38), 27168-27176. Hamilton M, Liao J, Cathcart MK, and Wolfman A. (2001) J. Biol. Chem. 276(31), 29079-29090.
Granulocyte-macrophage colony-stimulating factor (GMCSF) 96. Geijsen N, Koenderman L, and Coffer PJ. (2001) Cytokine Growth Factor Rev. 12(1), 19-25. 97. Hamilton JA. (2002) Trends Immunol. 23(8), 403-408. 98. Stoiber D, Stockinger S, Steinlein P, Kovarik J, and Decker T. (2001) J. Immunol. 166(1), 466-472. 99. Okuda K, Foster R, and Griffin JD. (1999) Ann. N.Y. Acad. Sci. 872, 305-312; discussion 312-313. Interferon-á (IFN-á) , Interferon-â (IFN-â) 100. Bogdan C. (2000) Curr. Opin. Immunol. 12(4), 419-424. 101. David M. (2002) Biotechniques Suppl., 58-65. 102. Uddin S, Yenush L, Sun XJ, Sweet ME, White MF, and Platanias LC. (1995) J. Biol. Chem. 270(27), 1593815941. 103. Taniguchi T, Ogasawara K, Takaoka A, and Tanaka N. (2001) Annu. Rev. Immunol. 19, 623-655. 104. Levy DE and Darnell JE Jr. (2002) Nat. Rev. Mol. Cell Biol. 3(9), 651-662. 105. Stark GR, Kerr IM, Williams BR, Silverman RH, and Schreiber RD. (1998) Annu. Rev. Biochem. 67, 227264. Transforming growth factor-â (TGF-â) 106. Letterio JJ and Roberts AB. (1998) Annu. Rev. Immunol. 16, 137-161. 107. Shi Y and Massague J. (2003) Cell 113(6), 685-700. 108. Asano Y, Ihn H, Yamane K, Kubo M, and Tamaki K. (2004) J. Clin. Invest. 113(2), 253-264. 109. Miyazono K, ten Dijke P, and Heldin CH. (2000) Adv. Immunol. 75, 115-157. Antibody Immunoglobulin 2a (IgG2a) 110. Cox D and Greenberg S. (2001) Semin. Immunol. 13(6), 339-345. 111. Hogarth PM. (2002) Curr. Opin. Immunol. 14(6), 798802. 112. Billadeau DD and Leibson PJ. (2002) J. Clin. Invest. 109(2), 161-168. 113. Ravetch JV, Luster AD, Weinshank R, et al. (1986) Science 234(4777), 718-725. 114. Couture C, Williams S, Gauthier N, Tailor P, and Mustelin T. (1997) Eur. J. Biochem. 246(2), 447-451. G protein-coupled receptors 115. Johnston CA and Watts VJ. (2003) Life Sci. 73(23), 2913-2925. 116. Dzimiri N. (2002) Eur. J. Biochem. 269(19), 4713-4730.
117. Bakker RA, Casarosa P, Timmerman H, Smit MJ, 118.
9
and Leurs R. (2004) J. Biol. Chem. 279(7), 5152-5161. Tucek S, Michal P, and Vlachova V. (2002) Trends Pharmacol. Sci. 23(4), 171-176.
August 25, 2004 AfCS Research Reports
119. 120. 121. 122. 123. 124.
Marchese A, Chen C, Kim YM, and Benovic JL. (2003) Trends Biochem. Sci. 28(7), 369-376. Wojcikiewicz RJ. (2004) Trends Pharmacol. Sci. 25(1), 35-41. Willets JM, Challiss RA, and Nahorski SR. (2003) Trends Pharmacol. Sci. 24(12), 626-633. Johnson EN and Druey KM. (2002) J. Allergy Clin. Immunol. 109(4), 592-602. Sadja R, Alagem N, and Reuveny E. (2002) Proc. Natl. Acad. Sci. U.S.A. 99(16), 10783-10788. Luttrell LM, Della Rocca GJ, van Biesen T, Luttrell DK, and Lefkowitz RJ. (1997) J. Biol. Chem. 272(7), 46374644.
Regulator of G protein signaling (RGS) 125. Benzing T, Yaffe MB, Arnould T, et al. (2000) J. Biol. Chem. 275(36), 28167-28172. 126. Sierra DA, Gilbert DJ, Householder D, et al. (2002) Genomics 79(2), 177-185. 127. Hausmann ON, Hu WH, Keren-Raifman T, et al. (2002) Eur. J. Neurosci. 15(4), 602-612. 128. Ishii M and Kurachi Y. (2003) Life Sci. 74(2-3), 163-171. 129. Zhong H and Neubig RR. (2001) J. Pharmacol. Exp. Ther. 297(3), 837-845. Ca2+ signaling 130. Werry TD, Wilkinson GF, and Willars GB. (2003) Biochem. J. 374(Pt 2), 281-296. 131. Okamoto H and Takasawa S. (2002) Diabetes 51 Suppl 3, S462-473. 132. Fraser ID, Tavalin SJ, Lester LB, et al. (1998) EMBO J. 17(8), 2261-2272. 133. Campbell PN and Smith AD. Biochemistry Illustrated. 4th ed. Edinburgh: Churchill Livingstone; 2000.134. Scheid MP and Woodgett JR. (2003) FEBS Lett. 546(1), 108-112. 135. Salh B, Wagey R, Marotta A, Tao JS, and Pelech S. (1998) J. Immunol. 161(12), 6947-6954. 136. Launay S, Gianni M, Kovacs T, et al. (1999) Blood 93(12), 4395-4405. 137. Frank KF, Bolck B, Brixius K, Kranias EG, and Schwinger RH. (2002) Basic Res. Cardiol. 97 Suppl 1, I72-78. 138. Toyofuku T, Curotto Kurzydlowski K, Narayanan N, and MacLennan DH. (1994) J. Biol. Chem. 269(42), 26492-26496. 139. DeSouza N, Reiken S, Ondrias K, Yang YM, Matkovich S, and Marks AR. (2002) J. Biol. Chem. 277(42), 39397-39400. 140. Exton JH. (2002) FEBS Lett. 531(1), 58-61. 141. Jang MJ, Lee MJ, Park HY, et al. (2004) Exp. Mol. Med. 36(2), 172-178. 142. Cockcroft S. (2001) Cell. Mol. Life Sci. 58(11), 16741687. Prostaglandin E2 (PGE2) 143. Hubbard NE, Lee S, Lim D, and Erickson KL. (2001) Prostaglandins Leukot. Essent. Fatty Acids 65(5-6), 287-294. 144. Nataraj C, Thomas DW, Tilley SL, et al. (2001) J. Clin. Invest. 108(8), 1229-1235. 145. Breyer MD and Breyer RM. (2001) Annu. Rev. Physiol. 63, 579-605.
Vol. 2 No. 14 DA www.signaling-gateway.org/reports/v2/DA0014/DA0014.htm
146.
Fujino H, West KA, and Regan JW. (2002) J. Biol. Chem. 277(4), 2614-2619.
Adenosine 5'-triphosphate (ATP), Uridine 5'-triphosphate (UTP), Uridine 5'-diphosphate (UDP) 147. Chen BC, Lee CM, and Lin WW. (1996) Br. J. Pharmacol. 119(8), 1628-1634. 148. Guerra AN, Fisette PL, Pfeiffer ZA, et al. (2003) J. Endotoxin Res. 9(4), 256-263. 149. Murthy KS and Makhlouf GM. (1998) J. Biol. Chem. 273(8), 4695-4704. 150. Nicholas RA, Watt WC, Lazarowski ER, Li Q, and Harden K. (1996) Mol. Pharmacol. 50(2), 224-229. 151. Chen BC and Lin WW. (2000) Br. J. Pharmacol. 130(4), 777-786. Lysophosphatidic acid (LPA) 152. Tigyi G and Parrill AL. (2003) Prog. Lipid Res. 42(6), 498-526. 153. Hornuss C, Hammermann R, Fuhrmann M, Juergens UR, and Racke K. (2001) Eur. J. Pharmacol. 429(1-3), 303308. 154. Le Page SL, Bi Y, and Williams JA. (2003) Am. J. Physiol. Cell Physiol. 285(5), C1197-1206. 155. An S, Bleu T, Hallmark OG, and Goetzl EJ. (1998) J. Biol. Chem. 273(14), 7906-7910. 156. Graler MH and Goetzl EJ. (2002) Biochim. Biophys. Acta 1582(1-3), 168-174. Sphingosine-1-phosphate (S1P) 157. Meyer zu Heringdorf D, Himmel HM, and Jakobs KH. (2002) Biochim. Biophys. Acta 1582(1-3), 178-189. 158. Ignatov A, Lintzel J, Kreienkamp HJ, and Schaller HC. (2003) Biochem. Biophys. Res. Commun. 311(2), 329336. 159. Siehler S and Manning DR. (2002) Biochim. Biophys. Acta 1582(1-3), 94-99. 160. Watterson KR, Johnston E, Chalmers C, et al. (2002) J. Biol. Chem. 277(8), 5767-5777. 161. Sorensen SD, Nicole O, Peavy RD, et al. (2003) Mol. Pharmacol. 64(5), 1199-1209. Platelet-activating factor (PAF) 162. Prescott SM, Zimmerman GA, Stafforini DM, and McIntyre TM. (2000) Annu. Rev. Biochem. 69, 419445. 163. Ishii S and Shimizu T. (2000) Prog. Lipid Res. 39(1), 4182. 164. Honda Z, Ishii S, and Shimizu T. (2002) J. Biochem. (Tokyo) 131(6), 773-779. 165. Bazan H and Ottino P. (2002) Prog. Retin. Eye Res. 21(5), 449-464. Macrophage inflammatory protein-1á (MIP-1á) 166. Menten P, Wuyts A, and Van Damme J. (2002) Cytokine Growth Factor Rev. 13(6), 455-481. 167. Blanpain C, Libert F, Vassart G, and Parmentier M. (2002) Receptors Channels 8(1), 19-31. Complement component 5a (C5a) 168. Vanek M, Hawkins LD, and Gusovsky F. (1994) Mol. Pharmacol. 46(5), 832-839. 169. Fukuoka Y, Nielsen LP, and Hugli TE. (1989)
10
August 25, 2004 AfCS Research Reports
Vol. 2 No. 14 DA www.signaling-gateway.org/reports/v2/DA0014/DA0014.htm
Dermatologica 179 Suppl 1, 35-40. 194. Metabolism 195. Glucose and Lipid 170. Salway JG. Metabolism at a Glance. 3rd ed. Oxford: Blackwell Science; 2004.
196. 197.
Arachidonic acid 171. Banfi C, Colli S, Eligini S, Mussoni L, and Tremoli E. (2002) Prostaglandins Leukot. Essent. Fatty Acids 67(2-3), 169-173. Reactive oxygen species 172. Forman HJ and Torres M. (2001) IUBMB Life 51(6), 365-371. 173. Walker G, Pfeilschifter J, and Kunz D. (1997) J. Biol. Chem. 272(26), 16679-16687. 174. Lefkowitz DL, Mills K, Morgan D, and Lefkowitz SS. (1992) Proc. Soc. Exp. Biol. Med. 199(2), 204-210. 175. Lyons CR, Orloff GJ, and Cunningham JM. (1992) J. Biol. Chem. 267(9), 6370-6374. Phagocytosis 176. Crisby M, Nilsson J, Kostulas V, Bjorkhem I, and Diczfalusy U. (1997) Biochim. Biophys. Acta 1344(3), 278-285. 177. Babiker A, Andersson O, Lund E, et al. (1997) J. Biol. Chem. 272(42), 26253-26261. 178. Nicholson AC, Han J, Febbraio M, Silverstarin RL, and Hajjar DP. (2001) Ann. N.Y. Acad. Sci. 947, 224-228. 179. Nagy L, Tontonoz P, Alvarez JG, Chen H, and Evans RM. (1998) Cell 93(2), 229-240. 180. Huang A, Li C, Kao RL, and Stone WL. (1999) Free Radic. Biol. Med. 26(5-6), 526-537. 181. Weber C, Erl W, and Weber PC. (1995) Biochem. Biophys. Res. Commun. 206(2), 621-628. 182. Miyazaki A, Sakashita N, Lee O, et al. (1998) Arterioscler. Thromb. Vasc. Biol. 18(10), 1568-1574. 183. Escary JL, Choy HA, Reue K, and Schotz MC. (1998) Arterioscler. Thromb. Vasc. Biol. 18(6), 991-998. 184. Baranova I, Vishnyakova T, Bocharov A, et al. (2002) Infect. Immun. 70(6), 2995-3003. 185. Hara H and Yokoyama S. (1992) Biochemistry 31(7), 2040-2046. 186. Tall AR, Costet P, and Wang N. (2002) J. Clin. Invest. 110(7), 899-904. Transcription Nuclear factor-êB (NF-êB) 187. Ghosh S and Karin M. (2002) Cell 109 Suppl, S81-96. 188. Ling L, Cao Z, and Goeddel DV. (1998) Proc. Natl. Acad. Sci. U.S.A. 95(7), 3792-3797. 189. Wang D, Westerheide SD, Hanson JL, and Baldwin AS Jr. (2000) J. Biol. Chem. 275(42), 32592-32597. 190. Kurland JF, Voehringer DW, and Meyn RE. (2003) J. Biol. Chem. 278(34), 32465-32470. 191. Saccani S, Pantano S, and Natoli G. (2003) Mol. Cell 11(6), 1563-1574. 192. Mendes AF, Carvalho AP, Caramona MM, and Lopes MC. (2001) Mediators Inflamm. 10(4), 209-215. 193. Chao CC, Lokensgard JR, Sheng WS, Hu S, and Peterson
198. 199.
PK. (1997) Neuroreport 8(14), 3163-3166. Wang P, Wu P, Siegel MI, Egan RW, and Billah MM. (1995) J. Biol. Chem. 270(16), 9558-9563. Bitar R, Beauparlant P, Lin R, Pitha P, and Hiscott J. (1995) Cell Growth Differ. 6(8), 965-976. D’Acquisto F, May MJ, and Ghosh S. (2002) Mol. Intervent. 2(1), 22-35. May MJ and Ghosh S. (1997) Semin. Cancer Biol. 8(2), 63-73. McKay LI and Cidlowski JA. (1999) Endocr. Rev. 20(4), 435-459. Tay A, Maxwell P, Li Z, Goldberg H, and Skorecki K. (1994) Biochim. Biophys. Acta 1217(3), 345-347.
Interferon regulatory factor (IRF) 200. Takaoka A, Hayakawa S, Yanai H, et al. (2003) Nature. 424(6948), 516-523. 201. Yoneyama M, Suhara W, Fukuhara Y, Fukuda M, Nishida E, and Fujita T. (1998) EMBO J. 17(4), 1087-1095. 202. Marie I, Durbin JE, and Levy DE. (1998) EMBO J. 17(22), 6660-6669. 203. Samardzic T, Jankovic V, Stosic-Grujicic S, and Trajkovic V. (2001) Cytokine 13(3), 179-182. 204. Yim JH, Ro SH, Lowney JK, Wu SJ, Connett J, and Doherty GM. (2003) J. Interferon Cytokine Res. 23(9), 501-511. 205. Xie R, van Wijnen AJ, van Der Meijden C, Luong MX, Stein JL, and Stein GS. (2001) J. Biol. Chem. 276(21), 18624-18632. 206. Liu T, Castro S, Brasier AR, Jamaluddin M, Garofalo RP, and Casola A. (2004) J. Biol. Chem. 279(4), 24612469. Liver X receptor á/Retinoid X receptor (LXRá/RXR) 207. Laffitte BA, Chao LC, Li J, et al. (2003) Proc. Natl. Acad. Sci. U.S.A. 100(9), 5419-5424. 208. Laffitte BA, Joseph SB, Walczak R, et al. (2001) Mol. Cell Biol. 21(22), 7558-7568. 209. Oberkofler H, Schraml E, Krempler F, and Patsch W. (2003) Biochem. J. 371(Pt 1), 89-96. 210. Hu X, Li S, Wu J, Xia C, and Lala DS. (2003) Mol. Endocrinol. 17(6), 1019-1026. 211. Huuskonen J, Fielding PE, and Fielding CJ. (2004) Arterioscler. Thromb. Vasc. Biol. 24(4), 703-708. Peroxisome proliferative activated receptor á/Retinoid X receptor (PPARá/RXR) 212. Picard F and Auwerx J. (2002) Annu. Rev. Nutr. 22, 167197. 213. Chawla A, Boisvert WA, Lee CH, et al. (2001) Mol. Cell 7(1), 161-171. 214. Berger J and Moller DE. (2002) Annu. Rev. Med. 53, 409-435. 215. Suzawa M, Takada I, Yanagisawa J, et al. (2003) Nat.
Cell Biol. 5(3), 224-230. 216. Heery DM, Kalkhoven E, Hoare S, and Parker MG. 217. 218. 219.
11
(1997) Nature 387(6634), 733-736. Puigserver P, Wu Z, Park CW, Graves R, Wright M, and Spiegelman BM. (1998) Cell 92(6), 829-839. Qi C, Chang J, Zhu Y, Yeldandi AV, Rao SM, and Zhu YJ. (2002) J. Biol. Chem. 277(32), 28624-28630. Rosen ED and Spiegelman BM. (2001) J. Biol. Chem.
August 25, 2004 AfCS Research Reports
220.
276(41), 37731-37734. Zamir I, Zhang J, and Lazar MA. (1997) Genes Dev. 11(7), 835-846.
Sterol regulatory element binding factor 1c (SREBP1c) 221. Brown MS and Goldstein JL. (1997) Cell 89(3), 331340. 222. Brown MS and Goldstein JL. (1999) Proc. Natl. Acad. Sci. U.S.A. 96(20), 11041-11048. 223. Brown MS, Ye J, Rawson RB, and Goldstein JL. (2000) Cell 100(4), 391-398. 224. Yang T, Espenshade PJ, Wright ME, et al. (2002) Cell 110(4), 489-500. 225. Espenshade PJ, Li WP, and Yabe D. (2002) Proc. Natl. Acad. Sci. U.S.A. 99(18), 11694-11699. 226. Bennett MK, Lopez JM, Sanchez HB, and Osborne TF. (1995) J. Biol. Chem. 270(43), 25578-25583. 227. Andreolas C, da Silva Xavier G, Diraison F, et al. (2002) Diabetes 51(8), 2536-2545. Similar to mothers against decapentaplegic (Smad) 228. Attisano L and Tuen Lee-Hoeflich S. (2001) Genome Biol. 2(8), REVIEWS3010. 229. Miyazono K, Suzuki H, and Imamura T. (2003) Cancer Sci. 94(3), 230-234. 230. Feng XH, Lin X, and Derynck R. (2000) EMBO J. 19(19), 5178-5193. 231. Pardali K, Kurisaki A, Moren A, ten Dijke P, Kardassis D, and Moustakes A. (2000) J. Biol. Chem. 275(38), 29244-29256.
Vol. 2 No. 14 DA www.signaling-gateway.org/reports/v2/DA0014/DA0014.htm
232.
Chen CR, Kang Y, Siegel PM, and Massague J. (2002) Cell 110(1), 19-32.
v-Myc myelocytomatosis viral oncogene homolog (c-myc) 233. Ferrer I, Blanco R, Carmona M, and Puig B. (2001) Neuropathol. Appl. Neurobiol. 27(5), 343-351. 234. Pulverer BJ, Fisher C, Vousden K, Littlewood T, Evan G, and Woodgett JR. (1994) Oncogene 9(1), 59-70. 235. Wu S, Cetinkaya C, Munoz-Alonso MJ, et al. (2003) Oncogene 22(3), 351-360. 236. Staller P, Peukert K, Kiermaier A, et al. (2001) Nat. Cell Biol. 3(4), 392-399. Activating protein-1 (AP-1) 237. Smith ER, Smedberg JL, Rula ME, Hamilton TC, and Xu XX. (2001) J. Biol. Chem. 276(34), 32094-32100. 238. Li QJ, Yang SH, Maeda Y, Sladek FM, Sharrocks AD, and Martins-Green M. (2003) EMBO J. 22(2), 281291. 239. Meyer-ter-Vehn T, Covacci A, Kist M, and Pahl HL. (2000) J. Biol. Chem. 275(21), 16064-16072. 240. Castellazzi M and Sergeant A. (1993) Bull. Cancer. 80(9), 757-759. 241. Dunn C, Wiltshire C, MacLaren A, and Gillespie DA. (2002) Cell. Signal. 14(7), 585-593. 242. Derijard B, Hibi M, Wu IH, et al. (1994) Cell 76(6), 1025-1037. 243. Coronella-Wood J, Terrand J, Sun H, and Chen QM. (2004) J. Biol. Chem. [Epub ahead of print]. 244. Schreiber M, Kolbus A, Piu F, et al. (1999) Genes Dev. 13(5), 607-619.
Authors* Kanae Oda† Tomomi Kimura† Yukiko Matsuoka Akira Funahashi Masaaki Muramatsu Hiroaki Kitano‡ Editors
Reviewers
Ashley Brossoie
Henry Bourne University of California San Francisco, San Francisco, CA
Duke University, Durham, NC
Gilberto R. Sambrano|| University of California San Francisco, San Francisco, CA * † ‡ §
Adam Arkin University of California Berkeley, Berkeley, CA
Please refer to the AfCS policy on authorship. KO and TK equally contributed to this paper. To whom scientific correspondence should be addressed. To whom questions or comments about the AfCS Research Reports should be addressed.
This work was published in the AfCS Research Reports as a special contribution to the AfCS effort by Dr. Hiroaki Kitano and colleagues.
12