growth patterns and developmental events, such as leaf primordia formation, plastid development, shade avoidance, and flowering induction (Sage 1992). Per-.
Molecular Mapping, Chromosomal Assignment, and Genetic Diversity Analysis of Phytochrome Loci in Barley (Hordeum vulgare) R. M. Biyashev, R. A. Ragab, P. J. Maughan, and M.A. Saghai Maroof
From the Department of Crop and Soil Environmental Sciences, Virginia Polytechnic Institute and State University, Blacksburg, VA 24601. This research was supported In part by grants from the North American Barley Genome Mapping Project, VS. Department of Agriculture NRI (93-3730f>8840), and the Rockefeller Foundation. R. A. Ragab Is a recipient of a postdoctoral fellowship from the Rockefeller Foundation. Journal of Heredity 1997:88:21-26; 0022-1503/97/15.00
Light is a critical environmental factor influencing plant growth and development. Light provides the radiant energy necessary for photosynthesis and is the primary stimulus for many changes in plant growth patterns and developmental events, such as leaf primordia formation, plastid development, shade avoidance, and flowering induction (Sage 1992). Perception and interpretation of light stimuli are modulated by several endogenous photoreceptors, including phytochromes (red and far-red light receptors), blue light receptors, ultraviolet-A receptor(s), and ultraviolet-B receptor(s). Of the different photoreceptor systems, the phytochromes are the best characterized (Furuya 1993; Quail et al. 1995). Phytochromes are cytosolically localized dimers composed of two polypeptides, each containing a covalently attached tetrapyrrole chromophore. The photosensory capacity of the molecule is derived from its ability to exist in two known forms that are reversibly interconvertible by red and far-red light: the redabsorbing (Pr) form, and the far-red absorbing (Pfr) form. Photointerconvertibil-
ity of the two forms functions as a switch that regulates gene expression (Quail 1991). The exact molecular nature by which phytochromes regulate signal pathways and gene expression is not known. However, photoregulation by phytochromes has been implicated in the expression of a number of nuclear genes, Including the small subunit of rlbulosebisphosphate carboxylase and chlorophyll a/b binding protein (Silverthorne and Tobin 1984), protochlorophyllide reductase (Apel 1981), ribosomal RNA (Thien and Schopfer 1982), and several unidentified mRNAs (Thompson et al. 1983). Multiple phytochrome genes have been identified, sequenced, and compared for several plant species using recombinant DNA technology [reviewed by Quail (1991) and Quail et al. (1995)]. Complete phytochrome ami no acid sequences have been isolated from a variety of plant species, including oat, zucchini, pea, rice, and com. Recently, Clack et al. (1994) and Sharrock and Quail (1989) reported the isolation of five structurally distinct but related phytochrome genes from Ambidopsis, which they designated as PhyA, PhyB, PhyQ
21
Downloaded from jhered.oxfordjournals.org by guest on July 17, 2011
Phytochromes belong to a family of photoreceptors that perceive, interpret, and translate light signals that effect plant growth and development The objectives of this study were to use a heterologous phytochrome cDNA probe from oat to (1) identify phytochrome loci in barley, (2) determine the chromosomal and genomlc location of phytochrome gene(s) in barley, and (3) assess the extent of genetic variation at phytochrome loci In cultivated barley (Hordeum vulgare). Restriction fragment length polymorphism (RFLP) analysis detected four distinct phytochrome loci In barley, arbitrarily designated phyl, phy2, phy3, and phy4. Wheat-barley addition line analysis Indicated that phyl, phy2, and phy3 are located on barley chromosomes 7, 4, and 5, respectively, while phy4 represents duplicate loci located on barley chromosomes 2 and 7. Linkage mapping confirmed our results using wheatbarley addition line analysis and located the phyl and phy3 loci to the short arm of barley chromosome 7 and to the centromeric region of barley chromosome 5, respectively. Two to three alleles were detected at each of the five phytochrome loci examined. Genetic diversity values for the phytochrome loci were near previous estimates for RFLPs. Division of the barley samples based on spike morphology indicated that the level of diversity in two- and six-rowed barley is about equal, although significant differences in allellc frequencies were detected between the subgroups.
PhyD, and PhyE. Analytical investigations of these phytochrome variants suggested that each phytochrome type has a specialized photosensory function, which may explain the diversity of responses attributed to the phytochrome system (Quail et aJ. 1995). Despite significant biochemical, physiological, and molecular research efforts, information on the genomic location and genetic diversity of the phytochrome gene(s) in agronomic crops is limited. To date, the chromosomal location of only the phytochrome PhyA locus has been identified in wheat and rice (Causse et al. 1994; Ogihara et al. 1994). In this article we used a heterologous phytochrome cDNA probe from oat to (1) identify multiple phytochrome loci in barley, (2) determine the chromosomal and genomic location of phytochrome gene(s) in barley using linkage analysis and wheat-barley chromosome addition lines, and (3) assess the extent of genetic variation at phytochrome loci in cultivated barley (Hordeum uulgare).
Genetic Materials Three sets of genetic materials were studied in this experiment. The first set of materials was a barley mapping population consisting of 138 double haploid (DH) lines developed from the a cross between the barley cultivars Steptoe and Morex. The mapping population used in this experiment has a well-developed molecular map consisting of 434 molecular markers, spanning 1430 cM, and is one of the principal mapping populations of the North American Barley Genome Mapping Project (Kleinhofs et al. 1993). The second set included a series of wheat-barley chromosome addition lines (Islam 1983). These materials included a barley cultivar (Betzes), a wheat cultivar (Chinese Spring), and six addition lines representing chromosomes 1, 2, 3, 4, 6, and 7 of barley. Each addition line contains the 21 pairs of wheat chromosomes from Chinese Spring plus one pair of barley chromosomes from the barley cultivar Betzes. The wheat-barley addition lines were used to confirm the chromosomal location of phytochrome loci and to determine chromosomal locations of phytochrome loci that did not segregate between the parents of the mapping population. The third set of genetic materials was used to determine genetic diversity levels at phytochrome loci; this was composed of a broad sample of 96 ac-
2 2 The Journal of Heretfity 1997.88(1)
Downloaded from jhered.oxfordjournals.org by guest on July 17, 2011
Materials and Methods
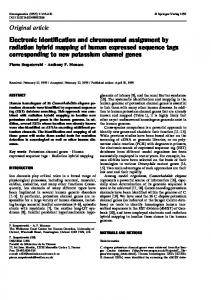
cessions of cultivated barley (H. uulgare) the phytochrome loci were then combined representing all major barley growing ar- with the existing linkage data for the Steptoe X Morex cross (Kleinhofs et al. 1993). eas of the world. Linkage analysis was performed using the computer program MapMaker 3.0b (LandRFLP Analysis er et al. 1987) at LOD = 4.0, with a maxiDNA isolation and RFLP procedures were mum Haldane distance of 50 cM. as described by Saghai Maroof et al. Diversity values (h) for each phytochro(1984) and Zhang et al. (1993). An initial me locus were calculated using the genie screening of a subset of barley lines was used to determine which restriction en- diversity index, h = 1 - Zp,2, where p, is zyme detected the highest level of poly- the frequency of the fth allele. Since the morphism. Briefly, 8 (j.g of barley DNA was total sample of barley accessions can be digested with each of six restriction en- divided between two groups based on zymes (Mndlll, £coRV, Xba\, Dral, Sst\, and spike morphology (two- or six-rowed), the £coRI) and electrophoresed on 0.8% aga- diversity values for the total sample were further partitioned into their respective rose gels, followed by standard Southern components as described by Nel (1973), transfer to nylon membranes. Blots were hybridized overnight with a randomly HT = Hw + GJT, where HT is the total diprimed ^-dCTP-labeled phytochrome probe versity, //w is the within-group diversity (see following section). Following hybrid- component, and G^ is the between-group differentiation. ization, blots were washed three times, twice for 5 min at room temperature with IX SSC and 0.1% SDS and once for 15 min at 65°C with 0.5 x SSC and 0.1% SDS. After Results washing, blots were covered with plastic Chromosomal Assignment of wrap and exposed to X-ray film for 7-10 Phytochrome Loci in Barley Using days. The restriction enzyme Xbal detect- Wheat-Barley Addition Lines ed the highest level of variation among the RFLP analysis using the phytochrome barley lines, and was therefore used to probe detected four distinct DNA fragevaluate the level of genetic diversity ments (Figure 1). Initial mapping of the among all 96 barley accessions at the phy- these four fragments by wheat-barley adtochrome loci. dition lines analysis unambiguously assigned each of these DNA fragments to separate barley chromosomes, indicating Phytochrome Clone that each of these DNA fragments repreThe oat cDNA phytochrome clone utilized in this experiment was kindly donated by sents a distinct barley phytochrome locus. Hence, we will refer to each fragment as a S. Kay (University of Virginia) and has specific phytochrome locus and label been fully described by Hershey et al. (1984). The phytochrome probe was pre- them phyl, phy2, phy3, and phy4, where pared by digesting the cDNA clone with phyl represents the largest restriction the restriction enzymes Kpnl and SsA, fragment detected and phy4 represents which yielded a 3.0 kbp fragment repre- the smallest restriction fragment detected. Figure 1 shows the RFLP banding pattern senting the phytochrome coding region. produced in the wheat-barley addition line This fragment was purified from agarose analysis when probed with the phytochrogel slices and labeled with ^P-dCTP by a random primer protocol (Feinberg and Vo- me probe. The barley parent of the addigelstein 1983). Since multiple phytochro- tion lines (Betzes, lane 8) shows four distinct DNA fragments (phyl, phy2, phy3, me loci were detected with this probe, each phytochrome locus was arbitrarily and phyf), and is completely different designated with an arabic numeral corre- from the banding pattern observed in the sponding to the decreasing size of the re- wheat parent (Chinese Spring, lane 1). striction fragment containing each phyto- Analysis of the wheat-barley addition lines (lanes 2-7) show that the phyl and phy2 chrome locus (e.g., phyl > phy2 > phy3 > loci are located on barley chromosome 7 phy4; see also Figure 1). (lane 7) and 4 (lane 5), respectively. Two bands corresponding to the phy4 fragment Data Analysis were detected on barley chromosomes 2 Segregation ratios for each polymorphic (lane 3) and 7 (lane 7), suggesting that the phytochrome locus in the double haploid phy4 gene is represented as a duplicate lobarley population were tested for goodcus in the barley genome. None of the six ness-of-fit to an expected 1:1 genotypic rawheat-barley addition lines showed a cortio using the computer program linkage-1 responding band for the phy3 locus. Since (Suiter et al. 1983). Segregation data for
3
4
5
6
somes 2 and 7 of barley (Figure 1, Table
7 8
Figure 1. The RFLP banding pattern for wheat (lane 1; Chinese Spring), barley (lane 8; Betzes), and wheat-barley addition lines 1, 2, 3, 4, 6, and 7 (lanes 2-7) used to map phytochrome loci to barley chromosomes using wheatbarley addition line analysis. The letters a, b, c, and d Indicate the positions of the lour phytochrome loci, phyl. phy2, phy3, and phy4, respectively.
the wheat-barley addition line that carries barley chromosome 5 is sterile and is not represented in the analysis, we infer that the phy3 locus is located on barley chromosome 5. In summary, the wheat-barley
addition lines analysis indicates that phytochrome loci phyl, phy2, and phy3 are located on chromosomes 7,4, and 5, respectively, while phy4 represents a duplicate locus presumably located on chromo-
Linkage analysis located the phytochrome locus phyl to the short arm of barley chromosome 7 at 21.6 cM from marker ABG316B and 10.1 cM from ABG705 (Figure 2). Phytochrome locus phy3 mapped near the centromeric region on the long arm of barley chromosome 5, 9.2 cM from marker ABC 160 and 11.3 cM from ABG464 (Figure 2). The genetic mapping of phyl and phy3 to barley chromosomes 7 and 5, respectively, confirmed the inferences obtained from wheat-barley addition lines. The map location of these two phytochrome loci are of particular interest because both loci are positioned in relatively large gaps within the barley molecular map (Figure 2). For example, previous to the
Table 1. Sample size, number of alleles, diversity values, and differentiation component for each locus In the total sample and In each subgroup of calUvated barley Spike morphology
Locus
Phyl Phy2 phy3 phy4
Chromosome location*
Total sample
Two-rowed group
Six-rowed group
No. of alleles
No. of alleles
No. of alleles
7 4
3 2
32.7
3 2
Diversity 0.573 0.366 0.549 0.323
67 83
2 2
S3
3
89
2
Diversity 0.308 0.497 0560 0500
21 26 27 24
3
2 3 2
Diversity 0.628 0.188 0523 0.123
46 57 56 61
45 8.0 1.4 82
• Chromosomal locations were determined by wheat-barley addition line analysis and/or linkage analysis. * Differentiation component between the two- and six-rowed barley groups. ' Only those samples that could be scored unambiguously were used in the diversity analysis.
Biyashev et al • Phytoctvome Loci in Barley 2 3
Downloaded from jhered.oxfordjournals.org by guest on July 17, 2011
Linkage Analysis of Phytochrome Loci The linkage relationships for two of the four phytochrome loci were determined using segregation data for 434 molecular marker loci from a double haploid mapping population. The parents of the mapping population (Steptoe and Morex) differed in phytochrome alleles for only two (phyl and phyJ) of the four phytochrome loci (Figure 2). Chi-square tests revealed that the segregation of the phy3 locus fit the expected 1:1 segregation ratio, while the phyl locus deviated significantly from the expected 1:1 ratio (chi-square values were 8.83 and 0.26 for phyl and phy3, respectively). Interestingly, Causse et al. (1994) reported significant distortion of several molecular marker loci mapping near a phytochrome (PhyA) locus on rice chromosome 3 and suggested that the segregation distortion observed in this genomic region in rice may be associated with the presence of a closely linked genetic factor(s) regulating fertility. Whether a similar genetic phenomenon is affecting the segregation of this phytochrome locus in barley is not known.
1
2
3
4
5
6
7
8
9
10 11
• • * » • • .
c
m
t»
d
positioning of phyl, the molecular map of barley contained a 31.7 cM gap on chromosome 7. After the addition of phytochrome locus phyl the size of this gap has been reduced to 21.6 cM. Genetic Diversity Ninety-six accessions of cultivated barley were assayed for genetic diversity at each phytochrome locus. Polymorphism was detected at all four phytochrome loci. Three distinct allelic variants were detected for phytochrome loci phyl and phy3, while two variants were detected for phytochromes phy2 and phy4 among all the barley accessions examined. The predominant allele for phyl, phy2, phy3, and phy4 had frequencies of 0.55, 0.57, 0.60, and 0.64, respectively. A total of 10 alleles were observed in the entire sample of 96 barley accessions for all four phytochrome loci. Phytochrome locus phyl exhibited the highest level of genie diversity (0.57) followed by the phy3 locus (0.55), while phy2 and phy4 showed the lowest diversity values (0.37 and 0.32, respectively, Table 1). The 96 accessions of cultivated barley can be partitioned into two groups on the basis of the possession of two- or sixrowed spikes. The number of alleles and diversity values calculated for each barley group are presented in Table 1. Although the number of alleles and the diversity values appeared to be different at many of
2 4 The Journal of Heredity 1997:88(1)
the phytochrome loci between the groups, the overall difference was not significant and is largely the result of different sample sizes between the groups. However, partitioning of the barley accessions showed that the frequency of the alleles at specific phytochrome loci differed dramatically between the two subgroups. For example, the most frequent allele (number 2) detected at the phy2 locus (P = .54) in the two-rowed group was rarely observed (P = .11) In the six-rowed barley group. The Gsr statistic, which measures the amount of differentiation between groups, had an average value of 5.53%, ranging from 1.4% at the phy3 locus to 8.2% at the phy2 locus (Table 1).
Discussion We used a heterologous phytochrome cDNA probe from oat to detect five barley phytochrome loci, arbitrarily designated as phyl, phy2, phy3, and phy4 (duplicate locus). The identification of five phytochrome loci suggests that phytochrome is represented as a small multigene family in barley. This is consistent with previous studies by Hershey et al. (1985) who reported the existence of a small family of at least four phytochrome genes in oat (Aoena satiod) and by Clack et al. (1994) and Sharrock and Quail (1989) who reported the existence of a small phytochro-
In addition to identifying the chromo-
Downloaded from jhered.oxfordjournals.org by guest on July 17, 2011
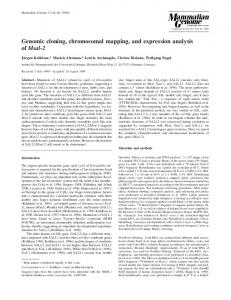
Figure 2. Segregation patterns for two phytochrome loci phyl and phy3 (labeled a and c, respectively) In 11 DH lines. Phytochrome loci phy2 (labeled b) and phyt (labeled d) are not polymorphic In this cross
me gene family in Arabidopsis that consists of at least five structurally related phytochrome genes (PhyA, PhyB, PhyC, PhyD, and PhyE). Quail et al. (1995) suggested that the large diversity of responses attributed to the phytochrome system is the result of photosensory specialization of individual phytochrome variants. Indeed, photomorphogenic mutant analysis indicates that phytochromes PhyA and PhyB have contrasting and specific photosensory functions in controlling hypocotyl elongation in etiolated Arabidopsis seedlings (Dehesh et al. 1993; McCormac et al. 1993). While the identification of five distinct phytochrome loci in barley supports the conclusion that phytochrome genes are encoded as small multigene families in higher plants, the photosensory specialization of these particular loci in barley is not known. Equally unclear is the relationship among the barley phytochrome loci and the phytochrome loci identified in Arabidopsis (which has become the model system for the study of photoreceptors in higher plants) and other plant species. Interestingly, however, since several specific homologous chromosomes are conserved among barley, wheat, and rice (Kurata et al. 1994; Saghai Maroof et al. 1996), and since previous genetic mapping has localized a phytochrome locus {PhyA) to wheat chromosome 4 (Ogihara et al. 1994) and two phytochrome loci (Phya and Phyb) to rice chromosome 3 (Causse et al. 1994; Lin et al. 1995), one might infer that the barley phytochrome phy2 locus on barley chromosome 4 represents a homolog of one of these phytochrome loci, based solely on chromosomal homologies among these grass species (barley chromosome 4, wheat chromosome 4, and rice chromosome 3 are homologous chromosomes). An equally intriguing observation is the similarity In the chromosomal location of the phytochrome phy3 locus and a major photoperiod response gene {Ppd3) in barley (Blake T, personal communication). The phytochrome phy3 locus maps to a genomic region of chromosome 5 flanked by the same RFLP markers as the photoperiod response gene Ppd3 (Blake T, personal commincatlon). A more detailed mapping study will be necessary to determine the exact genetic relationship between this phytochrome locus (phyS) and the photoperiod response gene Ppd3 and to determine the relationships among the phytochrome loci identified in this study and those reported in other plant species.
• -
- -
MWG502
ABR313
" " MWG920-1 - -
ABG316B
ABC164 £uF2A ABC152B RisBPP16 Pcr2 - - ABR337 CDO105B Dor2
10 CM - - ABC160
Phy3 Phyl
ABG464
- - -
His3B ABC307A
- -
CMWG706A
- \-
ABC257 iPgd2
ABG705 References
CD0669B ABG708 Adh6 ABG497 ABG395 CD0749 Rrn2 Ubi2 B12DB Ltpl
- - WG541 WG530 ABA001
Chromosome 7
- - CMWG733
Causse MA, Fulton TM, Cho YG, Ann SN, Chunwongse J, Wu K, Xiao J, Yu Z, Ronald PC, Harrington SE, Second G, McCouch SR, and Tanksley SD, 1994 Saturated molecular map of the rice genome based on an Interspecific backcross population. Genetics 138.1251-1274.
- " AtpbA • - ABG702
Clack T, Mathews S, and Sharrock RA, 1994. The phytochrome apoproteln family In Arabidopsis Is encoded by five genes: the sequences and expression of PHYD and PHYE Plant Mol Blol 25:413-427.
-
Dehesh K, Francl C, Parks BM, Seeley KA, Short TW, Tepperman JM, and Quail PH, 1993. Arabidopsis HY8 locus encodes phytochrome A. Plant Cell 5:1081-1088.
\-
ABC322B ABC261 MWG635C Cab2 Aga7 ABG373 ABG055 - |- ABG387A
Chromosome 5
Figure 3. Genomlc location of phytochrome loci phyl and phy3 on chromosomes 7 and 5 of barley, respectively. Only a portion of the chromosomes containing the phytochrome loci are shown. Scale Is shown at the left In centiMorgans. The approximate location of centromere regions are Indicated by the C.
somal and genomic location of phytochrome loci in barley, we surveyed the level of genetic variation at each phytochrome locus in a sample of 96 accessions of cultivated barley. Genetic variation was detected at all four (five) phytochrome loci surveyed. The diversity values calculated
Apel K, 1981. The protochlorophyllldae holochromeof barley: phytochrome-lnduced Increase of translatable mRNA coding for the NADPH protochlorophyllldae oxidoreductase. Eur J Blochem 120:89-93.
for the phytochrome loci fell within the range of previous estimates for isozymes and random RFLPs within cultivated barley, that is, between 0.10 and 0.74 (Saghai Maroof et al. 1995). The partitioning of the 96 barley lines into two- and six-rowed barley groups in-
Felnberg AP and Vogelsteln B, 1983. A technique for radlolabelling DNA restriction endonuclease fragments to high specific activity. Anal Blochem 132:6-13. Furuya M, 1993. Phytochromes: their molecular species, gene families, and functions. Annu Rev Plant Physlol Plant Mol Blol 44:617-645. Hershey HP, Barker RF, Idler KB, Ussemore JL, and Quail PH, 1985. Analysis of cloned cDNA and genomic sequences for phytochrome: complete amlno add sequences for two gene products expressed In etiolated Aoena. Nucleic Adds Res 13*543-8559 Hershey HP, Gilbert JT, Ussemore JL, and Barker RF, 1984. Molecular donlng of cDNA for Aoena phytochrome. Proc Nat! Acad Sd USA 81:2332-2336. Islam AKMR, 1983. DUelosomlc additions of barley chromosomes to wheat. In: Proceedings of the 6th International Wheat Genetics Symposium, Kyoto (Sakamoto S, ed). Kyoto: Kyoto University Press; 233-238. Klelnhofs A, KUIan A, Saghai Maroof MA, Btyashev RM, Hayes PM, Chen R, Lapltan N, Fenwlck A, Blake TK, Kanazin V, Ananlev E, Oahleen L, Kudrna D, Skadsen R, and Steffenson BJ, 1993. A molecular, Isozyme and morphological map of the barley {Hordeum aulgare) genome. Theor Appl Genet 86:705-712.
Biyashev et al • PtTytoctirome Loci in Barley 2 5
Downloaded from jhered.oxfordjournals.org by guest on July 17, 2011
- -
- -
dicated that the level of polymorphism between the two groups is not significantly different. This finding was not unexpected because these barley groups are interfertile and have no mechanism to separate them into different gene pools. It is interesting to note, however, that the phytochrome locus (phyf) that exhibits the greatest differentiation (G^ = 8.2%) between the two- and six-rowed barley groups is located on one of the chromosomes (chromosome 2) where genes influencing the number of rows in the spike have been identified (Shin et al. 1990). In this investigation we have identified five phytochrome loci that represent a small multigene family in barley. These loci have been described by their chromosomal and genomic locations and genetic diversity levels. The identification and description of phytochrome loci are important steps in the understanding of the photosensory circuitry of higher plants and in the eventual manipulation of the photosynthetic system at the molecular level.
Kurata N, Moore G, Nagamura Y, Foote T, Yano M, Mlnobe Y, and Gale M, 1994. Conservation of genome structure between rice and wheat. Bio/Technology 12: 276-278. Lander ES, Green P, Abrahamson J, Barlow A, Daly JM, Lincoln SE, and Newberg L, 1987. Mapmaker an Interactive computer package for constructing primary genetic linkage maps of experimental and natural populations. Genomlcs 1:174-181. Un YR, Schertz KF, and Paterson AH, 1995. Comparative analysis of QTLs affecting plant height and maturity across the poaceae, In reference to an Interspecific sorghum population. Genetics 141:391-411. McCormac AC, Wagner D, Boyian MT, Quail PH, Smith H, and Whltelam GC, 1993. Photoresponses of transgenlc Arabidopsis seedlings expressing Introduced phytochrome B-encodlng cDNAs: evidence that phytochrome A and phytochrome B have distinct photoregulatory functions. Plant J 4:19-27. Nel M, 1973. Analysis of gene diversity In subdivided populations. Proc Natl Acad Scl USA 7(h3321-3323. Oglhara Y, Shlmlzu H, Hasegawa K, Tsujlmoto H, and Sasakuma T, 1994. Chromosome assignment of four photosynthesis-related genes and their variability In wheat species. Theor Appl Genet 88:383-394. Quail PH, 1991. Phytochrome: a light-activated molec-
Shin JS, Chao S, Corpuz L, and Blake T, 1990. A partial map of the barley genome Incorporating restriction fragment length polymorphism, polymerase chain reQuail PH, Boyian MT, Parks BM, Short TW, Xu Y, Wagner action, Isozyme, and morphological marker loci. GeD, 1995. Phytochromes: photosensory perception and nome 33:803-810. signal transductlon. Science 268:675-680. SUverthome J and Tobln EM, 1984. Demonstration of Sage LC, 1992. Pigment of the Imagination: a history of transcrlptlonal regulation of specific genes by phytophytochrome research. San Diego, California: Academchrome action. Proc Natl Acad Scl USA 811112-1116. ic Press. Suiter KA, Wendel JF, and Case JS, 1983. Unkage-1: a Saghal Maroof MA, Sollman KM, Jorgensen RA, and AlPASCAL computer program for the detection and anallard RW, 1984. Rlbosomal DNA spacer-length polymorysis of genetic linkage. J Hered 74:203-204. phisms In barley: Mendellan Inheritance, chromosomal Thlen W and Schopfer P, 1982. Control by phytochrome location and population dynamics. Proc Natl Acad Scl of cytoplasmlc precursor rRNA synthesis In the cotyUSA 81:8014-8018. ledon of mustard seedlings. Plant Physlol 69:1156-1160. Saghal Maroof MA, Yang GP, Bryashev RM, and MaughThompson WF, Everett M, Polans NO, Jorgensen RA, an PJ, 1996. Analysis of the barley and rice genomes and Palmer JD, 1983. Phytochrome control of rRNA levby comparative RFLP linkage mapping. Theor Appl els In developing pea and mung-bean leaves. Planta Genet 92541-551. 158:487-500. Saghal Maroof MA, Zhang Q, and Blyashev RM, 1995. Zhang Q, Saghal Maroof MA, and Klelnhofs A, 1993. Comparison of restriction fragment length polymorComparative diversity analysis of RFLPs and lsozymes phisms In wild and cultivated barley. Genome 38:298within and among populations of Hordeum vulgare ssp. 306. spontaneum. Genetics 134:909-916. Sharrock RA and Quail PH, 1989. Novel phytochrome Received January 20, 1996 sequences In Arabidopsis lhaliana. structure evolution Accepted May 24, 1996 and differential expression of a plant regulatory phoCorresponding Editor Jonathan F. Wendel toreceptor family. Genes Dev 3:1745-1757. ular switch that regulates plant gene expression. Annu Rev Genet 25:389-409.
Downloaded from jhered.oxfordjournals.org by guest on July 17, 2011
2 6 The Journal of Heredity 1997:88(1)