is that the sources do not have to be identical to dictionary atoms ... Independent component analysis (ICA) [2, 3, 4] attempts ... mance by a symphony orchestra.
MONAURAL SEPARATION AND CLASSIFICATION OF MIXED SIGNALS: A SUPPORT-VECTOR REGRESSION PERSPECTIVE Sepp Hochreiter and Michael C. Mozer Department of Computer Science University of Colorado Boulder, CO 80309 hochreit,mozer�@cs.colorado.edu ABSTRACT We address the problem of extracting multiple independent sources from a single mixture signal. Standard independentcomponent analysis approaches fail when the number of sources is greater than the number of mixtures. For this case, the sparse-decomposition method [1] has been proposed. The method relies on a dictionary of atomic signals and recovers the degree to which various dictionary atoms are present in the mixture. We show that the sparse-decomposition method is equivalent to a form of support-vector regression (SVR). The training inputs for the SVR are the dictionary atoms, and the corresponding targets are the dot product of the mixture and atom vectors. The SVR perspective provides a new interpretation of the sparse-decomposition method’s hyperparameter, and allows us to generalize and improve the method. The most important insight is that the sources do not have to be identical to dictionary atoms, but rather we can accommodate a many-to-one mapping of source signals to dictionary atoms—a classification of sorts—characterized by a known nonlinear transformation with unknown parameters. The limitation of the SVR perspective is that it cannot recover the signal strength of an atom in the mixture; rather, it can only recover whether or not a particular atom was present. In experiments, we show that our model can handle difficult problems involving classification of sources. Our model may be particularly useful for speech signal processing and CDMA-based mobile communication, where in both cases we have knowledge about the invariances in the signal. 1. INTRODUCTION Independent component analysis (ICA) [2, 3, 4] attempts to recover multiple source signals that have been combined into one or more mixture signals. Most ICA algorithms assume that the sources are mutually statistically independent and that mixtures are linear combinations of the sources. Well known ICA methods like “infomax” [5], maximum
likelihood approaches [6], entropy and cumulant based methods [7, 8, 9] have the restriction that the number of source and mixture signals must be equal. In many real world applications, only one mixture is available. For example, with direct sequence code division multiple access (DS-CDMA) mobile communication, signals from multiple users must be extracted from a single mixture time series. Further, many real world sound recordings (e.g., bird songs, music, traffic, or listening devices used in espionage) use only one or two microphones. Standard ICA approaches cannot be used in these cases. In contrast, the human auditory system is able to distinguish multiple sound sources from two mixtures—the ears. It can even extract sources from monaural recordings. In some cases, separation of signals is easy because the signals occur in different frequency bands (e.g., bird songs and an oncoming bus), but many times simple physical distinctions are inadequate to recover the signals. Consider a performance by a symphony orchestra. The conductor is able to isolate individual melody lines, instruments, or even musicians from the ensemble, whereas a naive audience member will not. The difference between the conductor and the audience member is the conductor’s knowledge and familiarity with the sound patterns that constitute the performance. One could even imagine that the conductor has a dictionary of sound atoms—canonical or prototypical musical phrases and timbres—and identification of components comes by isolating the atoms from the mixture. Several ICA approaches have adopted the idea of using a dictionary to extract multiple sources from fewer or even one mixture [1, 10, 11]. The dictionary can be based on primitive functions (e.g., Fourier bases, wavelet packages, or Gabor functions) [1], predefined based on prior knowledge, or can be trained to fit the problem [12, 11]. Zibulevsky and Pearlmutter [1] specify not only a dictionary, but also a prior that enforces sparseness—i.e., an expectation as to how many sources will be present simultaneously. All these approaches are restricted to mixtures consisting of linearly superimposed dictionary atoms; this
restriction is necessary to avoid ambiguity in the problem. In this paper we show that the sparse-decomposition method of Zibulevsky and Pearlmutter can be reinterpreted as -support vector regression ( -SVR) [13], when there is a single mixture and a Laplacian prior. The -SVR analogy provides a novel interpretation of the sparse-decomposition method’s hyperparameter that determines the degree of sparseness. The analogy also allows one to view the sparse-decomposition method as one member of a family of similar algorithms. Most notably, the family includes a variant of the sparse-decomposition method that allows for nonlinear transformations of the sources before they are mixed, and another nonlinear transformation in the process of identifying dictionary atoms in the mixture. Applications of the approach include speech recognition, where the dictionary consists of pretrained or typical speech waveforms [12], and DS-CDMA mobile communication, where the dictionary consists of spreading sequences of the users. One benefit of the nonlinearities incorporated into the approach is that—as we will explain in detail later—they can be used to achieve some degree of invariance to irrelevant characteristics of the speech signal. We demonstrate our approach with experiments using noisy single mixtures and speech tasks. 2. SPARSE-DECOMPOSITION VIEWED AS -SVR In this section, we review the sparse-decomposition method introduced in [1], focusing on the case of a single mixture signal. We will also describe the relation between sparse decomposition and -support vector regression ( -SVR). 2.1. The Sparse-Decomposition Method Denote the mixture signal by � , which—in the case of speech—might correspond to a time series of � discrete time steps. We assume a dictionary matrix, � � �� , whose columns consist of the � atomic signals of length �. We assume a generative process in which the mixture is created by first choosing a set of dictionary atoms and then combining them linearly with noise:
��
� �
��
� � �
�� ��
� ��
(1)
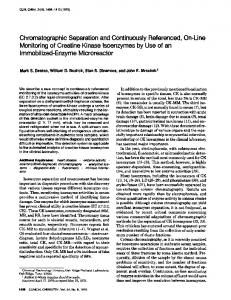
where � �� is a vector of weighting coefficients, one per atom, � � � �� � � is an �-dimensional i.i.d. additive Gaussian noise vector, and � � the �th atom in the dictionary. See Figure 1 for an illustration of the generative process that produces the mixture. The goal of the sparse-decomposition method is to determine the coefficient vector, ��, that satisfies two properties: (1) must be well approximated by ��, and (2) � � is
6 10
0.31
4
2
8 6 4 2
0
0 -2
-2
-4 -4
-6
-6 -8 0
200
400
600
800
1000
1200 -10
0
200
400
600
800
1000
1200
6
4
-0.92
2
0
+
-2
-4
+
-6
-8
0
200
400
600
800
1000
1200
8
6
noise
4
2 10 0 8
0.21
-2
-4
-6
-8
0
200
400
600
800
1000
6 4 2 0
1200
-2 -4 -6
8
-8 6 -10
0
200
400
600
800
1000
1200
4
2
0
-2
-4
-6
-8
0
200
400
600
800
1000
1200
0.69
Fig. 1. The data generation process for the sparsedecomposition method. Atoms from the dictionary � are weighted by a nonnegative factor and added together with noise resulting in the mixture. The goal is to recover the weights from the mixture. sparse, i.e., it has elements of small magnitude. These two properties are achieved by a Bayesian approach in which (1) is the likelihood � � �� �� and (2) is the prior ���. Thus, the approach tries to maximize the posterior
�� �
� �
��
� � �� �� ��� �
where we use “�” because we omit the constant normalization factor in the denominator of Bayes rule. Given the Gaussian noise model, the likelihood is
� � � �� � ���� � � ��� � ��� � � ���� � � � � � ��� � ��� �� �� � ��� �
� � �� �� � ��� � �� � � � ���
To enforce sparseness of the coefficients, a Laplacian prior � � we have: for � is used with � �
�
Consequently, the posterior is
�� �
�
��
�
The maximum a posterior (MAP) solution, ��, is obtained by taking the log of the posterior, flipping its sign, and ignoring irrelevant constant terms and factors, resulting in the minimization problem
��
argmin
� � � � � � ��
�
�
� �� �
� � �
By standard techniques, we can turn this unconstrained optimization problem into a constrained optimization problem in which � is split into two vectors, � � and � . The MAP solution �� �� � �� � is argmin � � s.t.
��� � � � � � ��� � � � � � � � � � �� � � � � �� � � � �
�
� ��� � �� � �
�
(2)
where is the transposition operator, � is the vector of ones, and � is an upper bound that can serve as an additional constraint on the solution (which was not part of the original formulation by Zibulevsky and Pearlmutter). In the solu� ��� � �� , allowing us to split the positive and tion, � negative elements of � into two vectors. We will show that this formulation has the same core mathematics as -support vector regression ( -SVR) [13]. We turn to a brief overview of -SVR. 2.2. -Support Vector Regression -SVR is a supervised approach to regression in which we are given training data ��� � � � � � � ��� � � ��, where �� � and � is a scalar. The goal is to produce a function, �, such that � ��� � closely approximates � . In the linear formulation of -SVR, � �� � � �� �� � � �, where � � , � �, and
� � denotes the dot product. -SVR attempts to obtain a “flat” function by minimizing �� ���� , but subject to the constraint that the fit is good enough, as quantified by the constraint � � � � ��� �� � � �� for all �. is a measure of how accurate the fit needs to be, or intuitively, a measure of the noise in the data. The slack variables � � � allow for the fact that it may not be possible to find an � that satisfies the -accuracy criterion. However, to ensure that the deviations are minimal, the optimization attempts to minimize the magnitude of the slack variables as well; specifically, the constrained optimization is over the objective function � ���� � � �� ��, where � determines the trade off between � the flatness of the function and the tolerance of prediction errors. It turns out that the -SVR has an alternative but entirely equivalent formulation in which each example � is assigned a coefficient, �� , and � is defined with these coefficients: � � � . Consequently, ���� � � � � �� � � � � � � � � � � �. The �� for which � � � are called support vectors. In this formulation, learning involves an optimization problem, to search for the ���� � that minimize
�
� �
�
�
� � � � � � � � ��� � � � � �
�
� � � � � �
�
�
� �� � � � �
subject to �� �� � . To eliminate the absolute-value function from the objective function, a standard technique is used to split the �� into positive and negative components, � � �� and �� , where �� �� � �� , resulting in the optimization problem:
� �� s.t.
��� � � � � � ��� � � � � � � � � � �� � � � � �� � � �� � � ��� � � �� �
� �
�
�
� � � ��
�
(3)
�
where the matrix � is formed with the � � as column vectors. Rather than viewing the constant � as a free parameter of �,
the degree of freedom provided by � is used to ensure the second constraint, �� � � � �� �, is satisfied. If the � is set to zero, the constraint drops out of the above optimization formulation. 2.3. The Relationship Between the Sparse-Decomposition Method and -SVR Consider data for an -SVR consisting of � training examples. For example �, the input � � � is dictionary atom �� , and the target for the example, � , is the dot product between the mixture and dictionary atom � � : �
� � � �. If we fix � � in this situation, optimization problem (2) is identical to optimization problem (3) because the constraint ��� � � �� � is eliminated in in (3). The -SVR formulation gives an interpretation to the hyperparameter in the sparse-decomposition method. It is a measure of the noise level in the data, and indirectly affects the number of ��� that are significantly non-zero. As depicted in Figure 2, each example will have a target, � , that either lies inside or outside the -tube. The closer a target � is to zero, the more nearly orthogonal is the mixture to atom �� , and the less likely atom � is to be present in the mixture. Thus, the -tube distinguishes atoms that are likely to be relevant from those likely to be irrelevant. It turns out that any example � lying outside the -tube will have either ��� � or ��� �� . In the sparse-decomposition formulation, ��� indicates the degree to which a dictionary atom � is present. In -SVR, the parameter � can be nonzero, which extends the sparse-decomposition formalism. To include � in the sparse-decomposition formalism implies that the correlation coefficients � have a nonzero mean. � is an approximation for the mean and is estimated by the -SVR as the � � sign����. Although we expectation over � of � �� � ��� �� do not explore this possibility further in the present paper, we conjecture that inclusion of � in the sparse-decomposition method may be useful if the dictionary atoms share some structure (e.g., if an atom corresponds to a time series which ends the same way for many atoms) and the mixture also contains this structure, resulting in � that are consistently greater than zero. 3. NONLINEAR FORMULATION In the -SVR framework, a nonlinear approximation for � is possible by introducing a kernel function, � �� � � �� �, in the expression for � instead of the dot product � � � �� �. In matrix notation, � � � is replaced by the kernel matrix with ��� � ��� � �� �. The purpose of this kernel is to allow each vector � to be mapped into a new representational space, call it the feature space, via a function �, where the kernel is defined to be the dot product in the feature space: � � � ��
�� �� �����.
Si
x
>
6
c +i = C
y=xT S i x x x x
x x
x x x
x x
x
x
x
x
4
+ε 0 -ε
xx
x
x
0 -1
-2 -3
-6
0
200
400
600
800
1000
0
1200
0
200
400
600
800
1000
1200 -4
6
7
4
6
nonlinear transform
2
0
-2
-4
4
200
400
600
800
1000
400
0
0
200
400
600
800
1000
1200
+
0
200
400
600
800
1000
1200
7
600
800
1000
1200
+
2
1200
8
6
noise
6
nonlinear transform
0
-2
-4
5
4
5 4
3
0.21
2
1
-6
-8
200
3
1
0
0
-0.92
5
-6
-8
4
>
2 1
2
1
2
c i- = C
4 3
3
-4
x
5
0.31
5
nonlinear transform
0
x
x
6
4
2
-2
0
200
400
600
800
1000
0
1200
3
2 1 0 -1
-2 8
7 -3
6
6
4
nonlinear transform
2
0
Fig. 2. The linear –support vector regression corresponding to the sparse-decomposition method. Each “x” in the figure corresponds to a single training example in the -SVR model. The horizontal axis is a one-dimensional depiction of the input space, and the vertical axis is the target output. The grey area, the -tube, specifies the range of target outputs that are not significantly different from zero. The examples � that lie outside the -tube will have ���� � � . In the following sections, we introduce two nonlinear generalizations of the sparse-decomposition method. In both cases, the nonlinearity involves the mapping of the dictionary atoms �� into a feature space. One can conceive of this mapping as part of the generative process that turns a class template into class instances (e.g., a canonical word into a word spoken by a particular speaker at a particular rate).
-2
-4
200
400
600
800
�� �� � � � �� �� � �
�� �
�
�
�
�
�
where the “�”-sign indicates an approximation because and the noise vector � are present. ��� � or ��� �� indicates the presence of dictionary atom � in the mixture (see Figure 3). y