agile software development techniques that are considered important in the software market. In this paper, we .... Monitoring an OOP Course Through Assignments in a DPP System ⢠12:99. 3. ... problem solving, such as Skype and Facebook.
Monitoring an OOP Course Through Assignments in a Distributed Pair Programming System STELIOS XINOGALOS, MAYA SATRATZEMI, DESPINA TSOMPANOUDI AND ALEXANDER CHATZIGEORGIOU, University of Macedonia Distributed Pair Programming (DPP) is widely known to promote collaboration and knowledge sharing among novice programmers, while it engages them in carrying out programming assignments. Moreover, DPP is a means of experiencing agile software development techniques that are considered important in the software market. In this paper, we share some experiences on using the DPP system of SCEPPSys for carrying out assignments in an undergraduate Object Oriented Programming (OOP) course. Specifically, we focus on the information recorded during problem solving and the statistics reported by the system and how this information can be utilized for monitoring both the course regarding the fulfillment of its goals and the programming habits and progress of students. Some proposals are made towards extending the possibilities of SCEPPSys for generating automatically more sophisticated reports that would support instructors in more successfully monitoring a course and students. The ultimate goal of such an enhanced monitoring is to improve students’ software quality. Categories and Subject Descriptors: D.2.3 [Software Engineering]: Coding Tools and Techniques – Object-Oriented Programming; D.2.8 [Software Engineering]: Metrics; K.3.2 [Computers and Education]: Computer and Information Science Education – Computer science education General Terms: Education, Measurement Additional Key Words and Phrases: Distributed Pair Programming, scripted collaboration, monitoring, metrics
1. INTRODUCTION Distributed Pair Programming (DPP) systems allow two programmers to collaborate remotely in order to apply the Pair Programming (PP) [Cockburn and Williams 2000] technique from separate locations. The model of PP originated from the software industry as a part of Extreme Programming (XP) [Williams et al. 2000]. It involves two programmers working on the same workstation and sharing one computer in order to develop software. In the context of pair programming, the team members adopt two specific roles: one programmer acts as the “driver” and the other one as the “navigator” (also called “observer”). The driver has possession of keyboard and mouse and types the programming code, while the navigator reviews the inserted code and gives guidelines to the driver. Driver and navigator are in constant collaboration in order to design and develop the program code in common, while they should frequently alternate roles. PP is based on close collaboration, continuous knowledge transfer, negotiation and sharing of programming skills. Programmers not only receive the advantages of group work, they also produce high quality software in a shorter time [Sanjay and Vanshi 2010, Zacharis 2009]. The only difference between DPP and PP is DPP’s allowing geographically-distributed teams to collaborate and share program code. However, such collaboration is only feasible if an underlying infrastructure enables for all necessary interactions. A considerable number of solutions used to implement DPP were built as plugins for the Eclipse IDE. These plugins support DPP for the Java programming language, within a very popular development environment. A detailed review of all available DPP solutions reveals that most tools lack effective instructional or student support [Tsompanoudi and Satratzemi 2011]. Although they cover the basic requirements of DPP, they cannot address common problems of PP, such as unequal contributions from each member of the student pair.
Authors’ addresses: S. Xinogalos, M. Satratzemi, D. Tsompanoudi, A. Chatzigeorgiou, Department of Applied Informatics, School of Information Sciences, University of Macedonia, Egnatia 156, 54636 Thessaloniki, Greece, email: {stelios, maya, despinats, achat}@uom.gr Copyright © by the paper’s authors. Copying permitted only for private and academic purposes. In: Z. Budimac, Z. Horváth, T. Kozsik (eds.): Proceedings of the SQAMIA 2016: 5th Workshop of Software Quality, Analysis, Monitoring, Improvement, and Applications, Budapest, Hungary, 29.-31.08.2016. Also published online by CEUR Workshop Proceedings (CEUR-WS.org, ISSN 1613-0073)
12
12:98
•
S. Xinogalos, M. Satratzemi, D. Tsompanoudi and A. Chatzigeorgiou
For this purpose SCEPPSys (Scripted Collaboration in an Educational Pair Programming System) was developed using an existing Eclipse plugin for DPP. Compared to other plugins like Sangam [Ho et al. 2004] and XPairtise [Schümmer and Lukosch 2009], SCEPPSys saves and analyzes users’ interactions, and helps educators in organizing and monitoring DPP classes. To the best of our knowledge only RIPPLE [Boyer et al. 2008] provides logging capability of users’ interactions, allowing researchers to reconstruct user sessions for further study. However, the logged information is provided only as raw data and further processing is required in order to extract useful information. In this paper, we share some experiences on using the DPP system of SCEPPSys for carrying out assignments in an undergraduate Object Oriented Programming (OOP) course based on Java. Specifically, we focus on the information recorded during problem solving and the statistics reported by the system and how this information can be utilized for monitoring both the course regarding the fulfillment of its goals and the programming habits and progress of students. Some proposals are made towards extending the possibilities of SCEPPSys for reporting automatically more sophisticated reports that would support instructors in more successfully monitoring a course and students. 2. SCEPPSYS SCEPPSys is based on a typical client-server architecture and consists of: a server for dispatching messages between the clients; a database for storing user’s accounts, information about courses, groups and assignments, shared projects and statistics; a web-based authoring tool used by instructors for scripting DPP [Tsompanoudi and Satrtatzemi 2014]; and an Eclipse plugin installed by students. In the next sections the process that an instructor applies for setting up a course, as well as a typical DPP session carried out by students are briefly described. Interested readers can find further information in a detailed description of SCEPPSys [Tsompanoudi et al. 2015]. 2.1 Setting up a Course The instructor can easily set up a course using the web-based authoring tool of SCEPPSys. First of all the list of learning goals (e.g. constructor definition, object construction, inheritance) that will be used for characterizing the various tasks assigned to students must be defined. Then the assignments can be defined and scheduled in the form of collaboration scripts. A collaboration script involves the definition of: (1) participants - students enrolled to the course; (2) groups or pairs that can be formed randomly, with comparable skill or contribution levels, or freely; (3) assignments that comprise of problem solving tasks or steps characterized by one of the learning goals (not visible to students) and having an accompanying hint that can be optionally consulted by students; (4) task distribution policies - rotating role switching of driver/observer, balanced knowledge switching aiming at achieving symmetry in skill acquisition (learning goals) or free switching. The system monitors the problem solving approach adopted by students and reports various statistics described in the next section. 2.2 Carrying out a Typical DPP Session Students use an Eclipse plugin for applying DPP. A DPP session starts when group members meet online and request a pair programming session. Then a shared project is automatically generated inside the workspace of both students and the programming tasks are displayed in a separate area. Students solve the tasks by adopting the roles of the driver and navigator and switch roles according to the task distribution policy. During the session a text-based chat provides a means of communication and coordination between the team members. To motivate students, metrics like driving time and individual participation rates are displayed in the workspace and students may retrieve useful hints for each step during the problem solving process. Students may submit the assignment on session close or continue the DPP session at another time.
Monitoring an OOP Course Through Assignments in a DPP System
•
12:99
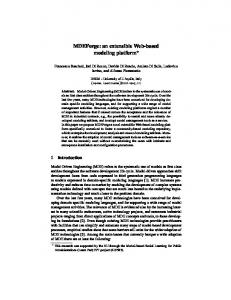
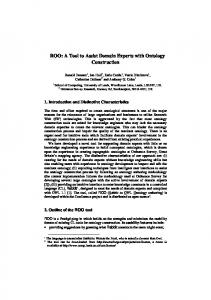
3. STATISTICS REPORTED BY THE SYSTEM SCEPPSys records a variety of information during the problem solving process and calculates statistics for each student per project. The statistics reported are presented in Table I. Moreover, the mean value of the aforementioned elements is calculated along with the number of projects submitted per assignment for each one of the utilized distribution policies (none/free, rotating roles, balanced). Table I. Statistics reported by SCEPPSys. Status (project submitted, not submitted, not found)
Contribution of first student (in %)
Task Distribution policy (roles rotating, balanced knowledge, free)
Contribution of second student (in %)
Total time spent to solve a project (min)
Number of steps solved according to role distribution policy
Driving time spent to solve a project (min)
Driving time of first student
Driving / Total time ratio
Driving time of second student
Number of sync runs
Non driving time of first student
Number of role switches
Non driving time of second student
Number of retrieved hints
Messages sent by first student
Contribution of first student (number of characters)
Messages sent by second student
Contribution of second student (number of characters)
The statistics calculated and reported by SCEPPSys in combination with the projects’ grades can be used as metrics for: monitoring the fulfillment of the courses’ goals in general detecting difficulties with specific OOP concepts/constructs detecting students’ progress in programming detecting undesirable behaviors (e.g. plagiarism) detecting problems in collaboration between the members of a pair In the following sections the indications provided by the most important of the aforementioned statistics are briefly analyzed. 3.1 Total and Driving Time Both the total time for developing a project and the time for actually writing code (driving time) provide indications for the level of difficulty of an assignment, as well as the difficulties of students with the underlying OOP concepts. Moreover, the total and driving time of an assignment help realize students’ workload that must be in accordance with the ECTS of the course. The difference of the total and driving time, or else the driving/total time ratio, helps instructors detect odd or even extreme behaviors. For example, a very small total time or a total time that is approximately equal to the driving time are strong indications of either “copying a solution” or “working offline” (most probably in isolation) and logging in the system just for copying and pasting either the plagiarized or offline solution correspondingly. Both behaviors are problematic and denote non-academic behavior, non-collaborative problem solving or cooperation problems. Instructors can draw safer conclusions if the minimum time necessary to collaboratively solve a specific assignment through the system is recorded. This can be ideally accomplished by having themselves or knowledgeable assistants solve the assignment, or else by estimating the necessary time based on their experience from lab sessions. 3.2 Number of Retrieved Hints Every step of an assignment can have a corresponding hint, providing support to students. Depending on the difficulty of a specific step and whether it deals with a new OOP concept/construct the help provided can be more or less verbose. Moreover, it can contain small pieces of source code. The number of hints retrieved by students is another indication of the degree of difficulty or students’
12:100
•
S. Xinogalos, M. Satratzemi, D. Tsompanoudi and A. Chatzigeorgiou
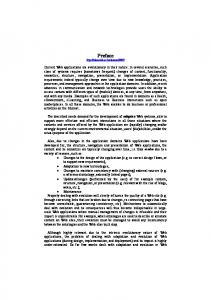
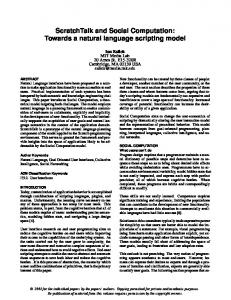
confidence on their solution for an assignment. This means that the more difficult an assignment is, or alternatively the less confident students are for their solution, a bigger number of hints is retrieved. 3.3 Messages Sent During Problem Solving One of the main advantages of DPP is the collaboration and exchange of knowledge between the members of a pair. The communication between the collaborators can be accomplished using the incorporated chat tool. The number of messages sent during code development provides indications for the degree of cooperation and communication between the members of a pair, as well as for the difficulty of an assignment. Of course, students can and do use other means for communication during problem solving, such as Skype and Facebook. 3.4 Number of Synchronized Program Executions The number of synchronized program executions (sync runs) provides information regarding the problem solving strategy adopted from students. Instructors always emphasize the advantages of incremental development and testing, but unfortunately students tend to write large portions of a program before they actually test it. When implementing programs in OOP languages this delayed testing is even more prominent due to the fact that usually an important portion of a class or classes has to be implemented along with the main method in order to test the program. Students tend to complete the definition of a class, or even the classes needed, before they write the main method and test their solution. SCEPSSyS can contribute to changing students’ problem solving strategies through scripted collaboration. Specifically, students can be asked to incrementally implement and test a class by appropriate steps in the collaboration script and moreover they can be asked to check the results until then by running their project. However, it is clear that students can overlook the script’s suggestion and not test their project. So, examining the number of synchronized program executions can help monitor students’ problem solving strategies. Moreover, the number of sync runs in combination with other statistics, such as the total and driving time, number of hints retrieved and messages sent, can indicate potential difficulties in achieving the goals of an assignment. For example, a large number of sync runs combined with an average (or less than average) total and driving time can indicate the application of the desirable incremental development and testing strategy. On the other hand, a large number of sync runs combined with a large amount of total and driving time (above average) can indicate difficulties in achieving the goals of the assignment. 4. CASE STUDY SCEPPSys was used during the academic year 2015-16 in a 3rd semester compulsory course on OOP at the Department of Applied Informatics, University of Macedonia, Greece. Students were taught for 3 hours per week in the lab and had the chance to carry out programming assignments during the 13 weeks of the course. The assignments were optional and their grade was calculated only in the case that students passed the final exams. The previous years the assignments were carried out individually by the participating students as homework. This year students had the chance to select whether they would like to solve the assignments individually, or in pairs using the DPP system of SCEPPSys. Initially 48 pairs of students registered for the DPP assignments, while 47 pairs submitted at least one out of the six projects assigned. At the end of the course a questionnaire was delivered to the participating students in order to obtain their feedback on the DPP assignments. The six projects covered the main learning units of the course and utilized small and manageable steps with corresponding hints. The only exception was the sixth project that included just five steps, one for each one of the necessary classes. In Table II the learning unit covered by each project is presented, along with the mean grade (in the scale of 0 to 10) and the mean values of the metrics briefly analyzed in the previous section.
Monitoring an OOP Course Through Assignments in a DPP System
•
12:101
NUMBER OF PROJECTS
GRADE (in scale 0..10)
TOTAL TIME (MIN)
DRIVING TIME (MIN)
DRIVING / TOTAL TIME RATIO
NUMBER OF SYNC RUNS
NUMBER OF RETRIEVED HINTS
2 (13)
90
45
9.25
190
36
25%
8
9 (69%)
103
#2
Class associations relationship
3 (16)
120
46
8.72
231
55
28%
13
13 (81%)
106
#3
Object collections – ArrayList
3 (23)
160
39
9.15
262
63
30%
25
15 (65%)
153
#4
Inheritance & polymorphism
4 (16)
114
35
9.21
127
40
35%
9
9 (56%)
86
#5
GUI, event handling (+inheritance)
6 (24)
135
28
9.36
243
50
25%
18
16 (67%)
128
#6
Binary files (+inheritance, ArrayList, Comparator)
5 (5)
210
25
8.76
174
34
21%
15
-
100
MESSAGES SENT BY EACH GROUP
LOC (Lines Of Code)
Class definition, main
LEARNING UNIT
#1
PROJECT
NUMBER OF CLASSES (STEPS)
Table II. Statistics for the Projects
Grades Students’ mean grades in all the projects were very good (at least 8.72). Even at the last project the mean grade was 8.76, with the difference that it was submitted by fewer pairs. As already mentioned, the last project was a special case, since it included one step for each class and no hints. Moreover, it included most of the OOP concepts/constructs taught in the course. Number of projects Students tend to give up the effort as the course reaches the end. As can be seen in Table II the number of projects submitted decreases importantly in the last two assignments (approximately the last three weeks of the course). It is quite certain that instructors teaching programming courses, and especially OOP, would agree that such courses are cognitively demanding and the cognitive overload of students leads a certain percentage of them in dropping out of their responsibilities at some point, such as attending lectures and carrying out assignments. Of course, we must remind that in the specific case, assignments were not obligatory. Moreover, we must mention that 41% of the students that participated in the DPP assignments had not passed the first semester “Procedural Programming” course based on C. It is clear that understanding the reasons for dropping out needs a much deeper analysis of the available data in order to draw solid conclusions. Duration Implementing programs is widely known that is a time consuming activity, especially for novices. Based on the data collected by the system, it comes out that students working in pairs spent approximately two to four hours for writing the code for an assignment. However, nearly one fourth to one third of this time was spent on actually writing code. The only exception was the last and most demanding - in terms of the concepts covered, LOC, lack of detailed steps (each step corresponded to a whole class) and hints – project, where just 21% of the total time was spent on writing code. It is reasonable to assume that most of the time was spent on studying the corresponding material, reading hints, communicating with the collaborator and of course thinking about the solution.
12:102
•
S. Xinogalos, M. Satratzemi, D. Tsompanoudi and A. Chatzigeorgiou
Number of sync runs Incremental development and testing, as already mentioned, is an important aspect that should be reinforced among students. However, especially in OOP, this is not always easy. Students tend to implement the classes needed and then write the main method for testing their code. In scripted collaboration the instructor has the chance to reinforce the idea of incremental development and testing by asking students partially implement a class and create objects for testing each method from the very first steps. Moreover, students can be reminded in the textual description of the steps to run their project. Of course, students can just ignore such advice. From the data recorded by the system it turns out that students do run the programs, but it cannot be told in certainty that they do it during problem solving for testing their program, or because they have to make continuous corrections due to raised exceptions and/or logical errors that lead to wrong output. However, at least 8 sync runs were recorded in average for each project, which is an indication of incremental development and testing. If the time of each sync run and its (un)successful completion was recorded we could draw safer conclusions regarding students’ problem solving strategies. Messages sent by each group Although several students use alternative means for communication, and especially Skype and Facebook, the average number of messages sent by the members of the pairs was unexpectedly high. Specifically, 86 to 153 messages were sent in average for each project. This is definitely a strong indication of collaborative work and exchange of perceptions and knowledge. Coverage of syllabus (assignments) An important feature of SCEPPSys that helps the instructor to monitor the coverage of the intended OOP concepts/constructs through the assignments, is reporting the frequency that each learning goal has been addressed in the context of the assignments so far. This feature gives the chance to adjust the assignments and the learning goals they aim at. Ideally, this must be done in combination with the recorded difficulty for each learning goal as the course progresses. Since the projects are graded on-line in a step by step manner and each step is characterized by its main learning goal, the average grade per learning goal can be calculated and used for detecting students’ difficulties and taking the appropriate actions both in lectures and assignments. In the on-line questionnaire that was answered voluntarily by 58 out of the 94 students that participated in the DPP assignments, the majority agreed or completely agreed that the quality of the assignments was good (86.3%) and that the assignments covered in a high degree the content of the course (84.5%). Difficulty of the assignments Based on the assumptions made in the previous section about the various statistics recorded and using the data reported in Table II, some conclusions regarding the difficulty of the assignments can be drawn. Considering the number of projects submitted in combination with the grades of the assignments it is obvious that the last assignment (#6) was the most difficult one. This was anticipated since it combines most of the OOP concepts taught: inheritance, ArrayList, event handling and for the first time concepts from the Collection Framework (Comparator) and binary files. This makes it clear that students should be given more time (usually it is ten days) for this last assignment. Based on the reduced number of projects submitted (28) the next most difficult assignment was the one referring to GUI and event handling (#5), which also utilized inheritance. The number of submitted projects decreased gradually from 45/46 to 39, 35 and finally less than 30 in the last two projects. It seems that this is more or less the time point during the course at which the amount of required knowledge overwhelms a number of students. As a consequence, dropping out appears and instructors should pay special attention in finding ways to support and even more motivate students to keep on the effort. However, the performance of the pairs that submitted the last two projects was still very good.
Monitoring an OOP Course Through Assignments in a DPP System
•
12:103
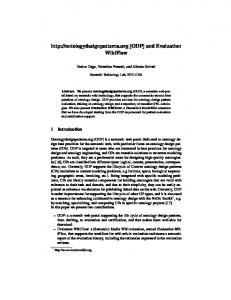
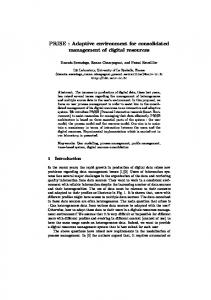
Although students’ performance in the assignment regarding object collections and more specifically the ArrayList collection was very good (average grade 9.15), there are strong indications that it was a demanding assignment (#3) for students, maybe difficult for some of them. Specifically, this assignment demanded more than 4 hours of work in average for each pair, and a big number (153) of messages sent through the incorporated chat tool in order to collaboratively reach a solution. Moreover, 65% of the available hints were retrieved by the students and 25 sync runs of their projects were made. The number of sync runs indicates that various problems came up during problem solving that required correcting and re-running the project. Of course, we must stress that students finally managed to collaboratively reach a good solution, as well as the fact that difficulties with ArrayList collections have been recorded in previous studies (Xinogalos et al. 2008). The conclusions drawn from the statistics calculated by the system are partially confirmed by students’ replies on the questionnaire presented in Table III.
EASY
OF LOW DIFFICULTY
OF MEDIUM DIFFICULTY
DIFFICULT
OF HIGH DIFFICULTY
Class definition, main
6.90%
53.40%
29.30%
6.90%
3.40%
0%
#2
Class associations – relationship
1.70%
36.20%
51.70%
8.60%
1.70%
0%
#3
Object collections – ArrayList
1.70%
17.20%
39.70%
37.90%
3.40%
0%
#4
Inheritance & polymorphism
5.20%
8.60%
20.70%
50%
13.80%
1.70%
#5
GUI, event handling (+inheritance)
15.50%
0%
10.30%
15.50%
43.10%
15.50%
#6
Binary files (+inheritance, ArrayList, Comparator)
17.20%
1.70%
5.20%
12.10%
32.00%
31%
LEARNING UNIT
#1
PROJECT
NOT SUBMITTED
Table III. Students replies regarding the difficulty of the assignments
Out of the 58 students that filled in the questionnaire: The last assignment (#6) that demanded the usage of inheritance, ArrayList collections, event handling, the Collection Framework (Comparator) and binary files was the most difficult for students. Specifically, 63% considered this assignment as difficult (32%) or of high difficulty (31%), while another 17.2% did not submit this assignment. The assignment #5 was the second more difficult assignment. It referred to GUI, event handling and also utilized inheritance. 58.6% of the students considered this assignment to be difficult (43.1%), or even of high difficulty (15.5%). The next more difficult assignment according to students was the one referring to inheritance and polymorphism (#4). Specifically, 50% of the students considered the assignment of medium difficulty and 15.5% as difficult or of high difficulty. The statistics recorded by the system show that this assignment demanded the less time, while the smallest percentage (56%) of hints was retrieved in comparison with the rest of the assignments. Probably, the assignment demanded off-line studying and preparation. Finally, the assignment on object collections and ArrayList (#3) was considered by 37.9% of the students to be of medium difficulty, while the statistics recorded indicated a higher degree of difficulty. Despite the insights provided by students’ replies, we must mention that the questionnaire was filled in after the end of the course. If students were asked to rate the difficulty of each assignment just after finishing it (for example, by entering the specific information as a comment at the end of their project) and not recalling after several weeks their difficulty with assignments, the results of the specific question would be more trustworthy.
12:104
•
S. Xinogalos, M. Satratzemi, D. Tsompanoudi and A. Chatzigeorgiou
5. CONCLUSIONS The benefits of DPP are numerous and have been recorded in the literature. The system of SCEPPSys utilized in this study has the advantage of recording various data and reporting statistics that could be used for monitoring an OOP course based on Java regarding the fulfillment of its goals and taking the appropriate actions in time. Such statistics can be used for detecting difficulties with specific concepts, the quality of collaboration between pairs and potential undesirable behaviors, as well as students’ progress in programming. An important extension of SCEPPSys would be the ability to provide more advanced reports towards this direction that would automate the process of detecting: potential difficulties with specific OOP concepts/constructs: by calculating the average grade achieved by students for each learning goal in the context of each assignment and all the assignments collectively. detecting students’ progress in programming: by calculating and reporting important changes in the grades of his/her projects, as well as the contribution of a student in the projects. detecting undesirable behaviors (e.g. copying a solution, or working offline): by comparing the total and driving time for a project (if there is a small difference between them then probably a solution was just entered in the system and not collaboratively developed), and also with a minimum required time defined by the instructor. It is obvious that in order to achieve this goal and provide really comprehensive reports that will save a great deal of time to instructors and give them even more valuable information both for monitoring the course and each student, the system has to be used in real situations. This study had exactly this goal, to start exploring the indications provided by the reported statistics, validating and using them for automatically creating reports that will be a useful tool in the hands of instructors. A step further would be to examine the possibility of incorporating to the system abilities for calculating simple educational software metrics with the aim of enhancing the quality of students’ programs [Xinogalos and Ivanović 2013]. REFERENCES Kristy Elizabeth Boyer, August A. Dwight, R. Taylor Fondren, Mladen A. Vouk, and James C. Lester. 2008. A development environment for distributed synchronous collaborative programming. In Proceedings of the 13th annual conference on Innovation and technology in computer science education (ITiCSE '08). ACM, New York, NY, USA, 158-162. Alistair Cockburn and Laurie Williams. 2000. The costs and benefits of pair programming. Extreme programming examined. 223-247. Chih-Wei Ho, Somik Raha, Edward Gehringer, and Laurie Williams. 2004. Sangam: a distributed pair programming plug-in for Eclipse. In Proceedings of the 2004 OOPSLA workshop on eclipse technology eXchange (eclipse '04). ACM, New York, NY, USA, 73-77. Goel Sanjay and Kathuria Vanshi. 2010. A Novel Approach for Collaborative Pair Programming. Journal of Information Technology Education, USA, Vol. 9, 183-196. Till Schümmer and Stephan Lukosch. 2009. Understanding Tools and Practices for Distributed Pair Programming. Journal of Universal Computer Science, vol. 15, no. 16, 3101-3125. Despina Tsompanoudi and Maya Satratzemi. 2011. Enhancing Adaptivity and Intelligent Tutoring in Distributed Pair Programming Systems to Support Novice Programmers. In Proceedings of CSEDU'2011, 339-344. Despina Tsompanoudi and Maya Satratzemi. 2014. A Web-based authoring tool for scripting distributed pair programming. In: 14th IEEE International Conference on Advanced Learning Technologies. 259–263. Despina Tsompanoudi, Maya Satratzemi and Stelios Xinogalos. 2015. Distributed Pair Programming using Collaboration Scripts: An Educational System and initial Results. Informatics in Education. Vol. 14, No 2, 291-314. Laurie Williams, Robert R. Kessler, Ward Cunningham, and Ron Jeffries. 2000. Strengthening the Case for Pair Programming. IEEE Softw. 17, 4 (July 2000), 19-25. Stelios Xinogalos and Mirjana Ivanović. 2013. Enhancing Software Quality in Students’ Programs. In Proc. of 2nd workshop on Software Quality Analysis, Monitoring, Improvement, and Applications (SQAMIA 2013), published by "CEUR workshop proceedings", vol. 1053, ISSN: 1613-0073, http://ceur-ws.org/Vol-1053/, 11-16. Stelios Xinogalos, Maya Satratzemi and Vasilis Dagdilelis. 2008. An analysis of students’ difficulties with ArrayList object collections and proposals for supporting the learning process. In Proceedings of the 8th IEEE International Conference on Advanced Learning Technologies (IEEE ICALT 2008), 18-20 July 2007, Niigata, Japan, 180-182. Nick Zacharis. 2009. Evaluating the Effects of Virtual Pair Programming on Students’ Achievement and Satisfaction. International Journal Of Emerging Technologies In Learning (IJET), 4(3).