and costs (bandwidth consumption, load distribution ... metrics (e.g. response time, average bandwidth usage and variance of the ... ing, as depicted in Figure 1(b), the monitoring information ..... The order of aggregation is free and aggregated.
Monitoring and Management of Structured Peer-to-Peer Systems Kalman Graffi, Dominik Stingl, Julius R¨uckert, Aleksandra Kovacevic, Ralf Steinmetz Technische Universit¨at Darmstadt, Multimedia Communications Lab KOM Merckstraße 25, 64283 Darmstadt, Germany. Email: {graffi,stingl,sandra}@kom.tu-darmstadt.de
Abstract The peer-to-peer paradigm shows the potential to provide the same functionality and quality like client/server based systems, but with much lower costs. In order to control the quality of peer-to-peer systems, monitoring and management mechanisms need to be applied. Both tasks are challenging in large-scale networks with autonomous, unreliable nodes. In this paper we present a monitoring and management framework for structured peer-to-peer systems. It captures the live status of a peer-to-peer network in an exhaustive statistical representation. Using principles of autonomic computing, a preset system state is approached through automated system re-configuration in the case that a quality deviation is detected. Evaluation shows that the monitoring is very precise and lightweight and that preset quality goals are reached and kept automatically.
1 Introduction The peer-to-peer (p2p) paradigm gained more and more impact in the last years, both in research and industry. Starting with file sharing and voice over IP, nowadays p2p-based video streaming are widely in use. Even p2p-based social network platforms [18] have been proposed. The p2p paradigm can provide the same functionality with similar quality of service like client/server based solutions, but with much lower costs. Costs are typically shared among the participating nodes. P2p applications get more and more mature, so that research question shifts from enabling new applications to provision of quality of service. The quality of service provided by a p2p system is the key factor for the success of p2p systems in the future. However, currently it is difficult both to monitor and manage the quality of a p2p system. The quality of a p2p system is characterized both by the performance (response times, hop counts, ...) and costs (bandwidth consumption, load distribution, ...). These metrics are typically evaluated in research papers and thus are interesting in a running system as well. Depending on the scenario in which the p2p architecture is used (e.g. desktop PCs) and the application it is used for (e.g. streaming), specific quality requirements
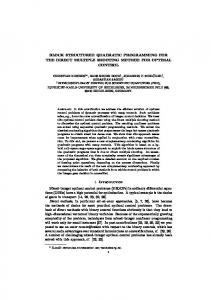
exist and it is important to see whether they are met or not. This is important both for the users and for professional p2p system providers as well. Our vision of monitoring and management of structured p2p systems assumes preset quality intervals for a set of metrics (e.g. response time, average bandwidth usage and variance of the bandwidth usage). In Figure 1(a) we depict an example set of preset quality intervals. Please note that this settings are scenario and application specific. Our work aims at detecting the current state of the metrics in a running system and in case of low quality to automatically improve the system quality. We propose a solution for monitoring a wide set of quality metrics in an exhaustive statistical representation. This representation consists of the average, variance, standard deviation, minimum, maximum, count and sum of a specific metric iterated over all peers in the p2p network. This information is used to compare the current state of the system to the preset quality goal. In the case that a deviation is detected from the preset quality intervals a process is initiated to automatically adapt the system configuration to meet the given quality goals. We sketch the monitoring and management framework in Section 2 and present our lightweight solution for monitoring structured p2p systems in Section 3, which we evaluate in Section 4. Using the principles of autonomic computing, as depicted in Figure 1(b), the monitoring information is analyzed in terms of matching the preset quality intervals. In the case that the analysis step detects a violation of the quality bounds, a planning process is initiated, which determines how the configuration of the p2p system needs to be adapted. In a next step, the derived adaptation command is shared among all peers which is then locally adopted. The steps of the management cycle are presented in Section 5. The evaluation of the management approach is presented in Section 6 and shows that preset quality intervals (e.g. response time intervals) are automatically reached and kept.
2 Management Framework for P2P Systems In this section we present our approach for monitoring and managing structured p2p systems. The idea is depicted in Figure 2. Using this framework for monitoring and man-
(a) Example Quality Intervals
(b) Autonomic Computing Steps
Figure 1. Overview on Autonomic Computing aging structured p2p systems, users and system providers are enabled to see a detailed view on the quality metrics of a running system. Further, preset quality intervals (e.g. as depicted in Figure 1(a)) are automatically met by the system through the usage of a self-configuration process which takes the current system state into account. In order to reach this goal, we follow the approach of autonomic computing, which has been presented in [8] and is depicted in Figure 1(b). The cycle of autonomic computing consists of five steps which we describe in the following. The figure describes which steps are needed to reach and keep a preset quality state. We present our solution for the core functionality, monitoring, in Section 3 and our approach for all five steps for p2p systems in Section 5. Monitoring The main task of the monitoring step is to retrieve a live view on the quality metrics of a p2p system. Quality metrics of the system are related to the performance (e.g. response time, data availability, hop count per lookup) and the corresponding costs (e.g. bandwidth consumption, local storage consumption). A wide set of metrics has been discussed in literature. We aim at getting not only the average metric value in the p2p network (e.g. hop count), averaged over all nodes. We also aim at getting the standard deviation, minimum, maximum, count and sum of all metrics over all peers. This aim is very challenging, as we assume a large-scale p2p network consisting of millions of nodes. However, the monitoring mechanism must be lightweight and its information precise and fresh. Knowledge The knowledge plane is a container that is filled with the system information, which is retrieved by the monitoring component. The further components operate on this information, thus the knowledge plane is the key point for information access. Analyze The analyze plane is programmed with preset quality intervals, depicting the requirements of the current p2p based application. A streaming application may require response times below 100ms and a relative CPU consumption up to 20%. Whereas a replication application may not state any requirement on the response time, but on the bandwidth consumption. However, the current quality metrics need to be analyzed and compared to the preset quality intervals, as depicted in Figure 1(a). In the case of a deviation
Figure 2. Managed Structured P2P System the running system needs to be reconfigured and adapted to approach the missed quality interval. The analyze plane determines which metric needs to be de- or increased. Plan Quality metrics cannot be lowered or raised directly, they result from the overall configuration of the system. The plan plane decides which configurable parameter needs to be changed in order to effect the invalid quality metric. The planing phase takes into account the interdependencies between parameters (e.g. routing table size) and metrics (e.g. hop count). It decides which parameter has to be changed and how. Execute A newly derived configuration needs to be adopted by all peers in the network. The execution step consists of spreading the information quickly to all nodes and locally apply the new settings on each node in a coordinated fashion. This is a challenging task in a large-scale p2p network with autonomous peers. Once the new configuration is adopted system wide, the effects need to be monitored and the autonomic computing cycle restarts. The presented autonomic computing cycle (Figure 1(b)) shows the idea of our approach to monitor the quality of a p2p system and to adapt it to reach preset quality standards.
3 Monitoring Structured P2P Systems In this section we present our approach for monitoring structured p2p systems. The monitoring framework has a dedicated role in the autonomic computing cycle, as it connects all peers in the network, gathers and aggregates the system state and propagates new system configurations. Our monitoring solution is an extension of our work in [4]. That previous work focused on enabling capacity-based peer search in p2p system, considering characteristics of individual peers. In the following we describe the details of our monitoring mechanism, which focuses on the retrieval of the global system state. The other steps of the autonomic computing cycle are discussed in Section 5.
Table 1. Monitored Metrics in the P2P System General Metrics number of online-peers average online-time complete in-/out-traffic average lookup-time in seconds in-/out-traffic of lookup-messages number of join- and leave-messages
3.1
Monitoring and Overlay monitoring: in-/out-traffic overlay: in-/out-traffic average bandwidth-consumption succeeded and failed operations traffic of ping- and pong-msgs
Goals and Assumptions
Goal of the monitoring is to gather a wide set of metrics on the quality of the p2p system. Table 1 displays all metrics, which are currently measured in the implementation of our monitoring architecture. The left column lists all metrics, which give a survey of a p2p system regardless the used overlay or monitoring mechanism, while the right column contains the metrics for the performance of the monitoring mechanism as well as for the underlying overlay. In order to deploy a monitoring infrastructure on top of a p2p system, we assume a structured P2P overlay implementing a DHT-protocol like Chord [15], Kademlia [12] or Tapestry [21]. Additionally to this precondition, the DHT must provide the functionality to address a node, which is responsible for a particular key, as well as the ability for a peer to determine, if it is responsible for a key. In the following, we list the names of the two functions: • void route(key K, msg M, node Hint) • boolean resp(key K) These functions typically come with the DHT, but we like to point out these requirements in detail. By using the provided methods of the DHT, the structure of the overlay is transparent to the monitoring mechanism, while its design can be kept as simple as possible.
3.2
Our Solution for Monitoring
In order to gather the status of all peers and aggregate them to a global system status, an information architecture needs to be established. Figure 3 depicts the monitoring architecture. We chose to establish a tree topology on top of the structured p2p overlay, as it allows a directed information flow towards the root. The structured p2p overlay provides the route functionality, as described in the key based routing interface (KBR) [3]. First, each peer in the network calculates its position in the tree based on its peerID and afterward periodically sends update messages about its status to its parent node, which we call Coordinator. The update messages a Coordinator receives contain aggregatable system statistics which are aggregated and propagated one step further towards the root. Please note that several aggregatable system statistic messages result in a single message of the same size after aggregation. The global view on all peers is merged at the root and propagated back to all nodes as ACK to the update messages. With this approach, we are able to monitor large-scale networks with constantly low individual peer
costs, even at the root. Additionally, due to the usage of the DHT, our solution inherits its robustness against churn. 3.2.1 A new ID space The monitoring architecture should be applicable on various structured p2p overlays. Thus it must be independent of the overlay-specific ID space SOID , which differs in size: SOID = {0, ..., 2160 − 1} ⊂ Q in Chord [15], SOID = {0, ..., 2128 − 1} ⊂ Q in Kademlia [12]. For that reason, we introduce an unified ID space SID = [0, 1] ⊂ R. The function fmap : SOID → SID fulfills following conditions: • conserve the convexity of identifier subsets. • sustain the set of keys, for which a peer is responsible. • be invertible, so that a remapping of a monitoring-ID always results in the same overlay-ID and that x = −1 fmap (fmap (x)) is applied. As a concrete mapping function, we introduce id fmap : SOID → SID , fmap (id) = highestID where highestID denotes the highest possible ID of SOID . Our monitoring mechanism operates only with IDs in SID . However, before sending a message using the route function of the KBR-compliant DHT the IDs are remapped. 3.2.2 The Monitoring Topology The topology of the monitoring mechanism must be capable of collecting and disseminating the system related information in an acceptable time as well as handling the churn affected overlay network. We chose a tree topology, as it allows a directed information flow towards the root. Before considering the creation of the tree, we explain some terms which are also depicted in Figure 3. Regardless of being a root, an inner node or a leaf, every node in the tree is denoted as Coordinator. This Coordinator is responsible for an interval in the ID space, which is called Domain. To determine the bounds of the Domain as well as its corresponding Coordinator, we use a function fkey , which recursively splits the ID space in Domains and SubDomains. In the beginning, the first Domain comprises the complete ID space [0; 1]. To calculate the Coordinator of a Domain that ranges from a to b, we pick the ID in the middle, designated as Coordinator-Key, using the function fkey (a, b) = a + b−a 2 . For the resulting Sub-Domains the recursive process of identifying Coordinator-Keys is performed as well. The division of a Domain into BF parts results in a b-tree with branching factor of BF (here BF = 2) as shown in Figure 3. After this overview of building the tree, we explain, how a peer calculates its position in the tree. At first, the peer determines the Coordinator-Key for the Domain, which comprises the whole ID space SID . By using the functionality resp(key) the peer can check, if it is responsible for the Coordinator-Key. In the case that it
is not responsible, it recursively traverses down the tree and calculates the next smaller domain which contains its peer ID. The whole procedure is repeated until the testing for responsibility is positive. Being responsible for a Coordinator-Key makes the peer the Coordinator of the corresponding domain. The Parent-Coordinator is the peer responsible for the Coordinator-Key one Domain higher. Now every peer knows its own position in the tree and the Coordinator-Key of its Parent-Coordinator by just using the function resp(key) provided by the DHT. Please note, that this functionality is easy to provide by the DHT and does not generate traffic overhead. Peers communicate only with their Parent-Coordinators and ParentCoordinators with their Sub-Coordinators correspondingly in the tree. This is done using the route(key K, msg M, node Hint) functionality of the KBR-compliant p2p overlay. We assume, that the DHT caches contacts that have been used, so that in most cases the Parent-Coordinator is contacted directly. Only in the case that the Parent-Coordinator left or is not anymore responsible for the Coordinator-Key, a new lookup is performed to find the new Parent-Coordinator. When we consider the structure of the tree, displayed in Figure 3, we observe a nearly uniform distribution of the nodes. Typically peers (e.g. peer 0.74) are responsible for two or more Coordinator-Keys in the tree. If messages are sent up the tree, every Coordinator receives the data from its corresponding Sub-Coordinator (e.g. peer 0.74 receives messages from 0.875 and 0.84375). When the received data is forwarded to the Parent-Coordinator, the peer with the ID 0.74 will send only one message from its highest Coordinator position (0.75) to its Parent-Coordinator (0.5). Domain D0
Domain D0
0.5
0.25 Domain D1
Domain D1
0.125 0.1875
0.75 0.875
0.625
0.3125
0.4375
0.8125
ID 0.59
0.0625
0.375
0.9375
0.84375
0.96875
0
1 ID 0.96875
ID 0.93
ID 0.88
ID 0.84375
ID 0.74
ID 0.7
ID 0.4375
ID 0.38
ID 0.3
ID 0.2
ID 0.1875
ID 0.19
ID 0.01
Responsibility Interval
Figure 3. Monitoring Tree Topology 3.2.3 The Communication Protocol Communication in the tree only takes place between a node and its Parent-Coordinator. In this subsection we present the message contents. The term system statistics stands for the periodical generation of statistics out of multiple metrics within the p2p system. The computation of the system statistics requires the continuous measurement and sending of metrics from every peer, which we denote as metric updates. The measured and aggregated data is forwarded upwards to the root, where further processing is executed. During its way to the root, every Coordinator in the tree aggregates the received data with its own measurements
Table 2. Aggregate Functions Function MIN(metric) MAX(metric) SUM(metric) SUMOFSQ(metric) COUNT(metric) AVG(metric) STDDEV(metric)
Description Calculates the minimal value of a metric Calculates the maximal value of a metric Sums the values of a metric Sums the squares of the values of a metric Counts the number of metric values Calculates the average of a metric Calculates the standard deviation of a metric
Receiving the ACK (step 5) Sub−Coordinator sends metrics
Sub−Coordinator sends metrics
Update Period: t_metricPeriod
Sub−Coordinator sends metrics
Metric−Update Remove stale Sub−Coordinators (step 1) Collect own metrics (step 2) Aggregate the metrics (step 3) elapsed time for executing the update
Send metrics to Parent−Coordinator (step 4) sends metrics Parent−Coordinator ACK for the update Receiving the ACK (step 5)
sends metrics Update Period: t_metricPeriod Metric−Update Remove stale Sub−Coordinators (step 1)
Figure 4. The Metric Update Routine and propagates it to the Parent-Coordinator until the root is reached. An aggregate function returns a single value from a set of input values, thus through aggregation of metrics at every level, the size of the information remains constant. For all of the metrics, not only the overall system average shall be computed, but also a wide statistical representation. Table 2 shows which statistical information is gathered for every metric (see Table 1) by our monitoring mechanism. The aggregate functions in our monitoring mechanism all fulfill the hierarchical computation property, which is introduced by [19] and demands commutativity and associativity. The order of aggregation is free and aggregated values can be further aggregated at higher levels. Figure 4 depicts the protocol for information exchange in the monitoring tree. We follow the rules for consistent and reliable routing according to [2]: • A peer of the overlay never processes a lookup message, if it is not responsible for the transmitted key. • When sending a message, a peer has to detect link failures or dead nodes. To implement the first condition, our monitoring mechanism only processes messages from Parent-Coordinators or
Sub-Coordinators. For the second condition, we introduce per-hop ACKs as well as retransmission for missed per-hop ACKs. If the transmission fails, the sender can directly lookup the peer responsible for the receivers ID and resend or choose another node for a later transmission. Concerning the communication in the tree, we considered up to now the propagation of information towards the root. Since the algorithm for calculating the position in the monitoring tree only supplies the Parent-Coordinator, the Sub-Coordinators, which are the children in the tree, should also be known to the Coordinator. For this reason, every Coordinator keeps track of the initiators of metric-update messages it receives. If a sender of a message is not the ParentCoordinator, the Coordinator can assume and check that the sending peer is one of its Sub-Coordinators. The Coordinator stores the ID of the sender including timestamp, which is always refreshed if a new message of that sender arrives. Through this timestamp, it can remove stale SubCoordinators, which did not sent any messages during a certain interval. By choosing a small interval, a Coordinator can administer a very actual table of its Sub-Coordinators. Please note that these timestamps are just locally used on each Coordinator and do not need to be synchronized. 3.2.4 Collecting System-Statistics We sketch the routine of the metric-updates, which is periodically repeated at every peer (see Figure 4): 1) Every Coordinator checks the timestamps of the entries in its Sub-Coordinator table. If the age of the entry exceeds a given threshold called toldMetrics , the entry is removed. This updating of the entries prevents the aggregation of old metrics from Sub-Coordinators, which may already have a new Coordinator or just went offline. The value for the threshold toldMetrics can be chosen dynamically depending on certain criteria (e.g. depth of a Coordinator in the tree). We chose it as a multiple of the metricupdate interval tmetricP eriod . Several simulations with different multipliers have shown that a good value for the multiple of tmetricP eriod ranges between 1.5 and 2. 2) Every node locally measures its own metrics / status. 3) The own metrics of a node are aggregated with the received ones of the Sub-Coordinators. Due to step 1, a node only aggregates metrics of updates that it received in the last update periods. Afterward, the aggregated metrics are ready to be sent. 4) Before sending the aggregated metrics every node calculates its position in the tree as well as its ParentCoordinator. After this position fixing in the tree the data is sent as metric update to the Parent-Coordinator. The root of the tree, which apparently has no parent, uses the aggregated data for generating statistics of the whole p2p system. 5) Every metric update is answered with an ACK, which contains the global system view aggregated at higher levels.
If the corresponding ACK is received, the current metricupdate terminates. Otherwise, a retransmission is initiated. 3.2.5 Discussion This routine for the metric-updates is very fault-tolerant and therefore predestined to run on churn affected overlay networks. If a Coordinator receives two updates from the same Sub-Coordinator during one period, the metric information about that Sub-Coordinator is updated locally. A characteristic of the metric-updates is their invariant size. Through the aggregation of the metrics at every level in the tree, the size does not expand. Thus the monitoring tree is scalable as new nodes do not result in increased load. Metric-updates are also used for maintaining the tree. Thus, the structure of the tree is always kept up-to-date and references to dead or old Coordinators are deleted. Lookups in the DHT are just started in the case, that the peer known as ParentCoordinator is offline or not anymore responsible for the Parent Coordinator’s key. Please note that we assume that the underlying p2p overlay handles churn correctly and provides always correct routing. Regarding churn, any Sub-Coordinator and ParentCoordinator may fail. In the case that a Sub-Coordinator fails it will be dropped from monitoring after one update period (by choosing toldMetrics between 1.5 and 2.0), still for one period it is monitored falsely as existent. However, this is a trade-off as some message loss or delay, which leads to timeout, should not result in a falsely ignored online peer. In the case of a failing Parent-Coordinator, effects are minimal. Typically the connection is detected as broken through the lost connection or missing ACK and the new Parent-Coordinator can be looked up. However, a new peer may not have received update information from SubCoordinators before transmitting its update to its ParentCoordinator. This update information may then describe only the state of the single peer, instead of the corresponding domain. In the next update interval, the new peer will receive the updates of its Sub-Coordinators and is fully integrated in the tree. Keeping this effect of reorganization in mind, we create a monitoring tree which adapts its structure in a fast and efficient way to the underlying overlay, especially for small values for the update period tmetricP eriod , which is responsible for triggering the metric-updates as well as for the tree maintenance. Finally, a global view on the quality of the p2p system is propagated from the root to all nodes back using the ACKs while no additional maintenance is needed for this functionality.
4 Evaluation of the Monitoring Mechanism In this section we present the evaluation results for our monitoring mechanism both in terms of performance and costs. We also show the effects of varying update intervals, branching factor and refining the aggregation functions.
We implemented our monitoring and management framework in PeerfactSim.KOM [9]. The simulator has also been used and presented in previous works [7, 10] of the community. Its granularity allows us to evaluate our monitoring mechanism with various DHTs. We used a networkdelay model based on global network positioning [13] and a churn model adapted from Steiner et al. in [14], which measured and analyzed the peer behavior in KAD [12]. We varied in our simulations the update interval times (30sec, 60sec and 120sec) with a fixed tree branching factor of 2. Then we varied the branching factor (tree degree 2, 4 and 8) with an update interval of 60sec. Finally we evaluated various monitoring smoothing mechanisms that eliminate monitoring outliers and obviously false results. We evaluated the parameter variations with 2500 nodes and 4 simulated hours. During the first hour all peers join the overlay. After 90 minutes, the churn-generator is started, which changes the network state of the peers in the system according to the KAD measurements. We simulated two KBR-compliant overlays: an idealDHT and Chord. The idealDHT implements a DHT and dispatches messages directly to peers that were addressed. This is in contrast to Chord, where churn may lead to overlay instabilities which influence the evaluation of our monitoring mechanism. Therefore we evaluate the parameter variations in an idealDHT, where objectIDs are matched to peerIDs always correctly and messages are always delivered correctly. Figure 5(a) and Figure 5(b) show the number of nodes in the network and the corresponding monitored number of nodes. Figure 5(a) depicts the reference node count, the unmodified and the exponential smoothed monitored data, whereas Figure 5(b) depicts additionally a median based smoothing mechanism. As we can see, especially taking the relative errors depicted in Figure 6(a) and 6(b) in account, the monitoring is already very precise. However, the unmodified monitoring has also some outliers, e.g. up to second 3000. This is caused by replacement of nodes at higher positions in the tree due to churn. The new nodes that take place at the higher levels in the tree do not yet have the correct view on their domain. It may happen that before they receive a metric update from their Sub-Coordinators, a false information is sent towards their Parent-Coordinator. We address obvious outliers with smoothing mechanisms: the median over an observation history and exponential smoothing. In exponential smoothing a history of observations is considered as well, but with decreasing weights for older values. A smoothed value sH for H observations is recursively calculated using a current measurement mH and the smoothed value of previous observations: sH = αmH + (1 − α)sH−1 , with α as smoothing factor. In Figure 6(a) and 6(b) we show the relative error in comparison to the reference data. The figure depicts a reference graph without refinement, a 5-value and 7-value me-
dian and exponential smoothing with three values (H=3,5,7) of the metrics-history and α = 0.5. The figure shows that the monitoring view gets smoother and is less affected by churn of the root. With avoiding outliers, the refinement mechanisms also introduce an additional delay in the information propagation, thus the information is less fresh. Here the exponential smoothing approach outperforms the median based solution in terms of precision and freshness. The monitored view is very close to the real node count. The node count is representative for all other metrics as well, as the monitored values are directly retrieved from the status of the peers and their freshness is independent of their semantic. Refining the monitoring data enables us to use the monitored status as input for our management framework. In Figure 5(c) we show the age of the monitoring information that is received at the root, here we varied the branching factor and the update intervals. A higher branching factor leads to a broader but lower tree. Thus as the freshness of the information is directly linked to the height of the tree, which is linked to the branching factor. A smaller update interval leads to fresher results, as the monitoring information is more frequently updated at the root. The corresponding costs of the traffic are depicted in Figure 6(c). For all parameter variations, we see that the bandwidth consumption is very low, less then 165 bytes per second to retrieve a fresh global view on the quality of the system. The ACK received from the Parent-Coordinator contains the global view retrieved from higher layers. The information about the global system view has always a constant size due to the aggregation functions. Thus the system wide monitoring comes with constantly low and predictable costs. With increasing the update intervals and the branching factor, the bandwidth consumption falls proportionally. Thus the trade-off between freshness and costs can be linearly adopted to the scenario requirements. We took the most promising parameter settings and evaluated the monitoring mechanism with this setting with 5000 peers. We used the branching factor BF = 4, an update interval of 60sec and exponential smoothing with the parameters H = 5 and α = 0.5. We used the same churn model as before and see, in Figure 7(a) how the node density in the tree evolves. First the peers join and the tree gets deeper and broader, whereas with peer failures the tree shrinks again. Figure 7(b) shows the monitoring results for 2500 and 5000 nodes. The figure shows how precise and fresh the monitoring information is. Finally, Figure 7(c) shows the costs occurring at each peer both as logged by the simulator and monitored by our monitoring mechanism. The monitored costs are very close to the real costs, which emphasizes the precision of the monitoring mechanism. The permanent out-bandwidth consumption is always below 100 bytes/s in average per node. These low costs are equal at all peers, as the aggregated information that needs to be sent is of the
2500
Real Online-Peers No Smoothing MS (H=5) MS (H=7)
3000 Number of Peers
Number of Peers
3000
Comparison of the different Smoothing Modes 3500
Real Online-Peers No Smoothing ES (H=3,a=0.5) ES (H=5,a=0.5) ES (H=7,a=0.5)
2000 1500 1000 500
2500 2000 1500 1000
Average Age of received Data at the Root 2500
1500 1000 500
500
0
0 0
2000 4000 6000 8000 10000 12000 14000 16000
BF=2,UI=60s BF=4,UI=60s BF=8,UI=60s BF=2,UI=30s BF=2,UI=120s
2000 Age of Data [s]
Comparison of the different Smoothing Modes 3500
0 0
2000 4000 6000 8000 10000 12000 14000 16000
Simulation-Time [s]
0
2000 4000 6000 8000 10000 12000 14000 16000
Simulation-Time [s]
(a) Node Count, Exponential Smoothing
Simulation-Time [s]
(b) Node Count, Median over History
(c) Age of Monitoring Information
Figure 5. Monitoring Precision and Freshness
No Smoothing ES (H=3,a=0.5) ES (H=5,a=0.5) ES (H=7,a=0.5) 0
2000 4000 6000 8000 10000 12000 14000 16000
Relative Error of the different Smoothing Modes 100 80 60 40 20 0 -20 -40 -60 -80 -100 -120
No Smoothing MS (H=5) MS (H=7) 0
Simulation-Time [s]
(a) Relative Error, Exponential Smoothing
2000 4000 6000 8000 10000 12000 14000 16000
Average Size of sent Monitoring-Traffic per Peer Size of Monitoring-Traffic [bytes/s]
100 80 60 40 20 0 -20 -40 -60 -80 -100 -120
Relative Error [%]
Relative Error [%]
Relative Error of the different Smoothing Modes
180 BF=2,UI=30s
160 140
BF=2,UI=60s BF=4,UI=60s BF=8,UI=60s
120 100 80 60
BF=2,UI=120s
40 20 0 0
2000 4000 6000 8000 10000 12000 14000 16000
Simulation-Time [s]
(b) Relative Error, Median over History
Simulation-Time [s]
(c) Monitoring Traffic Overhead
Figure 6. Relative Monitoring Error and Traffic Overhead same size in every tree level. Based on this, we argue that the mechanism is both very lightweight and precise. In this section we presented the evaluation of the proposed monitoring mechanism. Now that we have shown that the monitoring is both precise and cost effective, we can use it in the autonomic computing framework for p2p systems (as depicted in Figure 2). Our goal is to adapt the p2p system to fulfill preset quality intervals. Now that we are able to measure the quality status of a running p2p system, we can compare it to the preset quality intervals and initiate action upon deviation.
5 Managing Structured P2P Systems As we have stated in the requirements, our goal is to enable p2p systems to automatically reach preset quality levels. As shown in Figure 2 and Figure 1(b) the monitoring information is used in the analysis plane to decide whether the current system state is valid in terms of the preset quality goals. In the case that a deviation is detected, the plan plane decides on a new configuration for the system. The execute part of the autonomic computing cycle adopts the changes on each node individually and results in an improved system state, which is controlled through monitoring. In the following we describe our solution for a p2p based autonomic computing cycle which allows to manage the p2p system. Knowledge Plane The knowledge plane is a container for the monitoring information, while the analysis and plan plane operate on it. The monitoring information is gathered and merged at the root. By using the ACKs, it is propagated to all nodes in the p2p system as well. However, we operate
on the monitoring information stored at the root providing a coordinated management of the p2p system. Analysis Plane We propose that the root is also responsible for managing the analysis and planing step. We assume that the preset system quality is known to all peers. The root compares new received information about the current system state to the preset intervals, as seen in Figure 1(a). In the case that deviance is detected, the analysis plane contacts the plan plane to lower or raise the corresponding metric. A distributed analysis and plan plane can also be implemented, but is not elaborated due to space limitations. Plan Plane The plan plane is operating in the root. Various mechanism can be used here to decide on the interdependencies between metrics and parameters. Genetic algorithms and machine learning can be used to determine rules deciding which parameters in the system configuration to change in order to lower or raise a specific metric. In our case, for the simplicity of explanation, we integrated expert knowledge and introduced static rules for planing and used it only on one metric and parameter combination. In the evaluation we focus on the metric hop count and the parameter routing table size. By modifying the routing tables of all peers we can influence the average hop count in the system. We also introduce a stabilization phase, as depicted in Figure 8(a) to give the system time to adopt the changes before initiating new changes. A stabilization phase is characterized by the slope of the measurement history. If the slope is below a certain threshold, we assume that previous changes took effect. Thus a coordinated system adaption process is implemented as depicted in Figure 8(b).
Out-Bandwidth Consumption per Peer 1600 1400 1200 1000 800 600 400 200 0 100
150
200
250
6000
Size of Sent Traffic [bytes/s]
18 16 14 12 10 8 6 4 2 0 50
100
Monitored Peer Count by the Root Online Peers (5000) Monitored (5000) Online Peers (2500) Monitored (2500)
5000 Number of Peers
Tree Level
Structure of the Monitoring Tree
4000 3000 2000 1000 0 0
Periode [m]
90 80 70 60 50 40 30 20 Real Traffic (5000 peers) Monitored Traffic (5000 peers)
10 0
2000 4000 6000 8000 10000 12000 14000 16000
0
2000 4000 6000 8000 10000 12000 14000 16000
Simulation-Time [s]
(a) Tree Establishment
Simulation-Time [s]
(b) Precision of Monitoring View
(c) Monitoring Traffic Costs
Figure 7. Monitoring Evaluation with 5000 nodes Overlay hop count at query delivery
Hop count
1000
100
10
1
(a) Controlled Stabilization
Average Optimization init Target interval
100
200 300 400 Simulation time [min]
500
(b) Coordinated Adaptation
Figure 8. Adaptation and Stabilization Execute Plane In order to adopt configuration changes in the p2p system, two steps need to be supported: first, all nodes must be informed about the changes and second, all peers must adopt the configuration changes locally. Various design decisions exist how the configuration changes can be transmitted, either as fixed parameter settings or as policies that need to be interpreted locally. We used execution policies, describing which metric should be affected in which direction. These policies are derived at the root and propagated via the ACKs in the monitoring mechanism to all peers. Now these policies can be interpreted in relation to the actually used p2p overlay, e.g. Kademlia provides other techniques to lower the hop count than Chord. In the second step, the peers must be locally able to adopt the new policies. In our evaluation we focused on the configurability of Chord according to [11] and especially its ability to lower hop counts by changing the routing table size. We extended the original Chord implementation [15] in the simulations in a way that the number of fingers can be configured. By setting the routing table size, fingers are added/reduced, while the ID space is always covered logarithmically. To be precise, assuming that the routing table size of a Chord node with peer ID n is set to s, then the kth finger is pointing to the peer responsible for the key m∗(k−1) (n + p2 s q) mod 2m , where 2m is the size of the ID space. Here the routing table size s can be freely configured. Chord nodes can adapt to change policies with the goal to lower or raise the average hop count in the system. In this section we have described how we use the monitoring information to derive an execution policy for all peers, in the case that a deviance to the preset quality intervals exists. In the next section we show that the autonomic computing cycle works fast and reliable.
Table 3. Simulation Setup General Simulation time: Number of nodes: Chord FixFinger-Interval Stabilize-Interval CheckPredecessor-Interval
900min 1000 10s 10s 30s
Monitoring Update-Interval Tree degree Management Goal Hop Count History size Maximum Slope
300s 2 [7,10] 10 0.2
6 Evaluation of the Management Cycle We performed the evaluation of the autonomic computing cycle in the p2p system simulator PeerfactSim.KOM [9], as it allows us to configure the simulated modules very flexibly. We chose Chord [15] as p2p overlay due to its reference status for structured p2p overlays. Further we picked the hop count as reference metric and defined the interval [7, 10] as goal interval. In order to reach this goal, we modified the Chord overlay to allow the dynamic reconfiguration of the routing table size. On top of Chord we applied our monitoring and management layer as an additional layer, as depicted in Figure 2. This layer uses the KBR-compliant DHT Chord for the monitoring communication to establish a monitoring tree. The tree is used to gather the system state, which is analyzed at the root and an execution policy is propagated back to all nodes in the tree using ACKs. We chose the simulation setup as described in Table 3. Between minute 1 and 90 all peers join and stabilize between minute 90 and 110. In this time the fingers are established in Chord. Beginning from minute 110 the peers initiate lookups in the overlay. This is done to generate overlay traffic so that the average hop count per lookup request can be estimated. We have two initial setups for the Chord scenario, in both the goal is to reach the preset quality interval of [7,10] for the average hop count. First we start with a Chord configuration that is “too good”, i.e. the hop count is very low and a lot of bandwidth is wasted for maintenance to provide this good service. Figure 6 depicts this case, the workload and the traffic characteristics are depicted in Figure 9(c). In Figure 9(a) the hop count is monitored as too low, i.e. 5.7 which is not in [7,10]. At minute 170, 230 and 310 of the simulation time the analysis plane detects that the metric
does not change (no slope) and the goal interval is still not reached, thus the policy for increasing the routing table is disseminated. The policy is then distributed in ca. 12 update intervals to all peers in the system and directly adopted, resulting in a decrease of the routing table size of 10%, as depicted in Figure 9(b). The process is repeated until the average hop count reaches the desired quality interval. The second setup starts with a pre-configured routing table that is too small (20 entries), corresponding workload is depicted in Figure 10(c). The hop count related to that routing table size is about 100. The monitoring information is interpreted by the analysis plane and it is decided that the hop count needs to be reduced to reach the interval [7,10]. In order to do so, the policy to decrease the hop count is interpreted in Chord as command to double the routing table size. This is done in two steps, as the first step already lowers the hop count to 11. After the second adaptation step, the desired interval for the hop count metric is met and the mechanism does not initiate any further improvement steps. Evaluation shows that the autonomic computing cycle is functional and leads quickly to an approximation of a desired quality state.
7 Related Work IBM stated in 2001 that the only remaining chance for overcoming the burden of complexity will be self-managing autonomic systems [8]. They proposed the theory for the autonomic computing cycle. Although self-organization of p2p systems is old, the utilization of a global view on p2p system which allows for direct analysis of the system state and the initiation of adaptation processes is new. Some monitoring solutions for p2p systems have been proposed. DASIS [1] is an extension for the routing table of p2p overlays that stores additional routing specific information, it only provides few information of local nodes and is strongly linked to the overlay. A strong linkage of overlay and monitoring layer is also given in Astrolabe [16] and its successor Willow [17]. Both provide not only monitoring functionality but also overlay functionality which makes it hard to use them with other p2p overlays. P2P-Diet [5] is an extension for hybrid unstructured p2p overlays, which allows for ad-hoc and continuous search for specific objects (and peers). Information updates are broadcasted frequently which leads to high overhead and maintenance costs. Our monitoring mechanism focuses on structured p2p overlays and is lightweight. T-MAN [6] uses proactive gossiping to spread information in the network. Although this approach is generally applicable in any overlay, the information is hard to update and typically old. The freshness of the information in our monitoring solution is directly linked to the height of the tree, which allows coordinated information gathering and dissemination. SOMO [20] follows a tree based approach as well and is inspiring. SOMO builds
a tree top down on the peers in the ID space, identifying nodes in the tree using a stateless function. In SOMO the information is pulled up towards the root, aggregated and pushed back. Due to the pull based approach costs for identifying peers in lower regions are high. Our approach needs less maintenance, especially because every node is able to calculate its position in the tree. SDIMS [19] supports information aggregation as well. For every attribute a tree of its own is built thus the load is stronger shared, but this also makes it difficult to retrieve a global view combining various metrics. Only a rich monitoring mechanism, applicable for several p2p overlays enables the further steps of autonomic computing to be implemented. Thus related work on p2p related approaches for implementing autonomic computing elements are rare, as this essential monitoring part was either not evolved enough up to now or not used for the purpose of self-configuration.
8 Conclusion and Future Work In this paper we have presented a monitoring and management framework for structured p2p systems. Our monitoring mechanism is applicable on any KBR-compliant DHT overlay as it reuses core functionality of the KBR interface. The monitoring mechanism provides a fresh and detailed view on the quality of the system, which is presented as a statistical summary on an expandable number of metrics. Using the functions of the underlying DHT, our monitoring mechanism is lightweight (less than 100 bytes per second) and still very robust and churn resistant. From the management point of view we provided a mechanism that enables the system to reach and hold preset quality standards. Our proposed solution follows the principles of autonomic computing. The monitoring information is used to detect deviance from preset quality intervals. Our solution analyzes the deviance, decides on action to be taken and sends an execution policy using the monitoring tree to all peers. The peers implement a corresponding strategy (e.g. adapting the routing table size) in a coordinated manner. The system waits until the changes take effect and initiates further actions if the effects are not sufficient. Thus a preset quality interval, e.g. for the average hop count, is reached and hold. Our solution fulfills the requirements for a monitoring and management mechanism for structured p2p systems in a fast and cost effective way. This mechanism allows to manage complex p2p applications, as an optimal configuration for any given scenario can be found automatically. The quality of the system is maintained even under high dynamism of the scenario, like changing user behavior, peer heterogeneity or churn. For the future we apply our solution for Kademlia which offers more parameters to effect the quality of the system. Further, we investigate interdependencies between the parameters and metrics using machine learning, so that adaptation rules can be derived based on the live observations.
Overlay hop count at query delivery
10 8 6 4
Workload of the system 10000
Minimum Maximum Average
160 Size of finger table
12 Hop Count
Aggregated finger table size
Average Target interval
150
Message Count
14
140 130 120
2 0
110 0
100 200 300 400 500 600 700 800 900
Forwarded msgs Delivered msgs Started queries
1000
100
10
1 0
Simulation time [min]
100 200 300 400 500 600 700 800 900
0
100 200 300 400 500 600 700 800 900
Simulation time [min]
(a) Hop Count
Simulation time [min]
(b) Routing Table Size
(c) Workload and Traffic Overhead
Figure 9. Adaptation of the Hop Count: Starting With a Too Low Hop Count Overlay hop count at query delivery
Message Count
10
Workload of the system 100000
Minimum Maximum Average
100 Size of finger table
100
Hop Count
Aggregated finger table size 120
Average Target interval
80 60 40
Forwarded msgs Delivered msgs Started queries
10000
1000
100
20 1
0 0
100 200 300 400 500 600 700 800 900 Simulation time [min]
(a) Hop Count
10 0
100 200 300 400 500 600 700 800 900 Simulation time [min]
(b) Routing Table Size
0
100 200 300 400 500 600 700 800 900 Simulation time [min]
(c) Workload and Traffic Overhead
Figure 10. Adaptation of the Hop Count: Starting With a Too High Hop Count
References [1] K. Albrecht, R. Arnold, M. G¨ahwiler, and R. Wattenhofer. Aggregating Information in Peer-to-Peer Systems for Improved Join and Leave. In Proc. of IEEE P2P ’04, pages 227–234. IEEE Computer Society, 2004. [2] M. Castro, M. Costa, and A. Rowstron. Performance and dependability of structured peer-to-peer overlays. Dependable Systems and Networks, 2004 International Conference on, pages 9–18, June-1 July 2004. [3] F. Dabek, B. Zhao, P. Druschel, J. Kubiatowicz, and I. Stoica. Towards a Common API for Structured Peer-to-Peer Overlays. In Proc. of IPTPS ’03, 2003. [4] K. Graffi, A. Kovacevic, S. Xiao, and R. Steinmetz. SkyEye.KOM: An Information Management Over-Overlay for Getting the Oracle View on Structured P2P Systems. In Proc. of IEEE ICPADS’08, pages 279–286, 2008. [5] S. Idreos, M. Koubarakis, and C. Tryfonopoulos. P2P-DIET: An Extensible P2P Service that Unifies Ad-Hoc and Continuous Querying in Super-Peer Networks. In Proc. of ACM SIGMOD ’04, pages 933–934. ACM Press, 2004. [6] M. Jelasity and O. Babaoglu. T-Man: Gossip-based Overlay Topology Management. In Proc. of ESOA’05, 2005. [7] S. Kaune, T. Lauinger, A. Kovacevic, and K. Pussep. Embracing the Peer Next Door: Proximity in Kademlia. In In Proc. of IEEE P2P ’08, pages 343–350, 2008. [8] J. O. Kephart and D. M. Chess. The Vision of Autonomic Computing. Computer, 36(1):41–50, 2003. [9] A. Kovacevic, S. Kaune, P. Mukherjee, N. Liebau, and R. Steinmetz. Benchmarking Platform for Peer-to-Peer Systems. it - Information Technology, 49(5):312–319, 2007. [10] A. Kovacevic, N. Liebau, and R. Steinmetz. Globase.KOM A P2P Overlay for Fully Retrievable Location-based Search. In Proc. of IEEE P2P ’07, 2007.
[11] J. Li, J. Stribling, R. Morris, M. F. Kaashoek, and T. M. Gil. A Performance vs. Cost Framework for Evaluating DHT Design Tradeoffs under Churn. In Proc. of INFOCOM, 2005. [12] P. Maymounkov and D. Mazi`eres. Kademlia: A Peer-to-Peer Information System Based on the XOR Metric. In IPTPS ’02, pages 53–65, 2002. [13] E. Ng and H. Zhang. Predicting Internet Network Distance with Coordiantes-based Approaches. In Proc. of INFOCOM’02, 2002. [14] M. Steiner, T. En Najjary, and E. W. Biersack. Analyzing Peer Behavior in KAD. Technical Report EURECOM+2358, Institut Eurecom, 2007. [15] I. Stoica, R. Morris, D. Liben-Nowell, D. R. Karger, M. F. Kaashoek, F. Dabek, and H. Balakrishnan. Chord: a Scalable Peer-to-Peer Lookup Protocol for Internet Applications. IEEE/ACM Trans. Netw., 11(1):17–32, 2003. [16] R. van Renesse, K. P. Birman, and W. Vogels. Astrolabe: A Robust and Scalable Technology for Distributed System Monitoring, Management, and Data Mining. ACM Trans. Comput. Syst, 21(2):164–206, 2003. [17] R. van Renesse and A. Bozdog. Willow: DHT, Aggregation, and Publish/Subscribe in one Protocol. In Proc. of IPTPS ’04, pages 173–183. Springer, 2004. [18] Wuala. http://www.wua.la/, 2008. [19] P. Yalagandula and M. Dahlin. A Scalable Distributed Information Management System. In SIGCOMM ’04, pages 379–390. ACM, 2004. [20] Z. Zhang, S. Shi, and J. Zhu. SOMO: Self-Organized Metadata Overlay for Resource Management in P2P DHT. In Proc. of IPTPS ’03, volume 2735. Springer, 2003. [21] B. Zhao, L. Huang, J. Stribling, S. Rhea, A. Joseph, and J. Kubiatowicz. Tapestry: A Resilient Global-scale Overlay for Service Deployment. IEEE Journal on Sel. Areas in Comm., 22(1):41–53, 2004.