Monitoring Campsite Proliferation and Conditions: Recent Methodological Considerations Peter Newman, Christopher Monz, Yu-Fai Leung, and David M. Theobald Introduction
PROTECTING RESOURCE AND VISITOR EXPERIENCE CONDITIONS IN U.S. NATIONAL PARKS, wildernesses, and similar protected areas is mandated by federal policies (e.g., Wilderness Act of 1964, National Park Service Act of 1916) and requires development of monitoring protocols that allow managers to detect visitor use and resource impact trends as well as to evaluate management effectiveness. “Resource impact,” in this case, is defined as any undesirable visitor-related biophysical change to such resource components as soil, vegetation, wildlife, and water (Leung and Marion 2000). The need for monitoring has become more important as a result of the growing adoption of visitor capacity management frameworks for protected areas, such as Visitor Experience and Resource Protection (VERP) and Limits of Acceptable Change (LAC). As visitor use in wilderness continues to rise, types of use continue to diversify, and fiscal budgets become tighter, managers are challenged to find time and money to conduct quality visitor impact monitoring programs. When monitoring and mitigating resource impacts related to visitor use, managers must decide which indicators to measure and how often to monitor such conditions. All too often, managers and researchers collect large amounts of data that are left unanalyzed. In this case, researchers can support parks by providing an “efficient” means of collecting and analyzing data. In this case, “efficiency” is defined as collecting the most amount of robust data for the least amount of expenditure (both personnel/volunteer energy and money). This assumes that higher sample sizes will yield more precise results. More work in support of managers’ monitoring and data analysis needs will contribute to their continual efforts to maintain high-quality recreation opportunities. 28
Protecting both resources and visitor experience can be very challenging for parks and related areas. Managers often rely on objectives-planning frameworks such as LAC and VERP to accomplish their aims. At the heart of management by objectivesplanning framework are the setting of appropriate management objectives, the development of associated indicators and standards of quality, and a strong and consistent monitoring program that signals when management action should be taken. Over the last several years, there has been much discussion about the efficacy of such planning frameworks (McCool and Cole 1999; Manning and Lawson 2002). Moreover, budget constraints have forced many parks to do more work with fewer people, and often monitoring and analysis of data The George Wright Forum
Visitor Impact Monitoring
have fallen by the wayside. For all of these reasons, researchers and managers must work together to develop creative approaches to collecting data that acknowledge the constraints faced by managers in the field. What follows is an examination of new methodological approaches that may alleviate some campsite monitoring challenges. This paper reports preliminary findings from two on-going studies that are using alternative geospatial and photographic approaches to document campsite proliferation and conditions, respectively. Monitoring camping impacts
Camping activities can induce substantial and often localized resource impacts that can affect soil (soil compaction and erosion), vegetation (loss of ground vegetation), wildlife (habitat alteration), and water (increased turbidity) (Hammitt and Cole 1998; Cole 2004). If unchecked, camping impacts are likely to intensify and proliferate, and can become a vector for invasive or exotic species, resulting in substantial soil and vegetative degradation as well as a compromised visitor experience (Hammitt and Cole 1998; Newman et al. 2005). Research on campsites suggests that the relationship between level of use and level of many impact variables is curvilinear, with the majority of impact occurring with initial use (Hammitt and Cole 1998). In addition, recent studies have shown that the proliferation of new campsites is a major contributing factor to the increase in total campsite impact (Cole 1993, 1996; McEwen et al. 1996). Because of this tendency for camping impacts to expand and proliferate, managers are often eager to monitor both the number and condition of campsites in the backcountry. Volume 23 • Number 2 (2006)
Monitoring camping impacts is logistically challenging in backcountry and wilderness areas due to the dispersed distribution of sites over the landscape and associated field time involved. Yet, it is imperative to create a robust and efficient campsite monitoring program that will inform visitor capacity management frameworks and adaptive management approaches (Grumbine 1994). Recent advances in geospatial techniques have benefited campsite and trail impact monitoring, especially the use of global positioning system (GPS) technology to document location of sites and impact attributes (Leung and Marion 2000). In contrast, while geographic information systems (GIS) have been utilized to derive spatial sampling strategies in landscape ecology and conservation biology (Theobald 2005), little attention has been paid to the potential of adapting the same concepts to facilitate campsite impact monitoring. In addition, site monitoring protocols have seen very little advancement since initial development (Cole 1981) and subsequent modification (Marion 1991). Although the methods remain sound, some aspects—such as the measurement of campsite size and estimation of vegetation cover—can be challenging to conduct consistently over multiple years and with seasonal personnel. A re-examination of these methods in light of new available technology may offer increased measurement efficiency, precision and consistency. Methodological considerations for monitoring campsite proliferation: Yosemite National Park
In the spring of 2004, managers from Yosemite National Park were challenged to estimate the total number of campsites as an indicator of campsite proliferation in the 29
Visitor Impact Monitoring
wilderness zone of Merced River corridor in order to protect the “outstandingly remarkable values” outlined in the 1968 Wild and Scenic Rivers Act. The Merced River corridor within Yosemite is designated “wild and scenic” and is approximately 80 miles in length and is one-half mile in width. The corridor has two designated camping areas but most of the use is considered to be dispersed. The amount of field time that could be devoted to this task by the park staff was very limited. Based on these challenges, efficient methods needed to be developed that would enable the measurement of the number of campsites in a short period of sampling. Methods. The above challenges brought together a team of people interested in finding new ways to monitor campsite impacts within a wilderness corridor. The new campsite impact monitoring protocol would have to consider that managers pressed for time may not to be able to monitor as frequently as they would like because of reduced budgets, fewer staff, and other stochastic events such as weather, medical emergencies, and unforeseen circumstances. In this case, managers needed to understand the trade-offs associated with the amount of data collected and precision needed when deciding the number of days or times that an indicator is measured. During the summer and fall of 2004, researchers and park staff convened and chose five spatially explicit factors that, based on previous park research as well as managerial opinion, strongly influence the likelihood of finding campsites along the Merced River corridor. The factors included: distance from trailheads, landscape slope, distance from water, distance visitors tend to travel off trail, and presence of designated no-camping zones. For each of the 30
factors, a map layer was developed to represent the feature in question. For example, since the distance from water is an important site selection criterion, a map layer featuring all water bodies within the river corridor was created. Based on these maps, a function was generated that relates the spatial location to the probability of having a campsite located there. These five factors were combined (equally weighted) by multiplying their probability to generate an overall model of “camping probability” (values of likelihood of being selected in the sample) surface from which sampling points were drawn. (The probabilities were represented on a 0–1 scale, with 0 being “unlikely” and 1 being “most likely” to find a campsite based, for example, on distance from trail.) The sampling points generated were well distributed (spatially balanced) and based on the total “campable” area and spatial autocorrelation. Spatial autocorrelation is based on Tobler’s First Law of Geography, which captures the idea that everything is related to everything else, but “near things are more related than distant things’’ (Tobler 1970). For each point, Universal Transverse Mercator (UTM) coordinates were provided that enabled managers to navigate to the specific sampling point using GPS units. At each sample point, rangers looked for signs of a campsite within a 50-m radius of the location. Campsites were recorded as a 1 (campsite was found) or a 0 (campsite was not found). Results. Based on the parameters above, 5,466 acres were identified as “campable.” One hundred points, representing location, were then selected and prioritized within the campable surface. Yosemite managers determined that they could visit 30 points during the summer field season. The George Wright Forum
Visitor Impact Monitoring
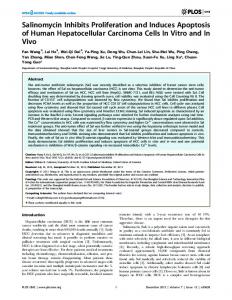
During the summer of 2004, 29 points were visited and the surrounding 50-m area assessed, with 5 campsites being found (Figure 1). Because the samples were drawn from the population of campable locations using an unequal inclusion probability, we weighted the importance of each sample based on the inverse of their inclusion probability. That is, the more likely that a location was sampled (e.g., approaching 1.0), the smaller the weight, and the less likely that a location was sampled (e.g., 0.1), the larger the weight (1/0.1 = 10). The strength of using a probability-based sample is that a statistically reliable estimate of the population can be determined. Using “convenience” samples does not allow one to infer a total population. Weights for each of the 29 samples were computed to determine the propor-
tion of the total campable area each sample represented. The five samples where campsites were found totaled 7.91%, meaning that roughly 8% of the campable area had evidence of a campsite. This translates to roughly 432.3 acres that are “camped on” in the wilderness portion of the Merced River corridor. Because the size of campsites is variable, an exact number was not determined, but the researchers as well as park managers decided that total acreage may be a better basis from which to determine a standard, as the total footprint of all campsites could serve as a better ecological measure. Total time expenditure. The total sampling time for this effort was eight days, including three days on the main stem of the Merced River and 5 days on the South Fork. While refinements and validations are
Figure 1. Campsite sampling points along the Merced River.
Volume 23 • Number 2 (2006)
31
Visitor Impact Monitoring
needed, this GIS-enhanced monitoring approach has the potential of allowing park staff more flexibility in monitoring based on their field visit schedule and provides a more efficient approach to estimating the potential impacts of campsite proliferation. In addition to campsite proliferation, the degradation of established campsite resource conditions is another significant management concern. New methods now being used can provide an efficient means to collect such data. Methodological considerations for assessing campsite conditions
plished, most recent studies follow protocols similar to those of Marion (1991). Despite the value of conducting visitor site assessments, managers continue to experience challenges in collecting data in the field and in analyzing and maintaining them. Moreover, the time required to perform measurements at each site, particularly the radial transect measurement, can be problematic for field staff. Continued improvements of assessment methodologies to address these concerns are needed in order to foster an increased application of monitoring techniques. Possible solutions. Digital photography of field sites, combined with image analysis of the digital photos, is a methodological option for addressing some of the above challenges (Monz and D’Luhosch 2006). In this technique, a compact digital camera with a wide-angle lens (20-mm standard focal length) is held on a boom (2.5–3 m in length) over the center of the campsite. Photos are taken with the lens pointed directly downward, with the image capturing a site approximately as large as 5x7 m (Figure 2). Larger sites can be documented by using a series of slightly overlapping photographs and using readily available panoramic features in photo software (e.g.,
There is nearly universal agreement among park and protected area managers that assessment and monitoring of visitor site conditions is important to meet management objectives for many areas. This agreement largely stems from the importance of site conditions to the visitor experience and from the importance of tracking changes in resource condition. These types of assessments have a relatively long history in recreation management, with observations dating back at least to the 1930s (Bates 1935) and 1940s (Sumner 1942). Subsequent efforts focused on campsite conditions have led to improved methodologies, some of the most significant Figure 2. Example of an overhead image of a backcountry campsite. being the development of conditionclass rating systems (Frissell 1978), multi-parameter assessment methods (Cole 1981), and the variable radial transect method for the measurement of site size (Cole 1981; Marion 1991). More recently, campsite assessments have routinely incorporated GPS/GISbased mapping of site locations (e.g., Monz and Twardock 2004). Although some minor measurement improvements have also been recently accom32
The George Wright Forum
Visitor Impact Monitoring
“Photomerge” in Photoshop Elements). GPS location data can be included by either separate data collection, or by automated means with a direct connection to the camera or by utilizing software that associates digital photos with GPS points (e.g., MediaMapper, Trimble Navigation). Image analysis of photos allows the determination of an overall percent vegetation cover and for a determination of total site area by counting specified pixels in the image. Several software options exist for this purpose, including some inexpensive and easyto-use programs (e.g., Able Image Analyzer, Mu Labs, Inc). Conclusions and future directions. Preliminary analyses from the assessment of 36 forest understory campsites, using a digital photo-image analysis protocol, suggest that the methodology would increase precision of campsite vegetation cover and size estimates, while decreasing time requirements for field staff (Monz and D’Luhosch 2006). Computer analysis can be accomplished in five to ten minutes per campsite, depending on whether image editing in Photoshop is required. This method seems particularly promising for increasing the precision of vegetation cover measurements, which heretofore were categorical ratings with undetermined error (e.g., Marion 1991). With image analysis, an average of 4% error was found in measurements on images of known vegetation cover, ranging from 5% to 75% (Monz and D’Luhosch 2006). Further development of this protocol by applying the technique to a wide range of environments will determine whether it could be suggested as a viable option for managers implementing monitoring programs.
Volume 23 • Number 2 (2006)
Discussion and implications
Managing and monitoring campsite impacts is an important part of protected area management, and timely and valid monitoring data can inform management decisions. While park managers should invest in monitoring and incorporate the results into their management decisionmaking, they are also stretched thin by various demands. Researchers should be cognizant of such realities and help managers do their jobs better by developing more efficient and flexible monitoring protocols. New technologies and techniques, such as those suggested in this paper, provide opportunities to increase field efficiency and should be utilized as appropriate. When deciding on campsite monitoring methods there is always a trade-off between effort (time collecting data) and accuracy (amount of data collected). For example, while monitoring data coming from a census of campsites could provide the most accurate and precise picture of campsite distribution, their value and sensitivity for detecting trends of campsite proliferation (as a warning sign) are very limited. Typically a complete census cannot be done very often due to the amount of effort and resources required. For example, a complete census of backcountry campsites was done in Yosemite in 1972 and took 28 people a full summer to complete (Boyers et al. 2000). The digital image analysis techniques illustrated here represent an option for managers needing to minimize the field time and complexity of site assessments. Field staff can be equipped with a compact digital camera and GPS receiver and conduct assessments very rapidly, perhaps even
33
Visitor Impact Monitoring
concurrently with other field duties. Measurements of images and subsequent data analysis can be performed in the office during the low use season. Despite being preliminary in nature, the results presented in this paper represent some of the current thinking in harnessing accessible geospatial and digital imaging technologies to improve campsite impact
monitoring. If fully developed, these new techniques can substantially increase field efficiency and encourage more monitoring to be performed by the park staff. Good, flexible, procedures can help parks obtain more spatially robust data in order to make informed management decisions and prioritize management goals.
References
Bates, G.H. 1935. The vegetation of footpaths, sidewalks, cattracks and gateways. Journal of Ecology 23, 468–487. Boyers, L., M. Fincher, and J. van Wagtendonk. 2000. Twenty-eight years of wilderness campsite monitoring in Yosemite National Park. In Wilderness Science in a Time of Change Conference—Volume 5: Wilderness Ecosystems, Threats, and Management. D.N. Cole, S.F. McCool, W.T. Borrie, and J. O’Loughlin, comps. Proceedings RMRS-P-15VOL-5. Ogden, Utah: U.S. Department of Agriculture–Forest Service, Rocky Mountain Research Station, 105–109. Cole, D.N. 1981. Managing ecological impacts at wilderness campsites: An evaluation of techniques. Journal of Forestry 79:2, 86–89. ———. 1993. Campsites in Three Western Wildernesses: Proliferation and Changes in Condition Over 12 to 16 Years. Research Paper INT-463. Ogden, Utah: U.S. Department of Agriculture–Forest Service, Rocky Mountain Research Station. ———. 1996. Wilderness recreation in the United States: Trends in use, users, and impacts. International Journal of Wilderness 2:3, 14–18. ———. 2004. Environmental impacts of outdoor recreation in wildlands. In Society and Natural Resources: A Summary of Knowledge. M.J. Manfredo, J.J. Vaske, B.L. Bruyere, D.R. Field, and P.J. Brown, eds. Jefferson, Mo.: Modern Litho, 107–116. Frissell, S.S. 1978. Judging recreation impacts on wilderness campsites. Journal of Forestry 76:8, 481–483. Grumbine, E.R. 1994. What is ecosystem management? Conservation Biology 8, 27–38. Hammitt, W.E., and D.N. Cole. 1998. Wildland Recreation: Ecology and Management. 2nd ed. New York: John Wiley and Sons. Leung, Y.-F., and J.L. Marion. 2000. Recreation impacts and management in wilderness: A state-of-knowledge review. In Wilderness Science in a Time of Change Conference— Volume 5: Wilderness Ecosystems, Threats, and Management. D.N. Cole, S.F. McCool, W.T. Borrie, and J. O’Loughlin, comps. Proceedings RMRS-P-15-VOL-5. Ogden, Utah: U.S. Department of Agriculture–Forest Service, Rocky Mountain Research Station, 23-48. Manning, R., and S. Lawson. 2002. Carrying capacity as “informed judgement”: The values of science and the science of values. Environmental Management 30, 157–168.
34
The George Wright Forum
Visitor Impact Monitoring
Marion, J.L. 1991. Developing a Natural Resource Inventory and Monitoring Program for Visitor Impacts on Recreation Sites: A Procedural Manual. Natural Resources Report NPS/NRVT/NRR-91/06. Denver: National Park Service, Natural Resources Publication Office. McEwen, D., D.N. Cole, and M. Simon. 1996. Campsite Impacts in Four Wildernesses in the South-Central United States. Research Paper INT-RP-490. Ogden, Utah: U.S. Department of Agriculture–Forest Service, Rocky Mountain Research Station. McCool, S.F., and D.N. Cole. 1999. Experiencing Limits of Acceptable Change: Some thoughts after a decade of implementation In Proceedings—Limits of Acceptable Change and Related Planning Processes: Progress and Future Directions. S.F. McCool and D.N. Cole, comps. General Technical Report INT-GTR-371. Ogden, Utah: U.S. Department of Agriculture–Forest Service, Rocky Mountain Research Station, 72-78. Monz, C.A., and P. D’Luhosch. 2006 (in press). A digital image analysis method for assessing and monitoring backcountry recreation site conditions. In Proceedings of the 2005 Northeastern Recreation Research Symposium. April 9–11, 2005, Bolton Landing, N.Y. General Technical Report NE-xxx. Newton Square, Pa.: U.S. Department of Agriculture–Forest Service, Northeastern Research Station. Monz, C.A., and P. Twardock. 2004. The resource impacts of sea kayak use in Prince William Sound, Alaska. In Environmental Impacts of Ecotourism. R. Buckley, ed. Wallingford, U.K.: CABI Publishing, 309–316. Newman P., R.E. Manning, D. Dennis, and W. Mckonly. 2005. Informing social carrying capacity decision making in Yosemite National Park, using stated choice modeling. Journal of Parks and Recreation Administration 21:3, 43–56. Sumner, E.L. 1942. The biology of wilderness protection. Sierra Club Bulletin 27:4, 14–22. Theobald, D.M. 2005. GIS Concepts and ArcGIS Methods. 2nd ed. Fort Collins, Colo.: Conservation Planning Technologies. Tobler, W.R. 1970. A computer movie simulating urban growth in the Detroit region. Economic Geography 46, 234–240.
Peter Newman, Department of Natural Resource Recreation and Tourism, Colorado State University, Fort Collins, Colorado 80523;
[email protected] Christopher A. Monz, Environmental Studies Department, St. Lawrence University, Canton, New York 13617;
[email protected] Yu-Fai Leung, Department of Parks, Recreation and Tourism Management, North Carolina State University, Raleigh, North Carolina 27695-7106;
[email protected] David M. Theobald, Department of Natural Resource Recreation and Tourism, Colorado State University, Fort Collins, Colorado 80523,
[email protected]
Volume 23 • Number 2 (2006)
35