permanent rangeland monitoring sites that had been previously established during the Gobi. Forage Project to develop a Mongolian Global Livestock Early ...
Monitoring Change on Mongolian Rangelands
Dennis P. Sheehy1, Michael Hale1, Daalkhaijav Damiran2,3, Thomas J. Sheehy1 DamdinTsogoo4, and Sharav Batsukh5
1
International Center for the Advancement of Pastoral Systems, Wallowa, Oregon, USA 2 Department of Animal and Poultry Science, University of Saskatchewan, Saskatoon, SK, S7N 5A8, Canada 3 Western Beef Development Centre, Humboldt, SK, S0K 2A0, Canada 4 Maral-Ganga Consulting, Ulaanbaatar, Mongolia 5 Research Institute of Animal Husbandry, Zaisan-210153, Mongolia
May 2012
Sheehy, D., M. Hale, D. Damiran, T. Sheehy, D. Tsogoo, and Sh. Batsukh. 2012. Monitoring change on Mongolian rangelands. Final report for Netherlands-Mongolia Environmental Trust Fund for Environmental Reform (NEMO). 156 pp.
Acknowledgements The “Monitoring Change on Mongolian Rangelands” study was supported by funding from the Netherlands-Mongolia Environmental Trust Fund. Without their support and encouragement, this study would not have been possible. We also wish to acknowledge and thank our field crew who not only looked after us but also assisted in collection of field information.
Front cover The cover photo was taken in mid-August, 2011 in the Semi-Desert ecozone of the South Gobi Region. In the photo, monitoring team members are evaluating a soil profile within an onion (Allium sp.) community that is in full-bloom following an earlier rainfall event.
Suggested citation for this document Sheehy, D., M. Hale, D. Damiran, T. Sheehy, D. Tsogoo, and Sh. Batsukh. 2012. Monitoring change on Mongolian rangelands. Final report for Netherlands-Mongolia Environmental Trust Fund for Environmental Reform (NEMO). 156 pp.
1
Sheehy, D., M. Hale, D. Damiran, T. Sheehy, D. Tsogoo, and Sh. Batsukh. 2012. Monitoring change on Mongolian rangelands. Final report for Netherlands-Mongolia Environmental Trust Fund for Environmental Reform (NEMO). 156 pp.
ACRONYMS AVHHR
Advanced Very High Resolution Radiometer
ESD
Ecological Site Description
GANL GLEWS GPS LANDSAT MODIS NDVI NIRS OAT
Grazing Animal Nutrition Laboratory Global Livestock Early Warning System Global Positioning System High Resolution Satellite Imagery Moderate Resolution Imaging Spectroradiometer Nominal Difference Vegetation Index Near-Infra Red Spectrometry Observed Apparent Trend
OT PZ
Oyu Tolgoi mine in the South Gobi Precipitation Zone
SEU SGR SPA SSF USDA
Sheep Equivalent Unit South Gobi Region Special Protected Area Soil Surface Factors United States Department of Agriculture
2
Sheehy, D., M. Hale, D. Damiran, T. Sheehy, D. Tsogoo, and Sh. Batsukh. 2012. Monitoring change on Mongolian rangelands. Final report for Netherlands-Mongolia Environmental Trust Fund for Environmental Reform (NEMO). 156 pp.
Executive Summary In our study we have addressed monitoring of Mongolian rangelands. Monitoring is a component of management and, as such, supports management decisions about use and improvement of rangelands. Information obtained through monitoring also supports rangeland planning. There are different techniques and methodologies available for rangeland monitoring, ranging from local-scale conventional rangeland monitoring to monitoring rangeland using high resolution satellite imagery. In our study, we established a study area in the South Gobi Region of Mongolia to demonstrate a variety of monitoring techniques. Our monitoring focused on 37 permanent rangeland monitoring sites that had been previously established during the Gobi Forage Project to develop a Mongolian Global Livestock Early Warning System (GLEWS). We also selected and described rangeland monitoring sites near the Oyu Tolgoi mine complex. Included in our demonstration of rangeland monitoring were monitoring techniques that had been used previously in other studies in the South Gobi Region. A major focus of the study was demonstrating rangeland monitoring techniques such as the Forage Growth (PHYGROW) Model and Low Resolution Satellite methods that monitor in near-real time. Although our study area had limited area, it did include portions of five steppe and desert ecozones. At each monitoring site, we used frequency transects to compare changes in vegetation condition with earlier measurements and describe topo-edaphic characteristics, described potential Ecological Site and assessed current Rangeland Health. We also used databases from the Forage Growth (PHYGROW) Model to detect impacts of climate change, especially drought, on steppe and desert ecosystems. We recommend establishment of a national rangeland monitoring program that utilizes Rangeland Health Assessment over multi-year time frames to determine condition of Ecological Sites, and also uses conventional rangeland monitoring techniques to annually assess impacts of large herbivore grazing on defined rangeland units. We also recommend incorporation of the Forage Growth (PHYGROW) Model in a national rangeland monitoring program.
Key Words: Mongolian rangelands, monitoring, rangeland health, and gobi desert.
3
Sheehy, D., M. Hale, D. Damiran, T. Sheehy, D. Tsogoo, and Sh. Batsukh. 2012. Monitoring change on Mongolian rangelands. Final report for Netherlands-Mongolia Environmental Trust Fund for Environmental Reform (NEMO). 156 pp.
Monitoring Change on Mongolian Rangelands Table of Contents 1. Introduction 1.1 Monitoring Rationale 1.2 Study Goal and Objectives 1.3 Study Area Characteristics 1.4 Livestock 1.5 Large Wild Herbivores
2. Methods 2.1 Monitoring Site Selection 2.2. Monitoring Techniques 2.3 Rangeland Survey Methods 2.4 Monitoring Rangeland Health 2.5 Monitoring Rangeland Carrying Capacity 2.6 Monitoring Climate Change 2.7 Monitoring Annual Rangeland Utilization 2.8 Statistical Analysis
3. Monitoring Rangeland Habitat 3.1 Classification of Monitoring Sites 3.2 Soil Characteristics 3.3 Erosion Potential 3.4 Plant Species Composition 3.5 Community Similarity. 3.6 Vegetation Types 3.7 Vegetation Yield 3.8 Preliminary Ecological Site Descriptions 3.9 Preliminary Rangeland Health Assessment
4. Monitoring Rangeland Use 4.1 Large Herbivore Population Trends 4.2 Large Herbivore Use of Rangeland 4.3 Monitoring Large Herbivore Use of Rangeland Habitat 4.4 Monitoring Regional Grazing Impacts.
5. Monitoring Rangeland Condition 5.1 Forage Growth (PHYGROW) Model 5.2 Calculating Rangeland Carrying Capacity
5.3 Near-Real Time 5Carrying Capacity 5.4 Adjusted Carrying Capacity 5.5 Calculating Carrying Capacity for a Rangeland Management Unit
5.5 Monitoring Rainfall Impacts on Forage Growth 5.6 Monitoring Nutritional Carrying Capacity 5.7 Climate Change Monitoring
4
Sheehy, D., M. Hale, D. Damiran, T. Sheehy, D. Tsogoo, and Sh. Batsukh. 2012. Monitoring change on Mongolian rangelands. Final report for Netherlands-Mongolia Environmental Trust Fund for Environmental Reform (NEMO). 156 pp.
6. Conclusions 6.1 Monitoring Rationale 6.2 Monitoring Conclusions 6.3 Rangeland Monitoring 6.4 National Monitoring Framework 6.5 Economic Infrastructure Development
References Annexes
5
Sheehy, D., M. Hale, D. Damiran, T. Sheehy, D. Tsogoo, and Sh. Batsukh. 2012. Monitoring change on Mongolian rangelands. Final report for Netherlands-Mongolia Environmental Trust Fund for Environmental Reform (NEMO). 156 pp.
List of Figures Figure 1. Zonal distribution of land cover types in the South Gobi Region (Source: ICAPS, 2009). Figure 2. Transect boundaries of the South Gobi Region study area (Source: ICAPS, 2011). Figure 3. Annual cumulative rainfall occurring in ecozones of the study area (Source: ICAPS, 2012).
Figure 4. PHYGROW monitoring points within classified ecological zones and eco-types (Source: C.M. Sheehy, 2012). Figure 5. Characteristics of a South Desert ecozone soil profile near the Oyu Tolgoi mine complex. (Source: D. Damiran, 2011). Figure 6. Plant species similarity between 2005 and 2011 in the Southern Gobi Region (Source: D. Damiran, 2012). Figure 7. Site attributes characteristic of study area vegetation types (Source: D.P. Sheehy, 2012). Figure 8. Vegetation yield (kg/ha) at 37 study area monitoring sites (Source: D.P. Sheehy, 2012). Figure 9. Total livestock numbers in 11 study area soums over a 10 year period (Source: D.P. Sheehy, 2012). Figure 10. Study area livestock numbers in sheep equivalent units (SEU) (Source: D.P. Sheehy, 2012). Figure 11. Tracks of livestock herded by three cooperating herders in SW Dornogov aimag (Source: C.M. Sheehy, 2007). Figures 12 & 13.Influence of water source on livestock grazing management strategies. Left figure reflects herder dependence on water from wells. Right figure reflects herder dependence on water from ponds. (Source: C.M. Sheehy, 2007). Figure 14. Different livestock (grey dots) and Wild Ass (colored dots) grazing strategies in SW Dornogov aimag (Source: D.E. Johnson, 2007). Figure 15. Seasonal MCPs of rangeland area with observed use by collared khulan (summer=green, winter=blue) during 2005 and 2006 (Source: C.M. Sheehy, 2007). Figure 16 & 17). The left figure shows small stature shrub/bunchgrass habitat found on higher elevation plateaus and hill ranges. The right figure shows tall shrub habitat found in low elevation valleys and depressions (Source: D. Damiran, 2008). Figure 18. Seasonal MCPs of rangeland area (summer=green, winter=blue) with observed khulan use along a vehicular transect during 2006 and 2007 (Source: C.M. Sheehy, 2008). Figure 19. Seasonal MCPs of rangeland area with observed khulan use between 2005 and 2007 (Source: C.M. Sheehy, 2008).
6
Sheehy, D., M. Hale, D. Damiran, T. Sheehy, D. Tsogoo, and Sh. Batsukh. 2012. Monitoring change on Mongolian rangelands. Final report for Netherlands-Mongolia Environmental Trust Fund for Environmental Reform (NEMO). 156 pp.
Figure 20. Gazelle observed grazing in an Allium community in the Semi-Desert Steppe ecozone during late summer 2011. Note Allium plants on gravelly soils in the center-foreground of the photograph (Source: D. P. Sheehy, 2012 Figure 21. Simulated forage patches created by a limited-scale precipitation event characteristic of Desert ecozones (Source: C.M. Sheehy, 2008). Figure 22. Khulan (colored dots) and livestock late summer foraging locations in the SGR (Source: Oregon State University, 2006). Figure 23. Average MODIS-NDVI values of study area rangeland between July and December 2005 (Source: D.E. Johnson, 2006). Figure 24. Khulan positions relative to forage condition (i.e., greenness) in early July 2005 (Source: D.E. Johnson, 2006). Figure 25. Khulan positions in the study area relative to NDVI identified greenness in summer and fall, 2005 (Source: D.E. Johnson, 2006).
Figure 26. Comparison of NDVI values randomly selected in the study area with NDVI values at Khulan locations in summer and fall, 2005 (Source: D.E. Johnson, 2006). Figure 27. Livestock selection of foraging areas relative to NDVI “greenness” index in July and August, 2005 (Source: D.E. Johnson, 2006). Figure 28, Integration of imagery and modeling in the Forage Growth (PHYGROW) model (Source: Stuth and others, 2003). Figure 29. Annual forage growth curve showing positive and negative forage growth projections (Source: Stuth and others, 2003). Figure 30. Photograph of rangeland habitat in the Dry Steppe ecozone of Dundgov aimag in late August, 2011 (Source: D. Damiran, 2012). Figure 31. A twelve year profile of annual forage yield at the monitoring point (DG-07). (Source: Forage Growth (PHYGROW) Model, http://glews.tamu.edu/Mongolia). Figure 32. Projected bi-weekly forage (kg/ha) available in early September, 2011 throughout the Gobi Region (Source: http://glews.tamu.edu/Mongolia). Figure 33. A twelve year profile of annual forage yield at the monitoring point (DG-07). (Source: http://glews.tamu.edu/Mongolia). Figure 34. Annual cumulative precipitation by season in the SGR (Source: D.P. Sheehy, 2007). Figure 35. Seasonal cumulative precipitation in the SGR between 2005 and 2007. (Source: D.P. Sheehy, 2008).
7
Sheehy, D., M. Hale, D. Damiran, T. Sheehy, D. Tsogoo, and Sh. Batsukh. 2012. Monitoring change on Mongolian rangelands. Final report for Netherlands-Mongolia Environmental Trust Fund for Environmental Reform (NEMO). 156 pp.
Figure 36. Dietary quality of co-grazing large herbivores in the SGR during summer 2005) (Source: D.P. Sheehy, 2008). Figure 37. The NDVI threshold boundary (dotted line) between equilibrium and non-equilibrium ecosystems (Source: Okayasu and others, 2011). Figure 38. The NDVI threshold boundary (dotted line) between equilibrium and non-equilibrium ecosystems (Source: Okayasu and others, 2011). Figure 39. Divergence from normal forage growth at four times (90, 181, 273, and 365 days) during an annual forage growth cycle (Source: D.P. Sheehy, 2012). Figure 40. Divergence from normal seasonal forage growth (90, 181, 273, and 365 days) during an annual forage growth cycle (Source: D.P. Sheehy, 2012). Figure 41. Annual peak forage growth in the five study area ecozones (Source: D.P. Sheehy, 2012). Figure 42. Annual peak forage yield in the five study area ecozones (Source: D.P. Sheehy, 2012). Figure 43. Route of proposed railroad through the SGR and Eastern Steppe region of Mongolia. (Source: MIAT Mongolian Airlines In-flight Magazine, 2012
8
Sheehy, D., M. Hale, D. Damiran, T. Sheehy, D. Tsogoo, and Sh. Batsukh. 2012. Monitoring change on Mongolian rangelands. Final report for Netherlands-Mongolia Environmental Trust Fund for Environmental Reform (NEMO). 156 pp.
List of Tables Table 1. Livestock numbers between 1999 and 2010 in soums of the study area. Table 2. Partial census (2003) of large wild herbivores populations using rangeland of Dornogov aimag. Table 3. Monitoring techniques with application to Mongolian rangelands. (Source: Sheehy and Johnson, 1994 Table 4. Similarity index of plant species measured in 2005 and 2011 in the three SGR aimags Table 5. Average frequency and yield of site attributes characteristic of plant communities measured in the study area. Table 6. Ecological Sites in the SGR study area. Table 7. Rangeland Health Assessment of study area monitoring sites. Table 8. Impact of annual large herbivore utilization on rangeland habitat in five ecozones. Table 9. Seasonal carrying capacity of rangeland habitat at the DG-07 monitoring site during 2011. Table 10. Adjusted carrying capacity of rangeland in Tsagaandelger soum of Dundgov aimag.
9
Sheehy, D., M. Hale, D. Damiran, T. Sheehy, D. Tsogoo, and Sh. Batsukh. 2012. Monitoring change on Mongolian rangelands. Final report for Netherlands-Mongolia Environmental Trust Fund for Environmental Reform (NEMO). 156 pp.
Monitoring Change on Mongolian Rangelands I. Introduction A general consensus has developed among herders, government officials, donor institutions, and the public that Mongolian rangeland is degrading from a combination of overuse, especially livestock grazing, and weather events related to climate change. This consensus has developed even though a major focus of government and donor interventions in the Mongolian rural areas has been to improve Mongolian rangelands that support rural livelihoods. Programs and projects have invested millions of dollars to improve social-economic conditions of rural areas, mitigate pastoral risk, develop and support innovative rural credit and insurance programs, establish and support pasture user groups, and implement pastureland improvement, management and monitoring programs. Empirical evidence of the extent, degree, and nature of rangeland condition is limited, and evaluations of the effectiveness of livestock and pasture interventions has been weak. Most indicators were oriented towards an evaluation of outputs (i.e., training exercises, group organization, etc.) rather than primary impacts such as change in rangeland condition and impacts of climate change. These indicators are too difficult or time consuming to monitor, and institutions may lack the capacity to effectively measure the attributes and interpret the results. Therefore, despite claims that various projects and programs have had a positive impact on rangelands, there is growing evidence that rangeland degradation has, and is, occurring, and that rural livelihoods are at risk. Already people are being forced to leave their herding lifestyle to look for new opportunities in urban areas or in mining. Out of Mongolia’s 2.5 million people about 2 million now live in urban areas. 1.1 Monitoring Rationale There is a critical need in Mongolia for relevant and practical monitoring of rangelands. Without monitoring, national policies and programs designed to improve herder’s capacity to respond to pastoral risk will be ineffective (Sheehy, 1996; Sheehy et al. 2006; Sheehy et al. 2011). Monitoring rangelands is important for many reasons, including:
There are many different policy, institutional and investment interventions which have or are being implemented in rural Mongolia which aim to positively impact sustainable use of rangelands. Government (local and national), donors, and herder communities need to assess which types of intervention have the most benefit to rangeland at the least cost. This type of evidence-based policy making needs to be underpinned by reliable data.
The development of extractive industries throughout Mongolia, especially legal and illegal mining at various scales, and the infrastructure supporting large-scale mining, has important ramifications for rangeland. Monitoring of these activities before, during, and after the intervention is necessary to allow policy and institutional interventions to regulate and prevent destruction of critical rangeland habitats.
There is mounting evidence that Mongolia is suffering from long-term trends in climate change (Ouyntuya et al. 2009) which are having a detrimental impact on rangeland health (Ariunsuren et al. 2008). An accurate picture of the speed and nature of these changes is vital to developing a policy agenda for adapting to climate change and improving the resilience of herder communities.
10
Sheehy, D., M. Hale, D. Damiran, T. Sheehy, D. Tsogoo, and Sh. Batsukh. 2012. Monitoring change on Mongolian rangelands. Final report for Netherlands-Mongolia Environmental Trust Fund for Environmental Reform (NEMO). 156 pp.
Real time information on rangeland use has potential applications to help herder and local authority decision making, including the allocation of rangeland resources or the movement of animals.
Accurate and reliable information on rangeland condition could be an important policy tool in Mongolia. For example, the concept of pasture user fees is currently being discussed in the National Livestock Program and the concept of performance based grants (or maybe discounts) is developing based on herder group commitments to improve use of rangeland. Cost effective measures of rangeland condition would support such an approach.
Techniques to evaluate rangeland condition or distinguish between man-caused disturbance and natural disturbance have not been evaluated in the Mongolian context. Projects and programs designed to provide solutions to long term, wide-spread natural resource use problems have been ineffective in the face of the prevailing incentive structure and market failures that encourage herders to overstock.
Monitoring is a key element of rangeland management that is generally used to evaluate success or failure of strategies to achieve objectives of management. Longer-term monitoring uses multi-year assessments and comparison techniques such as Rangeland Health Assessment and Condition and Trend Analysis. Both techniques identify change in rangeland over time but Rangeland Health Assessment is not designed to: i) identify the cause of resource use problems, ii) independently make grazing and other management changes, iii) monitor land use directly or determine trend, or iv) independently generate national or regional assessments of rangeland condition (Pellant and others, 2005; Damiran et al. 2007; Damiran et al. 2008). Short-term and special purpose rangeland monitoring techniques are used to monitor impacts of annual or seasonal grazing on rangeland management areas, or directly monitor large herbivore grazing strategies during annual cycles to provide information supporting rangeland management decisions. The latter type of monitoring at local scale is an important component of rangeland management. 1.2 Study Goal and Objectives Mongolia has not had an active rangeland management and monitoring program in place and operating since at least 1990, although rangeland monitoring has occurred on a limited, project specific basis (Asian Development Bank, 1997). The goal of this study was demonstration of rigorous rangeland monitoring that are capable of monitoring rangeland ecological condition, habitat use by large herbivores, and climate change impacts on rangeland in both short and long-term timeframes. Objectives of this study were: i) Demonstrate techniques that can be used to monitor Mongolian rangelands. ii) Develop a feasible and efficient rangeland monitoring system that can:
Evaluate changes in rangeland vegetation and soils associated with large herbivore use; Evaluate impacts of pastoral livestock production on rangeland condition; Evaluate changes to rangeland habitats associated with economic infrastructure development and climate change.
1.3 Study Area Characteristics
11
Sheehy, D., M. Hale, D. Damiran, T. Sheehy, D. Tsogoo, and Sh. Batsukh. 2012. Monitoring change on Mongolian rangelands. Final report for Netherlands-Mongolia Environmental Trust Fund for Environmental Reform (NEMO). 156 pp.
The study area for demonstrating rangeland monitoring techniques was located in the South Gobi Region (SGR). This area was selected as the study area because: i) it is the zone of intersection between Desert and Grass Steppe ecosystems, ii) many national and international development projects are established in the region, especially mining and infrastructure development, iii) both the 2000/01 and 2009/10 severe winters (Mon. dzud) severely affected the region, and iv) the region is reported as becoming increasingly arid as climate change occurs. Rangelands in the Dry Steppe ecozone are considered to be especially susceptible to climate change induced degradation (Figure 1).
Figure 1. Zonal distribution of land cover types in the South Gobi Region (Source: ICAPS, 2009). Monitoring Transect. In 2011, we established a monitoring transect in the SGR that included rangeland habitats characteristic of steppe and desert ecosystems. The transect route partially included 11 suoms of Dundgov, Dornogov, and Omnigov aimags, which together comprise the South Gobi Region (Figure 2.). The study area was bounded by 42.72695 and 46.63862 latitude and 107.02778 and 109.78427 longitude. Field data was collected in the study area between August 15 and 30, 2011.
12
Sheehy, D., M. Hale, D. Damiran, T. Sheehy, D. Tsogoo, and Sh. Batsukh. 2012. Monitoring change on Mongolian rangelands. Final report for Netherlands-Mongolia Environmental Trust Fund for Environmental Reform (NEMO). 156 pp.
Figure 2. Transect boundaries of the South Gobi Region study area (Source: ICAPS, 2011). Study Area Environment. Rangeland in the study area had different attributes that interactively affect use by large domestic and wild herbivores. Predominant characteristics of study area rangeland were topographic land-form reflecting aspect, elevation, and slope; vegetation types and plant communities associated with land-form and soils; availability of drinking water, and the presence of humans. Rangeland was characterized by ephemeral water courses, small freshwater ponds, dissected, rocky hill ranges, and shrub steppe plains. Herder camp positions were usually associated with freshwater ponds and wells. Land Cover Zones. Five major land cover (i.e., ecozones) were included in the study area. The SemiDesert and Dry Steppe ecozone formed the northern edge of the study area in Dundgov and Dornogov aimags. The more mesic Semi-Desert and Steppified Middle Desert zones surrounded the increasingly arid and lower elevation South Desert ecozone. The True Desert zone was located as inclusions throughout the study area. Vegetation Types. A diversity of vegetation types ranging from gravel plains dominated by herbaceous onion (Allium sp.) and graminoid communities to large-stature shrub (Haloxylon sp.) communities in desert valleys are found on the study area. At least 21 different vegetation types comprised rangeland habitat in Steppe and Desert ecozones. Weather.. Weather patterns were variable throughout the study area. Generally, temperature and precipitation were highest throughout the study area during the summer. Most precipitation coincides with, and initiates, vegetation growth in all ecozones of the study area (Figure 3).
13
Sheehy, D., M. Hale, D. Damiran, T. Sheehy, D. Tsogoo, and Sh. Batsukh. 2012. Monitoring change on Mongolian rangelands. Final report for Netherlands-Mongolia Environmental Trust Fund for Environmental Reform (NEMO). 156 pp.
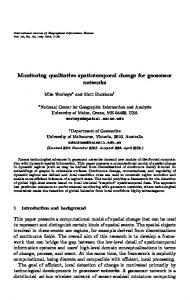
Average Zonal Precipitation 14.00 12.00
cm.
10.00 8.00
Series1
6.00 4.00 2.00 0.00 S-D Steppe
N. Desert
Dry Steppe
S. Desert
M.Desert (S)
Ecozones
Figure 3. Annual cumulative rainfall occurring in ecozones of the study area (Source: ICAPS, 2012). Study area precipitation varies annually and between years. Between 1999 and 2005, the study area received higher cumulative precipitation than between 2006 and 2009. However, the Semi-Desert and Dry Steppe ecozones consistently receive higher precipitation than Desert ecozones. 1.4 Livestock In 2010, total livestock numbers present in the 11 study area soums was 860,000 head, Livestock grazing rangeland of the study area were goats, sheep, cattle, horse, and camel (Table 1)
Table 1. Livestock numbers between 1999 and 2010 in soums of the study area. Soum/Year 2000 2002 2004 2006 2008 2010 Hanbogd 69296 52760 62256 71285 102456 96084 Manlai 76674 78985 79063 82238 108380 72224 Bayanjargalan 56408 60458 76913 69731 63966 62272 Tsagaandelger 80171 42967 55866 65503 64252 42816 Ulziit 103495 130411 135679 126891 137495 85413 Undershil 52877 59066 86461 63369 65003 73678 Airag 73615 67928 84364 51370 60315 68008 Dalanjargalan 98901 69156 84711 71938 82688 82383 Hatanbulag 102175 86924 122830 116372 160106 148972 Mandah 69870 71015 74108 47033 58763 64857 Saihandulan 63321 65615 79396 37084 50811 63362 Total 846803 785285 941647 802814 954235 860069 Total livestock numbers in 2010 were slightly higher than total livestock numbers in 2000. In 2010, there was 860069 head of livestock while in 2000 there was 846803 head of livestock. The difference represented 13266 head of livestock, or an increase of 1.5 % in 2010 compared to 2000.
14
Sheehy, D., M. Hale, D. Damiran, T. Sheehy, D. Tsogoo, and Sh. Batsukh. 2012. Monitoring change on Mongolian rangelands. Final report for Netherlands-Mongolia Environmental Trust Fund for Environmental Reform (NEMO). 156 pp.
1.5 Large Wild Herbivores The large wild herbivore population until recently had been comparatively high. Major large wild herbivores found in the study area were the Asiatic Wild Ass, gazelle, bighorn sheep, and ibex. Human intrusion in the form of legal and illegal hunting and mining has substantially impacted all populations of large wild herbivores (Table 2).
Table 2. Partial census (2003) of large wild herbivores populations using rangeland of Dornogov aimag Soum Mandakh Saihandulan Ulaanbadrakh Khatanbulag Khovsgul Erdene Total
Khulan 700 300 600 4000 6288 550 12438
Argali 40
30
70
Ibex 60 50 120 80 472 78 860
Dornogov aimag had an approximate population of over 12,000 khulan and 1000s of gazelle. The July 20, 2003 census found that six suoms in the SGR had highest numbers of large wild herbivores (Personal Communication, Environmental Inspector, Dornogov Province, 2007). The current population of wild herbivores on the study area is unknown.
Methods 2.1 Monitoring Site Selection For our study of rangeland monitoring, we selected 25 previously established Forage Growth (PHYGROW) Model sites in the South Gobi Region, plus we established 13 new sites near the Oyu Tolgoi (OT) mine complex. The Forage Growth monitoring sites had been randomly selected in 2005/06, while we used a stratified random process within distinguishable landforms to select the 13 OT sites. We
defined our study area as the Minimum Convex Polygon (MCP) containing all monitoring points. A 1200 km-long vehicular transect between PHYGROW monitoring points defined the boundary of our study area (Figure 4).
15
Sheehy, D., M. Hale, D. Damiran, T. Sheehy, D. Tsogoo, and Sh. Batsukh. 2012. Monitoring change on Mongolian rangelands. Final report for Netherlands-Mongolia Environmental Trust Fund for Environmental Reform (NEMO). 156 pp.
Figure 4. PHYGROW monitoring points within classified ecological zones and eco-types (Source: C.M. Sheehy, 2012). Field data collection activities for demonstrating monitoring techniques focused on: i) twenty-four PHYGROW monitoring sites located in Dundgov, Dornogov, and Omnigov aimags, ii) thirteen newly selected monitoring sites near the Oyu Tolgoi mine complex, and iii) 124 large wild herbivore inventory sites along the vehicular transect that traversed the study area (Annex 1a). The previously identified
sites allowed us to measure and compare site attributes first measured in 2005/06, while the new sites facilitated future monitoring and assessment of mining impacts on rangeland adjacent to the mining complex Data on vegetation and animal use that was recorded along the vehicular transect were numbers and presence of large wild herbivores. Transect derived information was used preliminarily to describe rangeland habitat occurring across the study area, relate sites to zonal vegetation types developed by the Russian-Mongolian Complex Ecological Survey (1997), and relate large wild herbivore selection of habitat to forage conditions. The transect perimeter formed a Minimum Convex Polygon that defined the study area (US Interagency Technical Reference, 1999). 2.2. Monitoring Techniques Our study was designed to evaluate rangeland monitoring techniques that have application in developing a Mongolian Rangeland Monitoring System (Table 3).
16
Sheehy, D., M. Hale, D. Damiran, T. Sheehy, D. Tsogoo, and Sh. Batsukh. 2012. Monitoring change on Mongolian rangelands. Final report for Netherlands-Mongolia Environmental Trust Fund for Environmental Reform (NEMO). 156 pp.
Table 3. Monitoring techniques with application to Mongolian rangelands. (Source: Sheehy and Johnson, 1994 Data Source
Low Resolution Satellite National & Regional Spectrally Derived Vegetation Indices
High Resolution Satellite National & Regional Spectrally Derived Indices
Conventional Rangeland Survey
Geographic
Meteorological
Regional & Local
Regional & Local Geographic Information Analysis, Global Positioning System
National & Regional
Purpose
Monitoring in Near-Real Time
Monitoring in Near-Real Time
Double Sampling, Vegetative Yield, Vegetative Cover, Condition & Trend, Range Health Assessment
Study
NDVI
Landsat-3D
Frequency, Soil Analysis, Vegetation Classification
Use Scale Technique
Permanent Plots
Vegetation/Meteorol ogical Growth Models
Spatial Precipitation Models, Animal Nutrient Demand Models
GPS Locational Data, R-M Vegetation Map Digitization
Forage Growth (PHYGROW) Model
Although a national rangeland monitoring system is not currently functional, a number of monitoring techniques have been applied to measure large herbivore grazing impacts on rangelands. These techniques used low and high resolution satellite imagery (national and regional scales), high resolution aerial photography (local scale), conventional rangeland survey (local scale), geographic information systems (regional and local scales), and meteorologically driven vegetation growth models (national and regional scales). 2.3 Rangeland Survey Methods Between August 15 and 31, 2011, vegetation and soil attributes were measured at the 38 monitoring sites. Frequency, forage yield, and landscape attributes were used to describe above ground characteristics of the monitoring sites. We described ground surface and belowground site attributes by evaluating characteristics of the soil profile. Frequency analysis and vegetation yield analysis allowed us to compare current vegetation status with vegetation status at the time of initial measurement. Vegetation yield itself had a direct link to the forage databases in the Forage Growth (PHYGROW) Model. Conventional rangeland survey methods used in our study included:
Plant frequency. Measurements of plant presence was made at 50 points along a 100 meter transect. Information on current plant presence was compared with plant presence obtained during the initial 2005/06 measurement of the site.
Forage yield. Graminoids, forbs, and shrubs were harvested from 10 plots (0.5 m2) at each monitoring point. Harvested vegetation was separated by growth form, dried and weighed
17
Sheehy, D., M. Hale, D. Damiran, T. Sheehy, D. Tsogoo, and Sh. Batsukh. 2012. Monitoring change on Mongolian rangelands. Final report for Netherlands-Mongolia Environmental Trust Fund for Environmental Reform (NEMO). 156 pp.
Soil Inventory. Soils characteristics of each permanent monitoring site were determined by digging a soil pit to a one meter depth or impermeable restrictive layer at each monitoring point. The purpose of the inventory was to collect soil and other information at previously established permanent geographic data points. Using standard United States Department of Agriculture (USDA) terminology, soil horizons were identified and delineated. Properties described were horizon type and thickness, texture, color, ph, roots, structure, coarse fragments, evidence of a pan, mineral concretions or nodules and the boundary between each horizon. Other data included slope and aspect and a general landscape description with a sketch and photos of the soil profile and general landscape. A total of 32 profiles were described in detail.
Ocular Assessment An ocular assessment of current ecological condition was made at each monitoring site. The Landscape Appearance index for rating large herbivore utilization was used to rate livestock grazing impacts on the area surrounding the monitoring point. Monitoring sites were photographed to establish an ocular record of soil and vegetation condition at the monitoring site.
Soil and Vegetation Classification. Mongolian rangeland had previously been separated into distinct ecozones of steppe and desert. Steppe ecozones included dry and semi-desert steppe. Sub zones in desert included north desert (semi-desert), middle desert (steppified desert) and south desert (true desert). Monitoring site locations were referenced to the 1996 Russian-Mongolian Complex Ecological Survey of zonal land/vegetation classes (Annex 2).
Non-Conventional rangeland survey methods demonstrated in our study were: Low Resolution Satellite Imagery. Nominal Difference Vegetation Index (NDVI) was used to relate forage quality to Asiatic Wild Ass (Mon. Khulan) selection of forage sites in the SGR and is currently being used to determine bi-weekly changes in forage growth throughout the Gobi Region in the Forage Growth (PHYGROW) model. Geographic. Geographic Positioning System (GPS) have been used to record locations of collared wildlife and livestock and record location of non-collared wildlife encountered in observation transects. The use of GPS and NDVI imagery to evaluate Khulan and livestock use of rangeland forage habitat was described in this paper. Rangeland Condition Surveys. Data obtained from conventional rangeland survey methods was used to establish current condition of Mongolian rangelands in the study area. The information facilitated preparation of preliminary Ecological Site Descriptions (ESD) and Rangeland Health Assessments (RHA). Condition (Similarity) and Trend assessment was applied to four ecozone study areas in a separate study that measured sites established in 1997 (Sheehy and Damiran, In Review). Meterological. Conventional rangeland monitoring applications of the Forage Growth (PHYGROW) Model were also demonstrated in this study (Stuth and others, 2003). Data obtained from historical databases of the Forage Growth (PHYGROW) model was used to assess carrying capacity and climate change impacts on study area rangeland. 2.4 Monitoring Rangeland Health Preliminary Ecological Site Description. Ecological Sites provide base information for Rangeland Health Assessment (RHA). The process of developing Ecological Sites requires field reconnaissance, vegetation and soil inventory, analysis and interpretation, and description of sites. Site descriptions can be used by managers and users to modify current use according to information derived from the Ecological Site.
18
Sheehy, D., M. Hale, D. Damiran, T. Sheehy, D. Tsogoo, and Sh. Batsukh. 2012. Monitoring change on Mongolian rangelands. Final report for Netherlands-Mongolia Environmental Trust Fund for Environmental Reform (NEMO). 156 pp.
At each of the selected monitoring sites, an ecological site was defined relative to specific potential natural community and specific physical site characteristics. Each Ecological Site differs from other kinds of land in its ability to produce vegetation and to respond to management (National Range and Pasture Handbook 2003). Qualitative description of rangeland vegetation communities was arranged into ecological mapping units comprised of similar ecological sites determined by qualitative and quantitative measurements. A hierarchy of information was used to differentiate and describe ecological sites. A beginning reference was the 1995-96 Mongolian-Russian Complex Ecological Survey Map. Plant frequency; biomass yield; soil profile descriptions; and photographs of soil profiles, landscapes, and ground cover plots were collected at each site. An ecological site inventory was completed following prescribed methods (U.S. Bureau of Land Management Technical Reference1734-71) . The inventory is a qualitative assessment within a distinct and recognizable ecological site that includes:
Estimates of percent foliar cover and percent ground cover attributes of all plant species.
Forty year historical average rainfall, historic average temperature and standing herbaceous yield on a per species basis provided by the Global Livestock Early Warning System (GLEWS) Mongolia database website2 were also referenced.
Plant species presence or absence over time was determined by frequency data collected at each site in 2005 and again 2011. Frequency data does not directly correlate with percent foliar cover, but the data provided a broader species list which assisted in the qualitative ecological assessment.
Within each major and sub zone, distinguishable factors to determine distinct ecological sites were: landform; elevation; precipitation zone; soil depth and characteristics; and plant species, present in dominance or as a remnant species in a success ional state. Google Earth maps and site photographs were used to distinguish landscape features and compare individual sites.
The accumulated information helped determine site potential and develop ecological site descriptions with the understanding that the site descriptions will evolve as more information becomes available. Data utilized from measurements at each monitoring site included:
Ground cover percent of Lichen (L), Moss (M), Litter (LT), Plant basal cover (PC), Stones, larger than 250 cm (ST), Cobbles, between 8 and 250 cm (CB), Gravel, between sand size fraction and 8 cm, GR and Bare ground (BG), where all fractions equal 100% and “T” equals trace amounts less than 0.5%.
Observed apparent trend (OAT) and soil surface factors (SSF) that included a three level gradient of upward to stable to downward trend assessing plant vigor, seedling viability and presence of surface litter, pedestals and gullies,
SSF indicators to assess soil erosion risk on a five level gradient, i.e. stable, slight, moderate, critical and severe.
19
Sheehy, D., M. Hale, D. Damiran, T. Sheehy, D. Tsogoo, and Sh. Batsukh. 2012. Monitoring change on Mongolian rangelands. Final report for Netherlands-Mongolia Environmental Trust Fund for Environmental Reform (NEMO). 156 pp.
Rangeland Health Assessment. The concept of rangeland health is promoted as an alternative to methods that evaluate rangeland condition (National Research Council 1994). Rangeland Health assesses ecological processes such as integrity of soils, vegetation and water in the ecosystem. Qualitative and/or quantitative comparison of rangeland health is obtained periodically at fixed, permanent locations or reference areas. Measurement sites are selected based on random procedures at fixed permanent locations to determine indicators of Soil/Site Stability, Hydrologic Function, and Biotic Integrity. Evaluators must be able to recognize and correctly identify ecological sites because evaluations are made relative to an ecological site or reference area. Knowledge of the potential range of variability and landscape relationships is required to interpret evaluations. Changes to soil/site stability, hydrologic function and biotic integrity at evaluation sites are determined through periodic monitoring (3-5 years) and are used to determine how well ecological processes are functioning. (Pellant and others, 2005). At each monitoring site, prescribed quantitative data accompanied by a qualitative assessment of rangeland condition was collected. Rangeland Health was assessed at each monitoring point. The 38 permanent monitoring points were used to develop an index of rangeland health by Ecological Site and average Rangeland Health for the study area. Temperature, precipitation, and productivity databases developed by PHYGROW at each monitoring point were used to assist interpretation of Rangeland Health at the site and develop ESD concepts. 2.5 Monitoring Rangeland Carrying Capacity In 2004/06, the Gobi Forage Project (Global Livestock-Cooperative Research Studies Project) established rangeland monitoring sites in the study area to sample vegetation and soil attributes. Information collected provided databases for the PHYGROW Forage Growth Model (Stuth and others, 2003).. PHYGROW uses the geostatistical technique of co-krigging to estimate regional effects of weather (i.e., temperature, precipitation, and solar radiation) on forage production in non-sampled areas between monitoring points. NDVI, which provides a measure of green biomass on the ground as viewed by AVHHR satellite to cover the larger spatial area, interpolates forage responses in the interstitial space between monitoring points. PHYGROW translates greenness data associated with each monitoring point into maps of forage standing crop (Angerer et al. 2001) and forage deviation from normal. PHYGROW integrates low resolution satellite imagery (NDVI), weather data, and conventional rangeland survey methods into a forage growth model that provides bi-weekly estimates of forage growth at regional scales. Outputs from the Forage Growth (PHYGROW) Model were: i) spatial images showing bi-weekly estimates of forage growth (kg/ha), ii) derivation from normal forage growth (i.e., a spatial aridity or drought index if the area has less than or greater than normal forage growth), and iii) and amounts of forage produced annually that is preferred by different livestock grazers. PHYGROW accounts for differential preferences of mixed populations of large herbivores and models growth of individual plant species or functional groups of species competing for vegetation resources under selective grazing. Each monitoring site is then run for the 50-years and daily percent deviation and percentile ranking is determined for each day based on a “day of year” average standing crop of forage usable by a target herbivore (e.g., cattle, sheep, goats, horses, khulan, and gazelle). 2.6 Monitoring Climate Change Values of pastureland attributes (i.e., vegetation, soils, temperature, precipitation, and productivity) measured to develop PHYGROW databases at each monitoring point were statistically compared with values of rangeland attributes obtained during initial PHYGROW measurements to determine if attributes had changed significantly. Comparison of attributes provided pasture trend information relative to climate
20
Sheehy, D., M. Hale, D. Damiran, T. Sheehy, D. Tsogoo, and Sh. Batsukh. 2012. Monitoring change on Mongolian rangelands. Final report for Netherlands-Mongolia Environmental Trust Fund for Environmental Reform (NEMO). 156 pp.
and utilization impacts on the study area. The key variables evaluated to determine the impact of increasing aridity on rangeland forage were precipitation and forage growth over an 11-year interval. Annual forage growth at four key calendar dates was compared with cumulative precipitation at those four dates. The maximum forage growth point on the annual growth curve was evaluated relative to the PHYGROW drought index to determine the impact of increasing aridity on rangeland of the SGR. 2.7 Monitoring Annual Rangeland Utilization The Landscape Appearance Technique employs conventional rangeland survey methods to monitor impacts of livestock grazing on rangeland. During our study, we modified the procedures of the Landscape Appearance /Key Forage Area method to determine livestock grazing impacts on rangeland vegetation at each monitoring site. The technique uses frequency measurement of vegetation along a permanent transect, and an ocular estimate of forage utilization based on the general appearance of the selected key forage areas and key forage plants in grazed seasonal pastures. The method is adapted to areas where perennial grasses, forbs, and/or browse plants are present and to situations where utilization data must be obtained over large areas using only a few examiners. Estimates are compared to an index of utilization to determine allowable utilization by the grazing animal. Estimating grazing utilization provides a rapid evaluation of how key habitat areas were used, the timing and duration of use, and the relative amount of soil moisture or plant growth occurring during the year. The monitoring technique combines large herbivore management with real-time decision-making relative to rangeland carrying capacity and appropriate stocking rate. Each monitoring point was rated as to condition by combining qualitative assessments of general landscape appearance and grazing utilization with the quantitative assessment made at each permanent monitoring point. 2.8 Statistical Analysis
Similarity Analysis (Morisita, 1959) and Correlation Analysis (Neter and others, 1983) were used to analyze selected data derived by the monitoring study.
3. Monitoring Rangeland Habitat 3.1 Classification of Monitoring Sites Monitoring sites in Steppe ecozones were located in the northern portion of the MCP comprising the study area. Four sites in soums of Dornogov (i.e., Airag, Saikhandulan, and Dalanjargalan) and Dundgov (Bayanjargalan and Tsagaandelger) aimags were classified as Steppe ecozones. Desert monitoring sites were primarily in the southern portion of the MCP comprising the study area. Five sites were in soums of Dornogov aimag (Khatenbulag, Mandakh, and Saikhandulan), three sites were in one Dundgov soum (Undurshil), and 21 sites were in soums of Omnigov aimag (Khanbogd and Manlai). GPS coordinates of each monitoring site in the study area were located on a geo-referenced vegetationtype map compiled by the Mongolian-Russian Complex Ecological Survey of 1995-96 (Annex 1b). Eight monitoring sites were assigned to Steppe ecozones (i.e., Semi-Desert Steppe and Dry Steppe) and 29 sites were assigned to four Desert ecozones (i.e., Desert, Steppified Middle Desert, North Desert, and South Desert). 3.2 Soil Characteristics The study area contained a variety of geologic formations and soils. These topo-edaphic attributes influence ground surface and vegetation condition found throughout the landscape. Soils are the primary
21
Sheehy, D., M. Hale, D. Damiran, T. Sheehy, D. Tsogoo, and Sh. Batsukh. 2012. Monitoring change on Mongolian rangelands. Final report for Netherlands-Mongolia Environmental Trust Fund for Environmental Reform (NEMO). 156 pp.
medium for vegetation growth and, along with weather and topography, are the primary determinants of the type of vegetation present in different ecozones of the study area We described the general landscape characteristics and soil profile of monitoring locations in our study area (Figure 5, Annex 5).
Figure 5. Characteristics of a South Desert ecozone soil profile near the Oyu Tolgoi mine complex. (Source: D. Damiran, 2011). General findings of our soil survey relative to topo-edaphic characteristics of the study area were:
Landscape: The study area consists of gently rolling steppe and desert lands broken occasionally by hills, scarps and local low mountain ranges. Major streams are rare. Where they occur they usually issue forth in canyons and gullies from the hills and low mountain ranges. Thunder storms, spring rains and snow melt often provide sufficient water volume on the steeper slopes to move large amounts of rocky debris out onto the adjacent slopes where it is deposited.
Rock: Rock types within the study area mostly originated from Cretaceous, Paleozoic and Mesozoic periods. They include sandstones, granite, sediments and meta-sediments, and volcanic rocks. There are also ancient marine and more recent alluvial and colluvium deposits overlying these rock types. The entire study area, except for the more exposed rocky areas, was covered by layers of windblown sandy material. This material is the parent material for most of the soils that exist today.
Soils. In general, study area soils formed from windblown sandy material were: i) over bedrock (shallow to bedrock soils), ii) in multiple layers of windblown materials (the majority of sites) and iii) over ancient marine and more recent alluvial and colluvium deposits.
Soil Textures: Soil textures ranged from loamy sand to loam in the A horizons and loam to clay loam in the B horizons.
Soil pH: All soils ranged between 7.5 to 8.5 “pH” as measured with a Hellige-Truog ”pH” test kit. White calcium carbonate deposits were visible on the soil-pedicel faces in most profiles.
22
Sheehy, D., M. Hale, D. Damiran, T. Sheehy, D. Tsogoo, and Sh. Batsukh. 2012. Monitoring change on Mongolian rangelands. Final report for Netherlands-Mongolia Environmental Trust Fund for Environmental Reform (NEMO). 156 pp.
These deposits reacted violently to dilute HCL. It is assumed that other cations such as Na and P were present but not in sufficient concentration to bring the pH readings to a nine alkali level.
Soil Color: Soil colors were obtained from both wet and dry soil using Munsell color charts and recorded in standard hue, value, and chroma notation. A copy of the color charts was provided as an annex to relate the standard hue, value and chroma notations to a color name (i.e. 10YR 4/4 is a Strong Brown color).
Lime Accumulation: Almost all profiles had visible lime accumulations and many had a cemented CaCo3 horizon (km horizon) below 25cm depth. Plant roots and water had difficulty penetrating the km horizon. Most soils that did not have km horizons were located on bedrock sites and on steeper slopes.
Gravel: Most sites had 50% or more of their surfaces covered with small, pea sized quartz gravel that was mixed with other rock types. They also had a thin, very friable granular A horizon that appeared to be dust. Structure ranged from fine granular in the upper horizons to medium subangular blocky in the lower horizons.
Roots: Vegetation roots were usually few, fine to medium in size, and often did not extend into the km horizon. If they did so, it was a usually a very short distance.
3.3 Erosion Potential Evaluation of study area soils relative to erosion potential indicated surface water flow in stream channels occurs only in areas where exposed rock, steep gradients and shallow soil limit or prevent its downward movement into the soil. Such areas were low mountain ranges, hills and scarps. In these areas, summer convection storms, spring rains and snow melt-runoff can produce large volumes of water that are able to move much rock debris. This debris is deposited in alluvial fans as the streams leave the uplands. Stream gradients decrease because they cannot carry their loads of rock debris. It is estimated that these landforms make up about 15-20 % of the study area. The remainder of the study area was gently rolling steppe with gradient less than 5 % gradient that is not prone to water erosion. Almost the entire study area has stable or moving sandy material. Stability states of the sandy material were: State (1) Stable:. This sandy material has been stable long enough to allow significant soil forming processes to occur. Measurable differences in texture and color existed compared to the parent material. Calcium carbonate (CaCo3 had been concentrated in the soil profile which binds it together and minimizes wind erosion; State (2) Somewhat Stable-A: This state had material that often occurs as a thin A1 or A11 horizon ranging from 2 -10 cm thick at the surface of the soil profile. Usually it was fine granular material with minimal soil development having occurred. It was held in place by rock fragments (desert pavement) which covered much of its surface. These rock fragments resist the wind’s ability to erode it. State (3) Somewhat Stable-B: This state had material held in place by desert shrubs such as Nitraria, Zygophyllon and other wind-breaking desert plants. These plants provided a natural wind break, even when very small, allowing sand to accumulate in their lee. As the volume of sand increased around the plant, the plant roots hold it in place. In this manner, plants were able to obtain more water, nutrients and protection for their roots than without sand around them. This process over time resulted in colonies of stable sand dunes (mounds) ranging in size from very small in the lee of a single plant to several meters in
23
Sheehy, D., M. Hale, D. Damiran, T. Sheehy, D. Tsogoo, and Sh. Batsukh. 2012. Monitoring change on Mongolian rangelands. Final report for Netherlands-Mongolia Environmental Trust Fund for Environmental Reform (NEMO). 156 pp.
circumference and height, and containing many plants and roots. A suggested name for this process is a Bio-Geo Symbiotic Relationship. State (4) Unstable: This material comprised true desert sand dunes that are moving continuously across the landscape, covering and uncovering the material in the other three states. This includes not only areas with gentle gradient but also hills, scarps and low mountain ranges. 3.4 Plant Species Composition Measurement of plant species frequency at monitoring sites indicated plant composition had changed during the six-year interval between measurements (Annex 4). Species composition appeared to change significantly on an east to south axis. On this axis, over 54 % of the sites were highly disturbed relative to total species composition (Figure 8).
0.45 0.40 0.35
Index
0.30 0.25 0.20 0.15 0.10 0.05 0.00 Grass
Forb
Shrub
Total Species
Figure 6. Plant species similarity between 2005 and 2011 in the Southern Gobi Region (Source: D. Damiran, 2012). In 2005, two-hundred and five plants were present at monitoring sites in the study area. Graminoids, forbs and shrubs comprised 30 %, 40 %, and 30 % respectively, of the plants present. Twenty-six of the plant species present in 2005/06 were not present in 2011. In 2011, one-hundred and eight plants were present at monitoring sites in the study area. Graminoids, forbs, and shrubs comprised 27, 45, and 28 percent respectively, of total plants present. Nineteen of the plant species present in 2011 were not present during the earlier measurement in 2005/06..Thirty plant species present in 2005/06 that were also present in 2011 included seven graminoid species, 11 forb species and 12 shrub species. Among plant growth forms, shrubs retained highest similarity in the interval between measurements (P=0.584), Among the three study area aimags, plant species present at monitoring sites in Omnigov had highest similarity (51 %) followed by Dundgov and Dornogov aimags. Shrubs in Dundgov aimag had only 14 % similarity. Dornogov, which had lowest overall plant similarity, had highest similarity among shrub species (Table 4).
24
Sheehy, D., M. Hale, D. Damiran, T. Sheehy, D. Tsogoo, and Sh. Batsukh. 2012. Monitoring change on Mongolian rangelands. Final report for Netherlands-Mongolia Environmental Trust Fund for Environmental Reform (NEMO). 156 pp.
Table 4. Similarity index of plant species measured in 2005 and 2011 in the three SGR aimags. Aimag Item Grass Forb Shrub Total Species
Omnigov 0.14 0.54 0.34 0.51
Dundgov 0.33 0.38 0.14 0.32
Dornogov 0.08 0.14 0.27 0.20
SEM2 0.118 0.123 0.128 0.086
P-value 0.289 0.074 0.584 0.077
Dornogov and Omnigov aimags, which together represented more than 85 % of all monitoring site locations, had a large change in graminoid species composition. However, Dundgov aimag had highest change in composition of graminoid species. Among the three aimags, Dundgov aimag had highest change in shrub species and Dornogov aimag had highest change in forbs species composition. Omnigov aimag contained the highest number of forbs that were similar between measurement times, followed by shrubs (34 %) and grasses (14 %). Most monitoring sites had low similarity among graminoid plants while forbs and shrubs were significantly different on more than 50 % of the sites. Site UG-37 in Khanbogd soum near the OT mine complex had significant difference in grasses, forbs, and shrubs present at the site in 2011 compared with 2005/06. In Dundgov aimag, 43% of the sites had a significant change in grass species composition. Forbs in Dundgov aimag had high similarity (38 %) during the interval between measurements. Shrub species differed significantly on 57% of the study sites. Growth-form composition at the DG-35 monitoring site was least similar in all growth-forms. More than half of the study sites in Dornogov aimag had significant shifts during the measurement interval. Substantial change in grasses, forbs, and shrubs occurred at 75%, 50%, and 62.5% of the study sites, respectively. All three forage classes were highly dissimilar on 37.5 % of the sites. Summarized by aimag, seventy-five percent of the sites in Dornogov aimag had high to moderately-high change in total species composition (SI = 0-0.3). Sites in Dundgov aimag had a 57% change in species composition. The least affected by a change in species composition was Omnigov aimag, where only 28.6 % of sites were significantly affected by change in species composition. 3.5 Community Similarity. Thirty-seven permanent monitoring sites were sampled for plant presence, vegetation litter on ground surface, bare ground surface, rock at ground surface, and live vegetation was measured at 37 monitoring sites. Yield of graminoids, forbs, and shrubs was also determined at each site. Dominant plant communities in the two steppe ecozones were: i) Allium/Stipa, ii) Artemisia/Allium, iii) Caragana/Allium/Stipa, and iv) Kochia/Allium/Cliestogens. Dominant vegetation types in the four desert ecozones were: i) Ajaina-Artemisia/Stipa, ii) Anabasis/Salsola/Stipa, iii) Caragana/Salsola/Stipa, iv) Eurotia/Stipa, v) Haloxylon-Reamuria/Stipa, vi) Kochia/Salsola/Stipa, vii) Reamuria-Artemisia/Stipa, viii) Salsola, and ix) Zygophyllum (Table 5).
25
Sheehy, D., M. Hale, D. Damiran, T. Sheehy, D. Tsogoo, and Sh. Batsukh. 2012. Monitoring change on Mongolian rangelands. Final report for Netherlands-Mongolia Environmental Trust Fund for Environmental Reform (NEMO). 156 pp.
Table 5. Average frequency and yield of site attributes characteristic of plant communities measured in the study area.
Zone/Community Artemisia/Salsola/Stipa Allium/Stipa Kochia-Salsola/Stipa Eurotia/Salsola/Stipa Caragana/Allium/Stipa Zigophyllum Salsola Ajiana-Artemisia/Salsola Reamuria-Artemisia/Stipa Anabasis/Salsola/Stipa Nitraria Mound Alkaline Meadow HaloxolonReaumuria/Stipa
Frequency (%) Yield (kg/ha) Litter Bare Rock Veg Grass Forb Shrub Total Steppe (Dry and Semi-Desert) 0 23.5 9.5 67 177.5 190 195.5 563.5 0.5 15 17.5 67 174.5 228 29.5 432 Desert (North and Middle) 0.0 16.0 20.0 64.0 77.7 196.7 286.7 561.0 0.7 24.0 4.0 71.3 83.0 134.7 196.7 413.7 4 17.6 10.6 67.8 90.4 116 139.8 346.4 0 35 0 65 0 118 939 1057 0 16.5 22.5 61 58.5 306 86.5 451 0 21.5 13.5 65 129 85.5 121 336 Desert (South) 2.3 29.3 7.0 61.3 26.0 93.3 339.0 458.0 1.2 23.5 16.4 58.9 41 57.6 287 385.6 0 16.5 1 82.5 0 0 0 0 0 25 0 75 221 299 528 1047 1.0
38.7
1.7
58.7
45.0
95.0
176.7
316.3
Comparison of monitoring site attributes indicated:
Frequency of vegetation litter was low in all zonal rangeland types, but was especially low in the Steppe and North-Middle Desert ecozones in the northern portion of the study area;
Frequency of bare ground-surface was highest in the South Desert ecozone (30 %) and lowest in the Dry Steppe ecozone. Desert ecozones had higher frequency of bare ground-surface than Steppe ecozones;
Frequency of rock at ground-surface was low compared to bare ground-surface in all ecozones. Dry Steppe and North-Middle Desert zones had highest rock frequency while South Desert had lowest rock frequency. Considerable evidence of wind-blown sediments, especially sand, may account for the low frequency of surface rock throughout the study area ecozones, especially in the South Desert land cover type;
Frequency of vegetation was high in all zones compared to other site attributes. In all zones, frequency of vegetation at the site was higher than 60 %. Highest frequency of vegetation occurred in the South Desert zone which was dominated by low stature shrubs such as Anabasis sp. and Salsola passerine and annual grasses and forbs.
3.6 Vegetation Types The study area was dominated by desert shrub vegetation types. In Dry and Semi-Arid Steppe ecozones, monitoring sites were located in Artemisia shrub and Allium-Stipa herbaceous vegetation types (Figure 7). All North and Middle Desert vegetation types were dominated by shrubs generally palatable to large herbivores. The dominant graminoid in plant communities of these vegetation types was Stipa, especially
26
Sheehy, D., M. Hale, D. Damiran, T. Sheehy, D. Tsogoo, and Sh. Batsukh. 2012. Monitoring change on Mongolian rangelands. Final report for Netherlands-Mongolia Environmental Trust Fund for Environmental Reform (NEMO). 156 pp.
Stipa glareosa. In the more xeric portions of the Middle Desert ecozone, Salsola, Ajaina-Artemisia, and Artemisia-Reamuria plant communities dominated shrub vegetation types. The South Desert vegetation types were dominated by Anabasis-Salsola, Haloxylon, and Nitraria Mound plant communities. Alkaline Meadows associated with springs often formed small, highly productive oasis meadows. Although Stipa species remained the dominant graminoid, annual and/or increaser grasses such as Aristeda sp. and Eragrostis minor frequently occurred in both steppe and desert ecozones (Annex 4). Frequency 90 80
%
70 60
Litter
50
Bare
40
Rock
30
Veg
20 0
Artemisia Shrub AlliumStipa Forb Kochia Shrub Eurotia Shrub Caragana Shrub Salsola Disturbed AjianaArtemisia ReamuriaArtemisia AnabasisSalsola HaloxolonReaumuria Nitraria Mound Alkaline Meadow
10
Steppe Desert (North and Desert (Middle) (Dry and Middle) Semi-
Desert (South and Middle)
Vegetation Type
Figure 7. Site attributes characteristic of study area vegetation types (Source: D.P. Sheehy, 2012). Ground-surface litter, which had lowest frequency among site attributes, had highest occurrence in vegetation types of North and Middle Desert ecozones. The Caragana shrub vegetation type had highest ground surface litter among all vegetation types. Bare ground-surface was highest in the Haloxylon and Reamuria-Artemisia shrub vegetation types encountered in the South Desert ecozone, and lowest in vegetation types comprising Semi-Desert and North Desert ecozones. Rock at ground surface was highest in disturbed Salsola plant communities. Generally, rock at ground surface was higher in more mesic vegetation types which often occurred on gravel plains associated with Dry Steppe and North Desert ecozones. Frequency of vegetation ranged between 58 and 72 % in all plant communities except the Nitraria Mound community. The latter shrub has dense vegetation cover on sandy mounds. 3.7 Vegetation Yield The highest yielding plant community was the Alkaline Meadow type in the South Desert ecozone (Figure 8). Yield of this community was more than 1000 kg/ha, but the community was only associated with small desert oases. Plant communities in the Dry Steppe and North Desert ecozones had moderate yield ranging between 400 and 600 kg/ha. Graminoids and forbs comprised a proportionately high percentage of yields in these vegetation types. In Desert plant communities, shrub yield was proportionately higher compared to herbaceous growth-forms. Among the Desert plant communities, the
27
Sheehy, D., M. Hale, D. Damiran, T. Sheehy, D. Tsogoo, and Sh. Batsukh. 2012. Monitoring change on Mongolian rangelands. Final report for Netherlands-Mongolia Environmental Trust Fund for Environmental Reform (NEMO). 156 pp.
North and Middle Desert ecozones had lower total yield then South Desert, but graminoid and forb yield comprised a higher proportion of total yield.
Yield 1200 1000 Grass
kg/ha
800
Forb
600
Shrub
400
Total
Steppe (Dry and SemiDesert)
Desert (North and Middle)
Alkaline Meadow
AnabasisSalsola
ReamuriaArtemisia
Salsola Disturbed AjianaArtemisia
Caragana Shrub
Eurotia Shrub
Kochia Shrub
AlliumStipa Forb
Artemisia Shrub
0
HaloxolonReaumuria
200
Desert (South)
Vegetation Types
Figure 8. Vegetation yield (kg/ha) at 37 study area monitoring sites (Source: D.P. Sheehy, 2012). 3.8 Preliminary Ecological Site Descriptions Our approach to assessing Rangeland Health was: i) use conventional rangeland survey methods to make quantitative (i.e., frequency, yield, and soil profile description) and qualitative (landscape appearance, ecozone classification, etc.) assessment of site attributes, ii) establish a preliminary Ecological Site Description (Annex 5) for the site, and iii) use available information to determine the current Rangeland Health status of the site (Annex 6). Ecological Site Descriptions provide the basis for assessing rangeland health. In our rangeland monitoring study area, we described and classified 19 different Ecological Sites that occurred at 38 monitoring sites (Table 7).
28
Sheehy, D., M. Hale, D. Damiran, T. Sheehy, D. Tsogoo, and Sh. Batsukh. 2012. Monitoring change on Mongolian rangelands. Final report for Netherlands-Mongolia Environmental Trust Fund for Environmental Reform (NEMO). 156 pp.
Table 6. Ecological Sites in the SGR study area. Site/Location/Ecozo ESD Soils/PZ ne Dry Steppe DO-03 Mandakh 4 Loamy Skeletal/10-15 DO-28 Airag
4
Loamy Skeletal/10-15
DG-07 Tsagaandelger
4
Loamy Skeletal/10-15
DO-01 Undershil DG-35 Tsagaandelger DO-02 Saikhandelger DO-23 Airag
1 1
Semi-Desert Steppe Gravelly Loam/10-15 Gravelly Loam/10-15
DG-36 Tsagaandelger DG-38 Bayanjargalan DG-01 Undershil DG-06 Undershil DO-29 Saikhandulan DG-34:Undurshil
6
OT-1RKhanbogd OT-2RKhanbogd OT-3R Khanbogd OT-4R Khanbogd
8 8 8 8
DO-16 Khantabulag OT-5R Khanbogd OT-10W Khanbogd OT-12W Khanbogd OT-6M Khanbogd UG-39 Manlai UG-40 Manlai UG-44 Manlai UG-45 Manlai
9 9 9 9 10 11 11 11 11
UG-38 Manlai OT-11W Khanbogd OT-7M Khanbogd
12 12 19
UG-47Khanbogd
13
2
Plant Community
Stipa/Allium/CaraganaArtemisia Stipa/Allium/CaraganaArtemisia Stipa/Allium/Caragana/Artemis ia Stipa Stipa Allium/Stipa
3
Shallow Clay Loam/1015 Shallow Clay Loam/1015 Clay Loam/10-20
3
Clay Loam/10-20
Stipa/Allium
7 7 5
Sandy Loam/10-15 Sandy Loam/10-15 Loamy Sand/10-15 North Desert Steppe Clay Loam/10-15 Semi-Desert Loamy/7-13 Loamy/7-13 Loamy/7-13 Loamy/7-13 Desert Steppe Clay Loam/7-13 Clay Loam/7-13 Clay Loam/7-13 Clay Loam/7-13 Loamy Skeletal/7-13 Loamy Sand/7-13 Loamy Sand/7-13 Loamy Sand/7-13 Loamy Sand/7-13 Middle Desert Steppe Fine Sandy Loam/7-13 Fine Sandy Loam/7-13 Loamy Silt/7-13 Desert Shrubby Sandy Loam/6-
Stipa/Eurotia Stipa/Eurotia Allium/Stipa
2
Allium/Stipa Stipa/Allium
Salsola/Stipa/Allium Stipa/Anabasis/Sympegma Stipa/Anabasis/Sympegma Stipa/Anabasis/Sympegma Stipa/Anabasis/Sympegma Stipa/Anabasis/Reamuria Stipa/Anabasis/Reamuria Stipa/Anabasis/Reamuria Stipa/Anabasis/Reamuria Stipa/Anabasis Stipa/Caragana/Eurotia Stipa/Caragana/Eurotia Stipa/Caragana/Eurotia Stipa/Caragana/Eurotia Zygophyllum/Stipa Zygophyllum/Stipa Stipa/Amygdalus/Iris Haloxylon/Stipa
29
Sheehy, D., M. Hale, D. Damiran, T. Sheehy, D. Tsogoo, and Sh. Batsukh. 2012. Monitoring change on Mongolian rangelands. Final report for Netherlands-Mongolia Environmental Trust Fund for Environmental Reform (NEMO). 156 pp.
UG-46 Manlai DO-15 Khantabulag OT-13W Khanbogd OT-8R Khanbogd OT-9W Khanbogd DO-04A Mandakh DO-04B Mandakh DO-04C Mandakh
14 15 15 18 18 16 16 17
12 Desert Loam/6-12 Droughty Loam/7-13 Droughty Loam/7-13 Silt Loam/7-13 Silt Loam/7-13 Sodic Loam/7-13 Sodic Loam/7-13 Wet Meadow/7-13
Nitraria/Stipa Haloxylon/Stipa Haloxylon/Stipa Stipa/Anabasis/Reamuria Stipa/Anabasis/Reamuria Nitraria/Stipa/Acnatherum Nitraria/Stipa/Acnatherum Phragmites/Juncus
Site names describe primary soil characteristics and a four-class precipitation zone (PZ) that follows latitudinal and elevation gradients. Precipitation was measured as a 40 year annual average obtained from the Forage Growth (PHYGROW) Model rainfall database. Precipitation Zones (PZ) in the study area were: i) the 10-20 cm zone that extends from the Grass Steppe ecozone south to the Dry Steppe ecozone and generally lies above 1200 m elevation, ii) the 10-15 cm zone that mirrors the 10-20 cm zone but lies below 1200 meters and extends south to the Dry steppe and Semi-Desert steppe zones, iii) the 7-13 cm zone that extends south from steppified Middle Desert into true desert, and iv) the 6-12 cm zone that represents the driest desert zone. The three monitoring sites located in the Dry Steppe ecozone were in the “loamy skeletal 10-15 cm. precipitation zone” ecological site. The five ecological sites described in the Semi-Desert Steppe ecozone were “gravelly loam 10-15 cm. precipitation zone, shallow clay loam 10-15 cm precipitation zone, clay loam 10-20 cm precipitation zone, and sandy loam and loamy sand 10-15 cm precipitation zone. Plant communities found at these ecological sites were generally dominated by Stipa and Allium herbaceous plant species. Communities dominated by the shrub Eurotia occur in the ecozone. The clay loam 10-15 cm PZ ecological site was found in the North Desert ecozone. We think that ecological sites found in these northern ecozones are associated with equilibrium ecosystems. The 11 ecological sites we described in the more arid desert ecozones generally had sandy soils and lower precipitation zones. Precipitation zones generally ranged from 7 to 13 cm except for the “shrubby sandy loam” and “desert loam” ecological sites which were in the 6 to 12 cm precipitation zone. In these ecological sites, sandy soils and shrub vegetation dominated at the site and throughout the desert ecozones. We think that ecological sites in these southern ecozones are generally associated with nonequilibrium ecozones. 3.9 Preliminary Rangeland Health Assessment Rangeland health was determined at 39 permanent monitoring sites by quantitative and/or qualitative assessment of physical and biological site attributes (Table 7). At each site, Ground Cover Attributes (GCA), Soil Surface Factors (SSF), and Observed Apparent Trend (OAT) were evaluated to determine Ecological Status (Annex 7).
30
Sheehy, D., M. Hale, D. Damiran, T. Sheehy, D. Tsogoo, and Sh. Batsukh. 2012. Monitoring change on Mongolian rangelands. Final report for Netherlands-Mongolia Environmental Trust Fund for Environmental Reform (NEMO). 156 pp.
Table 7. Rangeland Health Assessment of study area monitoring sites. Ecological Zone ESD Site Rangeland Status Dry Steppe 4 DO-03, DO-28, DG-07 Mid (Fair – Good) Semi-Desert Steppe 1-5 DO-01, DG-35, DO-02, Mid (Fair) DG-01 DO-23, DG-38, DG-06, Mid (Fair – Good) DO-29 DO-36 Late (Good) North Desert Steppe 6 DG-34 Mid (Fair – Good) Semi-Desert Steppe 8 OT-1R Early (Poor – Fair) OT-2R Early (Poor) OT-3R Mid (Poor – Fair) OT-4R Mid (Fair) Desert Steppe 9-11 DO-16, UG-44 Mid (Fair – Good) OT-5R, OT-12W, UGMid (Fair) 45, UG-39, UG-40 OT-10W, OT-6M Early (Poor) Middle Desert Steppe 12 UG-38 Early (Poor) OT-11W Mid (Fair) OT-7M Mid (Fair – Good) Desert 13-15, OT-9W, OT-8R, UG-47, Mid (Fair) 18 OT-13W, UG-46, DO-15 Early (Poor) Dunes (Mound) 16 DO-04A Mid (Fair) DO-04B Early (Poor) Meadow (Oasis) 17 DO-04C Late (Good) Our assessment of rangeland health indicated that more than 73 percent of the sites had mid-seral vegetation. Only 5.3 percent of the sites had late seral vegetation, while 21.0 % of the sites had early-seral vegetation. Rangeland health at monitoring sites with mid-seral vegetation was fair or fair to good. At monitoring sites with early seral vegetation, rangeland health was poor, or poor to fair. Monitoring sites with late seral vegetation had good rangeland health. Monitoring sites in the Dry and Semi-Desert Steppe ecozones appeared to have better rangeland health than monitoring sites in the desert ecozones. Our assessment of rangeland health at the 39 monitoring sites indicated that ecological sites with loamy soils in the 7-13 cm precipitation zone were most susceptible to disturbance. These sites, while located in desert ecozones, appear to be more characteristic of communities associated with equilibrium ecosystems.
31
Sheehy, D., M. Hale, D. Damiran, T. Sheehy, D. Tsogoo, and Sh. Batsukh. 2012. Monitoring change on Mongolian rangelands. Final report for Netherlands-Mongolia Environmental Trust Fund for Environmental Reform (NEMO). 156 pp.
4. Monitoring Rangeland Use 4.1 Large Herbivore Population Trends Large herbivores grazing rangeland habitat of the study area were livestock (i.e., sheep, goats, cattle, horse, and camel) and several species of large herbivore wildlife (i.e. khulan, gazelle, bighorn sheep, and wild goat). Large herbivores, as dominant rangeland users, depended on rangeland forage and browse plants almost exclusively to meet their daily intake of food and nutrients. Livestock Trends: In our study, we obtained annual livestock statistics from government staff of soums located within the study area. In 2010, total livestock numbers present in the 11 study area soums was 860,000 head including goats, sheep, cattle, horses, and camels (Figure 9)
Soum Livestock Numbers Ulziit
200000
Manlai
No.
150000
Tsagaandelger Hatanbulag
100000
Hanbogd Bayanjargalan
50000
Mandah Undershil
Year
2010
2009
2008
2007
2006
2005
2004
2003
2002
2001
2000
0
Dalanjargalan Airag Saihandulan
Figure 9. Total livestock numbers in 11 study area soums over a 10 year period (Source: D.P. Sheehy, 2012). The trend in livestock numbers in all soums between 2000 and 2010 was highly variable. Numbers declined in 2002, increased substantially by 2004, and declined again by 2006. By 2009, livestock numbers had increased, but these numbers declined during the severe winter of 2009/10. Both 2001 and 2009 had severe winters that caused high mortalities to livestock herds in affected areas, which accounts for the substantial drop in livestock numbers in study area soums. Between 2000 and 2009, Ulziit, Manlai and Hatanbulag soums had highest livestock numbers and the most severe losses as a proportion of the total herd during the 2009 winter. Soum livestock numbers were scaled to sheep equivalent units (SEU) to compare trend in livestock numbers between 2000 and 2010 (Figure 10).
32
Sheehy, D., M. Hale, D. Damiran, T. Sheehy, D. Tsogoo, and Sh. Batsukh. 2012. Monitoring change on Mongolian rangelands. Final report for Netherlands-Mongolia Environmental Trust Fund for Environmental Reform (NEMO). 156 pp.
Study Area Livestock (SEU)
No.
600000 500000
Goat
400000
Sheep
300000
Cattle
200000
Horse
100000
Camel
20 10
20 08 20 09
20 06 20 07
20 03 20 04 20 05 1
20 01 20 02
20 00
0
Year
Figure 10. Study area livestock numbers in sheep equivalent units (SEU) (Source: D.P. Sheehy, 2012). Based on equivalent numbers rather than head of livestock, camel, horse and cattle populations were low in the study area for at least a decade, and the current trend was lower, while cattle have not recovered from the 2001 and 2009 high-mortality winters. Sheep and goat populations as a proportion of soum herds, while suffering losses during the 2001/02 winter, maintained relatively equivalent and proportional numbers during the 10-year period. Goats surpassed sheep, and after 2006, both sheep and goats dominated soum herds. High sheep and goat mortalities during the 2009 winter reduced total livestock equivalent numbers to their lowest numbers since 2000.
Large Wild Herbivores Trends. The general trend in large wild herbivore numbers appears to be lower. Two earlier studies of Khulan (Kaczensky and others 2006, Sheehy and others 2009) indicated that khulan have been rapidly declining due to illegal hunting, conflicts with livestock over use of rangeland habitat, and artificial barriers restricting the mobility needed to adapt to increasing aridity in the SGR. Current population trends of other large herbivores in the study area, although unknown, also appeared to be declining due primarily to legal and illegal hunting.
4.2 Large Herbivore Use of Rangeland. Global Positioning System (GPS) Tracking. During a study of large herbivore conflict in the SGR (Sheehy and others, 2009), three randomly selected herders agreed to carry position-recording GPS units while they were actively herding their animals (Figure 11).
33
Sheehy, D., M. Hale, D. Damiran, T. Sheehy, D. Tsogoo, and Sh. Batsukh. 2012. Monitoring change on Mongolian rangelands. Final report for Netherlands-Mongolia Environmental Trust Fund for Environmental Reform (NEMO). 156 pp.
Digital Elevation Overview of Herder Pastureland and Study Area
Ulaanhukhun
Yubba
Haupuac
Figure 11. Tracks of livestock herded by three cooperating herders in SW Dornogov aimag (Source: C.M. Sheehy, 2007). These herders managed their livestock at relatively small scales within larger scale rangeland habitat. During the drought summer of 2005, livestock were limited to grazing rangeland within a radius of five to seven kilometers of their water source. Most water sources were used by livestock of multiple herders, while rangeland was grazed by livestock of single households who held customary rights to specific wells and associated rangeland. Access to drinking water was the primary factor limiting the scale at which livestock were able to utilize rangeland forage. The three herders had access to different types of water sources, and consequently their livestock used rangeland differently. Ulaanhukhun’s livestock were watered at a functioning deep mechanical well. Yubaa’s livestock watered daily at several fresh water ponds that were located in the immediate rangeland area. Hacpau’s livestock were watered daily from different sources including shallow, hand drawn wells, shallow mechanical wells, and from fresh water ponds. The availability of multiple types of water sources enabled the latter two herders to utilize local rangeland more effectively because livestock were able to graze between water sources. There usually is a high concentration of livestock on rangeland surrounding a deep mechanical or production well. Most grazing by Ulaanhukhun’s livestock occurred within 5 kilometers of the production well but with several longer distance grazing movements to more distant forage sources (Figure 12). In contrast, the grazing pattern of Yubaa’s livestock reflected a more linear pattern as livestock grazed between several fresh-water surface ponds (Figure 13). Access to drinking water at several points improved livestock access to larger rangeland foraging areas.
34
Sheehy, D., M. Hale, D. Damiran, T. Sheehy, D. Tsogoo, and Sh. Batsukh. 2012. Monitoring change on Mongolian rangelands. Final report for Netherlands-Mongolia Environmental Trust Fund for Environmental Reform (NEMO). 156 pp.
Figures 12 & 13..Influence of water source on livestock grazing management strategies. Left figure reflects herder dependence on water from wells. Right figure reflects herder dependence on water from ponds. (Source: C.M. Sheehy, 2007). The linear grazing pattern allowed herded livestock to gain access to a wider variety of plant communities and to avoid concentration of livestock grazing on vegetation around a well. This type of grazing puts less pressure on rangeland vegetation and allows the grazing animal to optimize dietary intake of nutrients. Although random contact with khulan may increase, the better distribution of livestock and reduced concentration near water sources reduced livestock conflict with khulan for both forage and water. Two other livestock grazing management strategies were observed (Figure 14). Livestock of one herder were in a “maintenance grazing strategy” and were constrained by their need to be in close proximity to a shallow well. Livestock of the other herder were being herded in a linear “fattening” grazing pattern (Mon. Otor) which enabled livestock to access a higher nutrient diet by selectively grazing preferred and desirable plants encountered as the animals rapidly moved through different plant communities and vegetation types. Although both grazing strategies encountered collared khulan (colored dots), the concentration of livestock and humans around a well had greater potential to disrupt khulan use of rangeland habitat.
35
Sheehy, D., M. Hale, D. Damiran, T. Sheehy, D. Tsogoo, and Sh. Batsukh. 2012. Monitoring change on Mongolian rangelands. Final report for Netherlands-Mongolia Environmental Trust Fund for Environmental Reform (NEMO). 156 pp.
Maintenance Grazing Strategy Pattern
Fattening Grazing Strategy Pattern
Figure 14. Different livestock (grey dots) and Wild Ass (colored dots) grazing strategies in SW Dornogov aimag (Source: D.E. Johnson, 2007).
Large Wild Herbivore Satellite Tracking. In the 2005 study, eight Khulan were collared and tracked with ARGOS satellite collars to determine their use of rangeland habitat (Kaczensky and others, 2006). The location of collared khulan during summer and winter (463 observations in 2005 and 2006) and uncollared khulan observed along vehicular transects (51 observations in 2006 and 2007) provided an indication of khulan response to annual variations in rangeland condition.. Locations were used to establish Minimum Convex Polygons (MCP) of khulan habitat during the period observations were made. Location of khulan in different vegetation types within the MCP also indicated trends in khulan preference for habitat in the SE Gobi. Positions of the eight collared khulan indicated that khulan were widely dispersed. Rangeland habitat used by khulan during the summer 2005 was spatially large (67,248 km2) and included all or part of 10 suoms in SW Dornogov and SE Omnigov aimags (Figure 15). During the winter, rangeland habitat used by khulan was more concentrated (15,546 km2) and was located in and around the Special Protected Area (SPA) in SW Dornogov and SE Omnigov aimags. In 2005-2006, the ratio of winter range area to summer range area was 1 to 4.3, indicating the apparent need of khulan to have access to an extensive summer range during drought summers.
36
Sheehy, D., M. Hale, D. Damiran, T. Sheehy, D. Tsogoo, and Sh. Batsukh. 2012. Monitoring change on Mongolian rangelands. Final report for Netherlands-Mongolia Environmental Trust Fund for Environmental Reform (NEMO). 156 pp.
Khulan GPS Collar locations for 2005
Summer
Winter
Figure 15. Seasonal MCPs of rangeland area with observed use by collared khulan (summer=green, winter=blue) during 2005 and 2006 (Source: C.M. Sheehy, 2007). The MCP of khulan summer rangeland indicated Khulan used their mobility and capacity to travel long distances to seek out favorable habitat. During the summer, khulan sought moderate to higher elevation positions on hill ranges and plateaus that provide topographic relief in the SE Gobi (green to blue color in figure). Conversely, khulan avoided wide, low elevation desert valleys between east-west lying hill ranges. The location of collared khulan during the winter season indicated higher elevation hills and plateaus were preferred rangeland habitat (Figures 16& 17).
Figure 16 & 17. The left figure shows small stature shrub/bunchgrass habitat found on higher elevation plateaus and hill ranges. The right figure shows tall shrub habitat found in low elevation valleys and depressions (Source: D. Damiran, 2008).
37
Sheehy, D., M. Hale, D. Damiran, T. Sheehy, D. Tsogoo, and Sh. Batsukh. 2012. Monitoring change on Mongolian rangelands. Final report for Netherlands-Mongolia Environmental Trust Fund for Environmental Reform (NEMO). 156 pp.
Transect Monitoring. Between 2006 and 2007, khulan and gazelle were observed along a vehicular transect extending from Mandah suom in west-central Dornogov aimag to the SPA in Khatenbulag suom (Figure 18). Although the MCP defined from vehicular observations tended to be linear, since it is an artifact of the general north-south linear transect followed by the vehicle, the summer and winter range MCPs indicated similar seasonal ranges were used by khulan during 2006-2007 as occurred during 20052006. Vehicular Khulan Observations for 2006 and 2007 Ulaanhukhun
Summer
Yubba
Haupuac Winter
Figure 18. Seasonal MCPs of rangeland area (summer=green, winter=blue) with observed khulan use along a vehicular transect during 2006 and 2007 (Source: C.M. Sheehy, 2008). The MCP defined by observations of khulan during the summer of 2006 indicated that summer rangeland habitat used by khulan was much larger. The MCP defined by observations of khulan during the winter indicated that khulan concentrated their use in and around the SPA. The MCPs for 2006-2007 indicated that khulan have an expansive summer range (8,063 km2) but concentrated their use during the winter in a relatively small area of rangeland habitat (4,405 km2). In 2006-2007, the ratio of winter range to summer range was 1:1.8. Although the ratio of winter to summer range area was not directly comparable between years because of the different methodology used to obtain MCPs, both ratio support the apparent need of khulan to have access to larger areas of summer rangeland habitat compared to winter rangeland habitat (Figure 19). The need for a large summer range is apparent even though 2006 had higher cumulative precipitation compared to 2005.
38
Sheehy, D., M. Hale, D. Damiran, T. Sheehy, D. Tsogoo, and Sh. Batsukh. 2012. Monitoring change on Mongolian rangelands. Final report for Netherlands-Mongolia Environmental Trust Fund for Environmental Reform (NEMO). 156 pp.
Khulan GPS Collar and Vehicular locations for 2005, 2006 and 2007
Summer 2007 (Vehicular) Winter 2006 (Vehicular)
Winter 2005 (GPS Collar)
Summer 2005 (GPS Collar)
Figure 19. Seasonal MCPs of rangeland area with observed khulan use between 2005 and 2007 (Source: C.M. Sheehy, 2008). The overlap of winter rangeland MCPs, although established using different methods and data sets from different years, suggests that khulan select specific topographical land forms that provide optimal conditions for winter survival and security. These landforms appeared to be in or near the SPA and were centered on the east-west range of moderate elevation hills and plateaus in the SE Gobi. The much larger summer rangeland MCPs indicated the mobility and capacity of khulan to travel long distances to access a variety of habitats that provided optimal foraging conditions and access to drinking water. Relative to topography, khulan appeared to utilize habitat associated with moderate elevation hill ranges and plateaus found in the SE Gobi. The lower elevation desert valleys, while used, appeared to provide less optimal habitat for khulan in either winter or summer.
Single Transect. During our 2011 study, we used a vehicular transect to establish MCP boundaries of our study area in the SGR. We also used the transect route to observe and record large wild herbivore use of habitat during late summer in the SGR. When large wild herbivores were encountered, we recorded GPS coordinates of their location and the habitat in which they were observed (Figure 20).
39
Sheehy, D., M. Hale, D. Damiran, T. Sheehy, D. Tsogoo, and Sh. Batsukh. 2012. Monitoring change on Mongolian rangelands. Final report for Netherlands-Mongolia Environmental Trust Fund for Environmental Reform (NEMO). 156 pp.
Figure 20. Gazelle observed grazing in an Allium community in the Semi-Desert Steppe ecozone during late summer 2011. Note Allium plants on gravelly soils in the center-foreground of the photograph (Source: D. P. Sheehy, 2012). We observed 74 total Khulan at 12 different locations along the 1500 km transect. Khulan herd size ranged from 15 head in the largest herd to single animals. We observed 824 gazelle at nine different locations along the vehicle transect. Gazelle herd size ranged from 500 in the largest herd to single animals. We also observed numerous foals and kids in both observational groups. Using observations, digitized land cover maps, and the Forage Growth (PHYGROW) modeler, we determined:
Rangeland used by Khulan and Gazelle had high quality forage that was desirable to both herbivores. Both khulan and gazelle were observed in desirable forage habitat (i.e., Allium and Reamuria communities) as described in previous studies (Sheehy and others, 2007). Plant communities were included in the bunch grass vegetation type found in the Northern Desert (Semi-Desert) ecozone..
No other humans, including herders, were observed near the grazing animals indicating that the animals felt relatively secure and the desirable habitat occurred primarily on rangeland used as livestock winter range...
Precipitation events had improved access of Khulan and Gazelle to drinking water, as indicated by standing water in drainages and depressions in and adjacent to the rangeland habitat being grazed.
We concluded that a precipitation event had stimulated growth of forage desired by the khulan and gazelle, creating the optimal forage quality and quantity necessary to meet khulan and gazelle dietary needs (Figure 22).
40
Sheehy, D., M. Hale, D. Damiran, T. Sheehy, D. Tsogoo, and Sh. Batsukh. 2012. Monitoring change on Mongolian rangelands. Final report for Netherlands-Mongolia Environmental Trust Fund for Environmental Reform (NEMO). 156 pp.
Figure 21. Simulated forage patches created by a limited-scale precipitation event characteristic of Desert ecozones (Source: C.M. Sheehy, 2008). The stature and phonological stage of the Allium plants indicated that a major precipitation event had occurred 2-3 weeks prior to our observation, and created a desirable “forage patch (Figure 26). Records of precipitation events and forage growth obtained from the Forage Growth (PHYGROW) monitoring point nearest to the observed wild herbivores supported our conclusion.
4.3 Monitoring Large Herbivore Use of Rangeland Habitat 4.3.1 Low Resolution Nominal Difference Vegetation Index (NDVI) Monitoring Nominal Difference Vegetation Index (NDVI) was used in earlier studies (2005-2007) of Khulan in the SGR (Sheehy and others, 2007) to gain insight on Khulan selection of rangeland forage habitat (Figure 22).
41
Sheehy, D., M. Hale, D. Damiran, T. Sheehy, D. Tsogoo, and Sh. Batsukh. 2012. Monitoring change on Mongolian rangelands. Final report for Netherlands-Mongolia Environmental Trust Fund for Environmental Reform (NEMO). 156 pp.
Figure 22. Khulan (colored dots) and livestock late summer foraging locations in the SGR (Source: Oregon State University, 2006). Khulan and livestock used the same rangeland area during the drought summer and winter of 2005/06. Observations of livestock and khulan indicated that livestock and khulan continued to co-use the same rangeland in the following year of higher precipitation. Cooperating herders followed similar seasonal livestock grazing patterns in both years, even though forage and water were readily available throughout the study area in 2006/07.
Free-Ranging Large Herbivores. NDVI images of the study area obtained between June and December 2005 were evaluated to test the assumption that both herders and khulan actively sought out optimal foraging areas to improve nutrient intake. MODIS-NDVI images of the study area were available at bi-weekly intervals between June 2005 and June 2007. Imagery from dates between July 12 and December 13, 2005 were from the same time period that positions of ARGOS-collared khulan and GPS tracked livestock were recorded. Bi-weekly NDVI images indicated that vegetation in the study area was “greener” throughout the summer, but began to lose “greenness” in early fall (Figure 25).
Average NDVI Value in Khulan Range 1200.0
Average NDVI Value
1000.0 800.0 600.0 400.0 200.0
7/ 12 /0 5 7/ 26 /0 5 8/ 9/ 05 8/ 23 /0 5 9/ 6/ 05 9/ 20 /0 5 10 /4 /0 5 10 /1 8/ 05 11 /1 /0 5 11 /1 5/ 05 11 /2 9/ 05 12 /1 3/ 05
0.0
Date
Figure 23. Average MODIS-NDVI values of study area rangeland between July and December 2005 (Source: D.E. Johnson, 2006). NDVI images of the study area that were obtained in late July of 2005 contained approximately 46 khulan positions. Khulan positions were recorded three days prior to the MODIS-NDVI satellite over-flight, on the day of the over-flight, and three days after the over-flight. Location of khulan GPS positions on the July 12, 2005 image suggests that khulan were seeking out habitat that had “greener” vegetation (Figure 24).
42
Sheehy, D., M. Hale, D. Damiran, T. Sheehy, D. Tsogoo, and Sh. Batsukh. 2012. Monitoring change on Mongolian rangelands. Final report for Netherlands-Mongolia Environmental Trust Fund for Environmental Reform (NEMO). 156 pp. Position of Collared Khulan on an NDVI Map of the Study Area – 12 July 2005 Least Green Vegetation = Dark Brown, Yellow = Intermediate, Green Most
Figure 24. Khulan positions relative to forage condition (i.e., greenness) in early July 2005 (Source: D.E. Johnson, 2006). . Approximately 66 % of the khulan positions on that date (black dots in the image) were in or adjacent to vegetation classified by NDVI as slightly green (i.e., less brown colored vegetation). Throughout the study area, the average rangeland NDVI value was 865, while the average NDVI value at khulan locations on that date was 1105. The concentration of moderately green vegetation in the northern portion of the study area accounts for the higher mean-value at khulan locations throughout the study area. Between early July and December, 2005, the average NDVI value of rangeland habitat used by Khulan indicated quantity of forage biomass improved between early July and early September (Figure 25).
Position of Collared Khulan on an NDVI Ma p of the Stud y Area – 28 July 2005 Least Green Veg etation = Da rk B rown, Yellow = Inte rmediate, Gree n Most
Figure 25. Khulan positions in the study area relative to NDVI identified greenness in summer and fall, 2005 (Source: D.E. Johnson, 2006). After September, quantity of forage biomass gradually declined until early November, and then declined sharply during November. The average NDVI value for forage biomass in the study area between July
43
Sheehy, D., M. Hale, D. Damiran, T. Sheehy, D. Tsogoo, and Sh. Batsukh. 2012. Monitoring change on Mongolian rangelands. Final report for Netherlands-Mongolia Environmental Trust Fund for Environmental Reform (NEMO). 156 pp.
and December ranged from a low value of 602 in early December to a high value of 1093 in late August. During the same period and on the same dates, average NDVI values at khulan locations ranged from a low value of 460.2 in early December to a high value of 1242.7 during the same period (Figure 26).
Comparison of NDVI Values on Range to Mean NDVI Values at Khulan Positions 1400.0 1200.0
NDVI Value
1000.0 800.0 600.0 400.0 200.0
12/13/05
11/29/05
11/15/05
11/1/05
10/18/05
10/4/05
9/20/05
9/6/05
8/23/05
8/9/05
7/26/05
7/12/05
0.0
Date Average NDVI Value
Average Khulan NDVI Value
Figure 26. Comparison of NDVI values randomly selected in the study area with NDVI values at Khulan locations in summer and fall, 2005 (Source: D.E. Johnson, 2006). Approximately 69 % of the khulan were located in rangeland habitat with slightly to moderately green vegetation in the NDVI image. Khulan located in the northern part of the study area were in moderately green vegetation associated with vegetation in the Dry and Semi-Desert Steppe ecozones. The NDVI greenness index indicated that khulan locations had access to better quality forage compared to forage quality of the study area. Khulan locations had higher NDVI values more than 60 % of the time. Although differences were not tested, the higher NDVI values for khulan locations is consistent with study observations and herder contention that khulan have an innate capacity to locate and move to forage green-up patches before herders could locate the forage-patches and move livestock to them.
Herded Large Herbivores. In contrast to the highly mobile grazing strategies of free-roaming large herbivores, herded livestock had restricted access to rangeland habitat (Figure 27).
44
Sheehy, D., M. Hale, D. Damiran, T. Sheehy, D. Tsogoo, and Sh. Batsukh. 2012. Monitoring change on Mongolian rangelands. Final report for Netherlands-Mongolia Environmental Trust Fund for Environmental Reform (NEMO). 156 pp.
Herder Camps
Herder Track - 16 July 2005 to 27 August 2005 NDVI Image for 13 August 2005
Figure 27. Livestock selection of foraging areas relative to NDVI “greenness” index in July and August, 2005 (Source: D.E. Johnson, 2006). Herders and livestock were also seeking greener vegetation but the constraint imposed by the need to water livestock daily at fixed water sources limited options of the herder. The majority of livestock locations indicated that livestock were dependent on rangeland habitat surrounding the nearest well (white dot in the center of the GPS points). . The NDVI greenness index for July 12 indicates that vegetation around the well was only “slightly green”. Visual evaluation of vegetation greenness in the NDVI image of livestock grazing corresponded with the average of the study area. It also indicated that livestock forage and nutrient intake, irrespective of animals need, could be realized only from the vegetation available in the five to seven kilometer zone around a water source. The constraint imposed on livestock by the need for drinking water not only increasesd livestock grazing pressure on adjacent rangeland habitat but substantially limited livestock opportunities to optimize forage and nutrient intake. Herder’s tried to overcome these limitations by periodic movement of livestock and camp. Even though the NDVI greenness index for the study area improved in mid-August to 1354 (i.e., moderately green vegetation) compared to 1105 (i.e., slightly green vegetation) in mid-July, livestock capacity to access the potentially more nutritious rangeland habitat remained limited by the water constraint and lack of mobility compared to the free-ranging Khulan.
High Resolution LANDSAT 3-D Monitoring. High resolution satellite imagery can provide useful information about large herbivore use of rangeland. Livestock GPS positions imposed on a LANDSAT 3D image of the study area indicated livestock of one herder had access to only two vegetation types unless livestock were herded long distances from their major water source (Figure 28).
45
Sheehy, D., M. Hale, D. Damiran, T. Sheehy, D. Tsogoo, and Sh. Batsukh. 2012. Monitoring change on Mongolian rangelands. Final report for Netherlands-Mongolia Environmental Trust Fund for Environmental Reform (NEMO). 156 pp.
Figure 28. LANDSAT 3-D photo mosaic clearly revealing topographic factors influencing herder livestock movement (Source: D.E. Johnson, 2006). Desert watercourses and the interface between mountain and plain land-forms were obvious on high resolution satellite imagery. Movement to a different camp site improved livestock access to a lower elevation forage patch at the confluence of desert water courses during late summer. Although water courses lacked surface water, sub-surface moisture in the water courses facilitated vegetation green-up in the immediate area. The confluence of the two watersheds was also a favorable grazing area for livestock because the watercourse was a potential catchment for water run-off from precipitation events that might occur higher in the watershed.
4.4 Monitoring Regional Grazing Impacts. In our study, we adapted the Landscape Appearance-Key Forage Area method to evaluate impacts of large herbivore use on rangeland habitat. The steps we used were: i) frequency measurements indicated the presence or absence of key forage plants and changes in site attributes, ii) rated plant species relative to palatability to large herbivores, iii) qualitatively evaluated rangeland habitat at the site relative to a herbivore utilization index.(Annex 9). Both quantitative and qualitative information obtained at the site was used to rate large herbivore utilization of rangeland habitat (Table 9).
Table 9. Impact of annual large herbivore utilization on rangeland habitat in five ecozones. Rangeland Ecozone/Utilization Impact (No. of Sites) Dry Steppe (2) Semi-Desert (6) Middle Desert (13) North Desert (4) South Desert (10) Total
Very High
High
Medium
Low
5
1 3 4 7
2 7 7
5 12 16
1 3 4 3 3 3 9 13
Very Low
1 1 1
46
Sheehy, D., M. Hale, D. Damiran, T. Sheehy, D. Tsogoo, and Sh. Batsukh. 2012. Monitoring change on Mongolian rangelands. Final report for Netherlands-Mongolia Environmental Trust Fund for Environmental Reform (NEMO). 156 pp.
More than 62 % of the measured rangeland habitat had moderate or high utilization by large herbivores, while only 37.8 % of measured rangeland habitat had very low or low utilization. In rangeland habitat of the three Desert ecozones, 24.1 % of measured habitat was highly utilized, 41.4 % was moderately utilized, and 34.5 % had low or very low utilization. In the two Steppe ecozones, 50.0 % of rangeland habitat was moderately utilized and 50.0 % had low utilization. Among Desert ecozones, Middle and South Desert ecozones appeared to be highly utilized by large herbivores. Although not verified, livestock dependency on wells for drinking water may be related to high utilization of rangeland habitat in these Desert ecozones. The low to moderate utilization of rangeland habitat in the Dry and Semi-Desert ecozones may reflect the currently low livestock populations in Dundgov and northern Dornogov aimags. Livestock populations on these rangelands were affected by several consecutive drought years and the severe winter of 2009/10.
47
Sheehy, D., M. Hale, D. Damiran, T. Sheehy, D. Tsogoo, and Sh. Batsukh. 2012. Monitoring change on Mongolian rangelands. Final report for Netherlands-Mongolia Environmental Trust Fund for Environmental Reform (NEMO). 156 pp.
5. Monitoring Rangeland Condition 5.1 Forage Growth (PHYGROW) Model Integration of Imagery and Field Measurements. The Forage Growth (PHYGROW) model uses low resolution, satellite derived data sources to model forage growth across rangeland landscapes. Remotelysensed climate data is combined with soil and vegetation attributes measured at randomly selected monitoring points. A statistical algorithm (co-krigging) is used to derive projections of vegetation growth and yield in specific rangeland habitats (Figure 28).
Integration of Models and Imagery
PHYGROW Near Real Time Climate Imagery
Model Servers
NDVI Imagery
Geostatistical and Forecasting Analysis Regional Maps
Figure 28. Integration of imagery and modeling in the Forage Growth (PHYGROW) model (Source: Stuth and others, 2003). The primary outputs of the model we used in our study were the long-term databases (40+ years) associated with monitoring points. Monitoring point databases provided information on:
Rangeland forage growth and availability (i.e., average forage yield, forage yield, deviation from normal forage yield, forecasted forage yield, and historical average forage yield),
Vegetation growth (standing crop yield and standing herbaceous crop yield),
Climatic conditions (rainfall, temperature, solar radiation, weather, historical average rainfall, and historical average temperature).
Secondary outputs of the model we used were bi-weekly forage-growth maps that indicated past, current and future availability of rangeland forage. The ability to project forage growth at a future time reflects the dynamic nature of the Forage Growth (PHYGROW) model compared with measuring and harvesting forage at conventional static monitoring plots.
48
Sheehy, D., M. Hale, D. Damiran, T. Sheehy, D. Tsogoo, and Sh. Batsukh. 2012. Monitoring change on Mongolian rangelands. Final report for Netherlands-Mongolia Environmental Trust Fund for Environmental Reform (NEMO). 156 pp.
Annual Forage Growth Curves. The model projected annual forage growth curves (kg/ha) from spectrally derived NDVI images. Annual forage growth curves were used to estimate large herbivore carrying capacity of rangeland habitat on a near-real time basis (Figure 29).
Figure 29. Annual forage growth curve showing positive and negative forage growth projections (Source: Stuth and others, 2003). Actual forage yield declined approximately 1400 kg/ha between May, 2002, and January, 2003. Between January and May, 2003, forage yield improved by 1600 kg/ha, and reached an annual peak forage yield of 2200 kg/ha. In May, the annual forage growth curve declined from peak forage growth. The forage growth curve in figure 31 also provided the projected trend in forage yield (i.e., future forage yield available to grazing animals in 30, 60, and 90 days). 5.2 Calculating Rangeland Carrying Capacity In Mongolia, the size of rangeland management units range from seasonal pastures traditionally used by a few herders to administrative pasture management units such as the bag, soum, and aimag. If the number of large herbivores grazing a defined area of rangeland are known, the forage yield curve can be used to calculate a conventional animal carrying capacity and animal stocking rate for the rangeland management unit... Conventional carrying capacity calculations assume that all forage produced on a rangeland management unit will be selected and consumed at the same rate by equivalent units of different kinds and sizes of large herbivores (i.e., different kinds and species of herbivore grazers are combined into “equivalent units” according to relative body size). It also assumes that a defined carrying capacity of a rangeland management unit varies little between years in its’ capacity to provide forage to the number of large herbivores using the rangeland management unit. Adjusting livestock forage demand with forage supply is difficult, especially within annual timeframes. Consequently, average stocking rates established over a period of years usually prevail even though the annual forage balance may be positive or negative relative to the average livestock demand for forage (Maday 2012). The Forage Growth (PHYGROW) model improves estimates of rangeland carrying capacity and optimal animal stocking rates.
49
Sheehy, D., M. Hale, D. Damiran, T. Sheehy, D. Tsogoo, and Sh. Batsukh. 2012. Monitoring change on Mongolian rangelands. Final report for Netherlands-Mongolia Environmental Trust Fund for Environmental Reform (NEMO). 156 pp.
5.3 Near-Real Time 5Carrying Capacity We selected Dry Steppe rangeland habitat in Dundgov aimag to evaluate use of the Forage Growth (PHYGROW) model to assess rangeland carrying capacity (Figure 30).
Figure 30. Photograph of rangeland habitat in the Dry Steppe ecozone of Dundgov aimag in late August, 2011 (Source: D. Damiran, 2012). The monitoring site was located in Tsagaandelger soum of Dundgov aimag. Our evaluation of rangeland habitat indicated that the site had loamy-skeletal soils and was in a 10-15 cm Precipitation Zone. Frequency analysis indicated that vegetation present was characteristic of a CaraganaArtemisia/Stipa/Allium community common in the Dry Steppe ecozone. Soils at the site were comprised primarily of wind-blown loamy-skeletal and sandy sediments. Rangeland health Assessment indicated that vegetation had mid-seral status, and that rangeland habitat was in “Fair to Good” ecological condition. Annual forage yield at the site between 1999 and 2011 was obtained from the “forage database” in the Forage Growth (PHYGROW) Model (Figure 31).
50
Sheehy, D., M. Hale, D. Damiran, T. Sheehy, D. Tsogoo, and Sh. Batsukh. 2012. Monitoring change on Mongolian rangelands. Final report for Netherlands-Mongolia Environmental Trust Fund for Environmental Reform (NEMO). 156 pp.
Figure 31. A twelve year profile of annual forage yield at the monitoring point (DG-07). (Source: Forage Growth (PHYGROW) Model, http://glews.tamu.edu/Mongolia). Evaluation of the annual forage yield curve over the 12-year period provided information to support calculation of a realistic annual carrying capacity. The multiple forage yield curves in figure 33 represent the proportion of forage yield allocated to large herbivores that had potential to graze the annual forage produced by the rangeland habitat. Large herbivores do not select equally among different forage plants because some plants are generally preferred over other plants. Relative to plant species comprising the vegetation community at the DG-07 monitoring site, the six herbivores appeared to have similar preference for available forage species. However, allocated forage yield allows carrying capacity to be calculated separately for each large herbivore if significant differences in large herbivore selection of plants existed (Table 10). Table 10. Seasonal carrying capacity of rangeland habitat at the DG-07 monitoring site during 2011. Herbivore Sheep Goat Cattle Horse/Khulan Camel
Daily Feed Demand1/ 1.5 1.0 7.5 8.8 12.5
Winter2/ 39 kg/ha3/ 26 39 5 4 3
Spring 634 kg/ha 422 633 84 72 50
Summer 857 kg/ha 571 857 114 97 68
Fall 305 kg/ha 203 305 41 35 24
1/ Daily feed demand was calculated for each herbivore as follows: BW (kg) * 2.5 % = Daily Feed Demand 2/ Seasons were calculated as 91-day periods in winter, spring, summer, and fall. 3/ Seasonal forage yield was obtained from the 2011 forage yield curve of the DG-07 monitoring curve.
5.4 Adjusted Carrying Capacity Average annual peak forage yield at the DG-07 monitoring site during the 12 years prior to 2011 was 825 kg/ha. Between 1999 and 2004, peak annual forage yield averaged 1380 kg/ha while between 2005 and 2009, peak annual forage yield averaged 300 kg/ha. In 2010 and 2011, peak annual forage yield averaged 750 kg/ha, which was lower but close to the average peak forage growth at the monitoring site during the 12-year period. In each period, there was considerable difference in both peak forage yield and carrying capacity (Table 10).
51
Sheehy, D., M. Hale, D. Damiran, T. Sheehy, D. Tsogoo, and Sh. Batsukh. 2012. Monitoring change on Mongolian rangelands. Final report for Netherlands-Mongolia Environmental Trust Fund for Environmental Reform (NEMO). 156 pp.
Table 10. Adjusted carrying capacity of rangeland in Tsagaandelger soum of Dundgov aimag. Herbivore
Daily Feed Intake (% BW)1/
Sheep Goat Cattle Horse/Khulan Camel
1.5 1.0 7.5 8.8 12.5
12-Year Average Yield2/ 825 kg/ha 550 825 110 93 66
1999-2004 Average Yield 1380 kg/ha 920 920 184 156 110
2005-2009 Average Yield 300 kg/ha 200 200 40 34 24
2010-2011 Average Yield 750 kg/ha 500 500 100 85 60
1/ Daily feed demand was calculated for each herbivore as follows: BW (kg) * 2.5 % = Daily Feed Demand 2/ Seasonal forage yield was obtained from the 2011 forage yield curve of the DG-07 monitoring curve.
During the initial five years of the 12-year period, rangeland carrying capacity was capable of supporting a high stocking rate. In the 4-years following high peak carrying capacity, carrying capacity fell to very low levels. We feel that stocking rate should have been adjusted lower in the following year, and in subsequent years, as the drought continued to affect forage production in that rangeland habitat. 5.5 Calculating Carrying Capacity for a Rangeland Management Unit The Forage Growth (PHYGROW) Model calculates rangeland forage yield at bi-weekly intervals for different scales of rangeland management units (i.e., South Gobi Region, Omnigov aimag, Hanbogd soum, bag pasture management areas, Herder Group rangeland management units, etc.). Forage yield calculations, which are derived from NDVI images, project color-coded forage yield over the area of the aimag (Figure 32).
52
Sheehy, D., M. Hale, D. Damiran, T. Sheehy, D. Tsogoo, and Sh. Batsukh. 2012. Monitoring change on Mongolian rangelands. Final report for Netherlands-Mongolia Environmental Trust Fund for Environmental Reform (NEMO). 156 pp.
Figure 32. Projected bi-weekly forage (kg/ha) available in early September, 2011 throughout the Gobi Region (Source: http://glews.tamu.edu/Mongolia). In early September, 2011, the forage yield at Tsagaandelger Soum in the northeast corner of Dundgov aimag was 800 to a 1000 kg/ha (medium dark green color) which correlated closely with the peak forage yield we obtained during the same time period. Although bi-weekly forage yield projections are currently scaled to the aimag, the forage growth information pertains equally to local-scale rangeland management units. Smaller management units will have similar carrying capacity. The bi-weekly forage yield output provides rangeland managers and herders an opportunity to calculate near-real time carrying capacity to adjust stocking rates to the trend of forage growth during annual or seasonal herbivore use of a rangeland management unit. If the trend approximates forage yield curves of the previous year (s), the rangeland manager and herder will have foresight into conditions that will prevail during subsequent seasons. Although adjusting the stocking rate of any rangeland management unit during the grazing season is difficult, access to seasonal and multi-year carrying capacity will assist rangeland managers and herders in making stocking-rate decisions (i.e., determination of the proper density, duration and timing of herbivore use) to avoid overgrazing of the rangeland management unit in the following year.
5.5 Monitoring Rainfall Impacts on Forage Growth Accurately defining an annual carrying capacity and optimal large herbivore stocking rate of a rangeland management unit is difficult because precipitation, which is variable both within years and between years, directly influences growth and amount of forage available to be grazed. This information is available from the Forage Growth (PHYGROW) model on a near-real time basis (Figure 33).
Figure 33. A twelve year profile of annual forage yield at the monitoring point(DG-07). (Source: http://glews.tamu.edu/Mongolia).
Precipitation was the most important weather factor regulating large herbivore distribution in our study area. Precipitation influenced both amount and timing of annual forage growth. Without adequate amount and seasonal availability of precipitation from rain or snowfall, forage growth in various habitats was
53
Sheehy, D., M. Hale, D. Damiran, T. Sheehy, D. Tsogoo, and Sh. Batsukh. 2012. Monitoring change on Mongolian rangelands. Final report for Netherlands-Mongolia Environmental Trust Fund for Environmental Reform (NEMO). 156 pp.
reduced and drought was induced. Inadequate precipitation reduced the availability of surface drinking water for both livestock and wild herbivores, and increased the potential for conflict between domestic livestock and wildlife that co-used the same rangeland habitat. We used the Modis derived rainfall database in the Forage Growth (PHYGROW) Model to monitor impacts of cumulative annual precipitation on large herbivore grazing use of study area rangeland (Figure 34)
15.00 10.00
5.00
0.00
Winter
Spring
Summer
Fall
2005
0.19
2.89
7.07
7.29
2006
0.21
3.66
10.32
10.60
2007
0.46
3.51
8.15
8.53
Figure 34. Annual cumulative precipitation by season in the SGR (Source: D.P. Sheehy, 2007).
Annual precipitation in the SGR varied between years and seasons. During the winter season (arbitrarily defined as 1 January to 31 March), annual cumulative precipitation was less than 0.5 cm. During the spring season (arbitrarily defined as 1 April to 30 June), between 2.5 and 4.0 centimeters accumulated each year which indicated the SGR receives considerable precipitation during the spring season. Cumulative precipitation during the summer season (arbitrarily defined as 1 July to 30 September) was between 4 and 7 cm which was the seasonal high moisture accumulation. During the fall season (arbitrarily defined as 1 October to 31 December), cumulative precipitation only incrementally increased each of the three years. Comparison of accumulated precipitation between years indicated that 2005 was a drought year in the SGR. During that year, cumulative precipitation at the end of each season was lower compared to cumulative precipitation in 2006 and 2007. Long distance movements of collared khulan were in response to drought conditions of 2005. The high relative amount of precipitation during the spring and summer seasons of 2006 improved large herbivore access to quality forage and drinking water, and scaled down use of rangeland habitat. Observations of khulan indicated less movement and more concentrated habitat use in a much reduced home range area. In 2007, accumulated precipitation in the SE Gobi was higher but more similar to 2005 than 2006. Although khulan were not observed in 2007 during summer and fall seasons, winter and spring observations of khulan were consistent with 2006 observations during the same seasons. Monitoring of cumulative precipitation indicated that annual variation occurred in the SGR (Figure 35). In 2005, the northern portion of the MCP study area received more precipitation during spring, summer
54
Sheehy, D., M. Hale, D. Damiran, T. Sheehy, D. Tsogoo, and Sh. Batsukh. 2012. Monitoring change on Mongolian rangelands. Final report for Netherlands-Mongolia Environmental Trust Fund for Environmental Reform (NEMO). 156 pp.
and fall seasons then the central and southern portions of the study area. The latter two regions received approximately the same amount of precipitation (6 to 7 cm) and both regions had proportional accumulation of precipitation during each season.
14 12 10 8 6 4 2 0
South Central North
2005
2006
Fall
Summer
Spring
Winter
Fall
Summer
Spring
Winter
Fall
Summer
Spring
Ave
Winter
cm.
Cumulative Rainfall
2007
Season-Year
Figure 35. Seasonal cumulative precipitation in the SGR between 2005 and 2007. (Source: D.P. Sheehy, 2011). Seasonal accumulated precipitation in the study area during 2006 was different compared to 2005, both relative to total annual accumulation and seasonal accumulation by study area region Accumulated annual precipitation was higher in all three regions compared to 2005. During winter and spring seasons, the three regions accumulated approximately the same amount of precipitation but during summer, the southern region accumulated two to three centimeters more precipitation compared to the northern and central regions. In 2007, annual precipitation appeared to be more uniformly distributed throughout the study area. The three study area regions appeared to accumulate precipitation at approximately the same rate during spring and summer. All three regions had received most of their annual precipitation by the end of the summer season. Precipitation accumulated equally in the three study area regions during spring and summer. Compared to 2005 and 2006, the study area in 2007 appeared to have average accumulated precipitation that was distributed evenly throughout the study area.
5.6 Monitoring Nutritional Carrying Capacity Although not an integrated component of the Forage Growth (PHYGROW) Model, Fecal Profiling used in conjunction with the forage model facilitates development of a nutritional carrying capacity. During the 2005 study, we used the fecal profiling technique to monitor diet quality of large herbivores in the SGR. Fecal samples deposited by Khulan, cattle, horses, sheep and goats were collected from co-grazed rangeland in the SGR. Samples were analyzed by the Texas A&M University Grazing Animal Nutrition Laboratory (GANL) using Near Infra-Red Spectroscopy (NIRS) fecal profiling techniques. Fecal profiling provided insight into dietary relationships among large herbivores co-grazing the same rangeland during a drought year in the SGR (Figure 36).
55
Sheehy, D., M. Hale, D. Damiran, T. Sheehy, D. Tsogoo, and Sh. Batsukh. 2012. Monitoring change on Mongolian rangelands. Final report for Netherlands-Mongolia Environmental Trust Fund for Environmental Reform (NEMO). 156 pp.
%
Diet Quality 80 70 60 50 40 30 20 10 0
CP DOM
Goat
Sheep
Horse
Cattle
Khulan
Large Herbivore
Figure 36. Dietary quality of co-grazing large herbivores in the SGR during summer 2005) (Source: D.P. Sheehy, 2008). Both horse and khulan had similar dietary Crude Protein (CP) and Digestible Organic Matter (DOM) in their diet, even though CP and DOM dietary levels are slightly higher for khulan. Both equine species have lower dietary CP and DOM compared to the three ruminant livestock species. Sheep, among the ruminant livestock, have highest dietary CP and DOM among the large herbivores, and all three ruminants have higher CP and DOM compared to the two equine species. A possible explanation for the higher CP and DOM in the diets of sheep and cattle compared to goats may be that the two species are bulk roughage foragers while the goat is a selective feeder. If this assumption is correct, then sheep and cattle have access to sufficient herbaceous plant material to allow them to optimize their quantity of forage intake from higher quality grasses and forbs while goats, as selective feeders, are less able to optimize forage intake during the summer season.
5.7 Climate Change Monitoring There has been considerable speculation about the impact of climate change on Mongolian rangeland ecosystems (Okayasu and others 2011, Angerer and others 2011). One speculation is that the Dry Steppe ecozone may contain the threshold NDVI value (0.342) that corresponds with the minimum biomass required to sustain body weight of sheep (Figure 38). The location of the boundary defines separation of equilibrium ecosystems that employ steady state livestock grazing strategies and non-equilibrium ecosystems that employ opportunistic livestock grazing strategies.
56
Sheehy, D., M. Hale, D. Damiran, T. Sheehy, D. Tsogoo, and Sh. Batsukh. 2012. Monitoring change on Mongolian rangelands. Final report for Netherlands-Mongolia Environmental Trust Fund for Environmental Reform (NEMO). 156 pp.
Figure 38. The NDVI threshold boundary (dotted line) between equilibrium and non-equilibrium ecosystems (Source: Okayasu and others, 2011). In our study, we used “divergence from normal forage growth” and the “rainfall” databases in the Forage Growth (PHYGROW) Model to evaluate the impact of climate change on rangeland ecosystems. We evaluated information derived from Forage Growth (PHYGROW) databases over a 12-year period between 1999 and 2010 Divergence from Normal Forage Growth. The “divergence from normal forage growth” database was used to test the assumption that Dry Steppe separated equilibrium and non-equilibrium ecosystems (Figure 40).
Forage Growth Divergence 80.0
%
60.0 40.0
Dry Steppe
20.0
Semi-arid steppe
0.0 -20.0
Middle Desert 90
181
273
-40.0
365
North Desert South Desert
-60.0 -80.0 Seasons
Figure 40. Divergence from normal seasonal forage growth (90, 181, 273, and 365 days) during an annual forage growth cycle (Source: D.P. Sheehy, 2012). The greatest divergence in forage growth (positive or negative) in the five ecozones occurred during the initial 90-days of growth. During the first 90-day period, divergence was positive except for the North Desert ecozone, which was highly negative (-60 %). The other ecozones had positive divergence from normal forage growth during the 90-day period. At 181-days of annual forage growth, the five ecozones
57
Sheehy, D., M. Hale, D. Damiran, T. Sheehy, D. Tsogoo, and Sh. Batsukh. 2012. Monitoring change on Mongolian rangelands. Final report for Netherlands-Mongolia Environmental Trust Fund for Environmental Reform (NEMO). 156 pp.
had reached zero or had slightly positive divergence values. The trend in divergence during the remainder of the 365-day period was slightly negative except for the Dry Steppe ecozone, which had a slight positive increase in divergence until 273 days of forage growth was reached. Among the five ecozones, only Dry Steppe and Middle Desert Steppe ecozones maintained a positive divergence from normal forage growth at 365 days. We feel that “divergence from normal forage growth” as used in our study does support the contention that the Dry Steppe contains the critical threshold between equilibrium and non-equilibrium ecosystems. In establishing the threshold, the type and amount of precipitation received by the different ecozones was the critical factor influencing threshold location and the timing, amount, and kind of forage growth prevailing in the five ecozones. We feel that forage growth curves in non-equilibrium desert ecosystems are highly influenced by convection type of precipitation events, while the two Steppe ecozones were more influenced by regional precipitation events. Although vegetation types and plant communities characteristic of other ecozones were observed at specific locations in an ecozone, their occurrence at those locations was influenced primarily by prevailing topo-edaphic conditions. Aridity as a Climate Change Factor. Rainfall and forage growth databases in PHYGROW were used to evaluate the long-term impact of increasing aridity (i.e., drought) on forage growth in the five study area ecozones. We summarized annual rainfall and forage growth over a 12-year period between 1999 and 2010 (Figure 41).
Study Area Cumulative Rainfall 20.00 S-D Steppe
15.00 cm.
N. Desert 10.00
Dry Steppe S. Desert
5.00
M.Desert (S)
0.00 1999 2000 2001 2002 2003 2004 2005 2006 2007 2008 2009 2010 Year
Figure 41. Peak annual cumulative rainfall in the five ecozones between 1999 and 2010 (Source: D. P. Sheehy, 2012). During the 12-year interval, the peak amount of annual cumulative rainfall occurring in the five ecozones increased between 1999 and 2003, except in the Middle Desert Steppe and South Desert ecozones. In the latter two ecozones, cumulative rainfall decreased in 2001 and 2002, which corresponded with the drought and dzud winters that occurred during that time. Between 2003 and 2005, cumulative rainfall in the five ecozones declined from a 12-year peak to a 12-year low, and remained low between 2005 and 2007. Beginning in 2007, cumulative rainfall again trended higher, with rainfall in the five ecozones reaching the highest amount recorded for any ecozones in 2005. The Middle Desert Steppe had the highest cumulative peak rainfall of all ecozones during the 11-year period.
58
Sheehy, D., M. Hale, D. Damiran, T. Sheehy, D. Tsogoo, and Sh. Batsukh. 2012. Monitoring change on Mongolian rangelands. Final report for Netherlands-Mongolia Environmental Trust Fund for Environmental Reform (NEMO). 156 pp.
During the same 12-year period, the trend of peak forage growth in the five ecozones approximated the trend of cumulative peak rainfall (Figure 42).
Annual Peak Forage Yield 1200.00
kg/ha
1000.00
S-D Steppe
800.00
N.Desert
600.00
Dry Steppe
400.00
S. Desert
200.00
M. Desert (S)
19 99 20 00 20 01 20 02 20 03 20 04 20 05 20 06 20 07 20 08 20 09 20 10
0.00
Year
Figure 42. Annual peak forage growth in the five study area ecozones (Source: D.P. Sheehy, 2012). Forage growth peaked in 2003, declined to lowest levels between 2003 and 2008, and trended higher beginning in 2008. The Dry Steppe ecozone had highest peak annual forage growth while the South Desert ecozone had lowest peak annual forage growth throughout the 11-year period. The low peak annual forage growth of the five ecozones correlated closely with the low peak cumulative rainfall. Peak annual forage growth in the Dry Steppe ecozone appeared to be most responsive to cumulative rainfall while the South Desert ecozone appeared to be least responsive to changes in cumulative rainfall. We feel that tracking cumulative annual rainfall provides a way to track climate change impacts on vegetation growth, especially the higher aridity associated with drought. Although a one-year drought may not reduce the resilience of diverse ecological sites, a multi-year drought across ecozones that is not accompanied by reductions in the large herbivore stocking rate will almost certainly have a negative impact on ecological condition of vegetation communities in the different ecozones. Observations of drought impacts in the Dry Steppe ecozone during our study support this contention.
59
Sheehy, D., M. Hale, D. Damiran, T. Sheehy, D. Tsogoo, and Sh. Batsukh. 2012. Monitoring change on Mongolian rangelands. Final report for Netherlands-Mongolia Environmental Trust Fund for Environmental Reform (NEMO). 156 pp.
6. Conclusions Mongolian rangeland has supported a unique way of life that has changed little over a thousand years. Even today, a way of life focused on livestock herding remains relevant and important to Mongolia. Rangeland and space are synonymous, and provide the context in which most Mongolians have defined Mongolia as a country and a people. However, transition from socialism to a capitalist, market driven economy has shaken the foundation supporting this definition of Mongolia and its people; the next 20 years could very likely change this perception entirely as overuse by too many livestock, increasing aridity as a factor in climate change, and economic development, especially resource extraction activities and associated infrastructure development, change the dynamics of rangeland use. 6.1 Monitoring Rationale There are many reasons that rangeland should be monitored, including:
Monitoring rangeland provides policy makers, managers and users with a better understanding of rangeland.
Monitoring of grazing impacts on rangeland resources is a critical activity needed to ensure sustainable use of a primary natural resource.
Vegetation comprising forage and browse for large herbivores should be periodically monitored and evaluated to detect change in ecological condition. Vegetation and water are the primary factors influencing use by large wild and domestic herbivores.
Large and small scale mining is supplanting livestock grazing as the primary rangeland use. Monitoring of impacts from mining on rangeland is critical to develop and implement equitable policies preventing indiscriminate exploitation of rangelands..
6.2 Monitoring Conclusions Conventional rangeland monitoring techniques described in this paper have generally been available in some form since the latter part of the 20th Century. New monitoring techniques exist that facilitate monitoring at different scales and for different purposes. Our study demonstrated use of both conventional survey techniques and near-real time techniques to improve our understanding of how rangeland is impacted by use. From our study of applied rangeland monitoring, we learned that: Rangeland Classification. Classifying rangeland to plant communities, vegetation types, and ecozones enhanced our ability to interpret and evaluate information collected in our study. Although new classification systems are becoming available, access to digitized rangeland maps from the MongolianRussian Complex Ecological Survey (1996) allowed us to classify and organize rangeland into meaningful sub-units. Both plant presence and vegetation yield at each monitoring site were analyzed, and used to compile preliminary Ecological Site Descriptions and evaluate Rangeland Health at each site. Soil Erosion: Analysis of rangeland soils in our study indicated that soils tend to be sandy in desert ecozones while soils in Steppe ecozones have higher clay and loess content. Herbaceous vegetation dominated steppe ecozones while shrub-dominant communities dominated vegetation in desert ecozones. Field observations and soil profile measurements indicated that: i) water erosion is occurring only on
60
Sheehy, D., M. Hale, D. Damiran, T. Sheehy, D. Tsogoo, and Sh. Batsukh. 2012. Monitoring change on Mongolian rangelands. Final report for Netherlands-Mongolia Environmental Trust Fund for Environmental Reform (NEMO). 156 pp.
slopes with significant gradients (i.e. hills, scarps and low mountain ranges). Only here does water accumulate in sufficient volume and move with sufficient velocity to cause the transport of geologic and soil debris, ii) wind-blown sandy material originated from parent material outside the study area., iii) there is minor wind erosion from vehicle tracks and livestock concentration points such as wells and winter camps. Ecosystem Status. A rigorous evaluation of rangeland habitat is necessary to gain an understanding of ecological relationships and the impact utilization will have on rangelands. Our study closely evaluated ecological factors shaping rangeland habitat. Our conclusion generally supports the contention of Okayasu and others (2011) that the Dry Steppe ecozone is a “boundary” between equilibrium and nonequilibrium ecosystems. We believe “boundary monitoring” should be a component of an inclusive monitoring system designed to monitor changes in regional rangeland habitat. Our study does not support the contention that the threshold NDVI value (0.342) corresponds with the minimum biomass required to sustain body weight of sheep. Biomass alone is not a good indicator of how large herbivores will respond to different rangeland habitats or changes in habitat.. Herders in Dry Steppe and Semi-Desert Steppe ecozones tend to employ steady state livestock grazing strategies while herders in Desert ecozones employ opportunistic livestock grazing strategies. Greater and more widespread precipitation events in steppe ecozones, along with more fertile soils, supports growth of herbaceous vegetation. In our study area, inclusions of vegetation communities supporting either grazing strategy were common in both zonal types. Also, high densities of livestock around desert zone water sources created impacts in desert rangeland that were similar to impacts from overgrazing in steppe rangeland. Rangeland Utilization. Monitoring rangeland utilization with a combination of NDVI and/or LANDSAT imagery and GPS collared large herbivores indicated that highly mobile herbivores such as Khulan and Gazelle needed access to large-scale rangeland landscapes to meet forage, water and security requirements. The MCP containing khulan locations encompassed approximately 934914 ha and included the SW portion of Dornogov aimag, the SE corner of Dundgov aimag, and the easternmost portion of Omnigov aimag. Similar monitoring of herded livestock indicated the dependency of livestock on wells or surface water, and the longer-term grazing pressure on vegetation within close (5-7 km) proximity to a water source. Grazing Impacts. Major impacts of livestock on rangeland were closely related to the timing and duration of grazing (carrying capacity) and the number of animals grazing a specific rangeland area (i.e., number/unit area) or stocking rate. Most impacts in both equilibrium and non-equilibrium ecosystems occurred near and around water sources and herder camps. Location of water sources and distance between water sources had a major influence on both rangeland and animal condition. Multi-year droughts followed by severe winters were especially hard on livestock in poor body condition. Plant presence had declined between measurerment times in many of the measured points. Rangeland Health Assessment at 38 monitoring sites in our study area indicated that rangeland condition was “Fair to Good” at more than 60 % of the rangeland sites evaluated. Current constraints to large wild herbivore use of rangeland were mostly related to weather and limited access to feed and water. Large wild herbivores in the SGR must respond to the same constraints as livestock but currently retain the mobility to move to rangeland with better capacity to meet their forage and water needs, thus avoiding overstocking.. 6.3 Rangeland Monitoring
61
Sheehy, D., M. Hale, D. Damiran, T. Sheehy, D. Tsogoo, and Sh. Batsukh. 2012. Monitoring change on Mongolian rangelands. Final report for Netherlands-Mongolia Environmental Trust Fund for Environmental Reform (NEMO). 156 pp.
Rangeland monitoring methods such as Rangeland Health Assessment are not designed to: i) identify the cause of resource use problems, ii) independently make grazing and other management changes, iii) monitor land use directly or determine trend, or iv) independently generate national or regional assessments of rangeland health (Pellant and others, 2005). These limitations can be overcome by integrating conventional rangeland survey and monitoring with longer-term monitoring. The PHYGROW Forage Growth Model can be used to create a dynamic process capable of monitoring rangeland on a near-real time basis. The integrated protocol will be able to detect pastureland trend relative to climate and animal utilization induced change. Annual Livestock grazing impacts on local rangeland should be monitored at key representative grazing areas in a pasture management unit. The number of monitoring sites depends on the number of key grazing areas and/or Ecological Sites in the rangeland unit being monitored. Sites should be selected by soum government staff (Mongol Mal and Land Officer) and herders grazing livestock in the rangeland management unit. All herders grazing the pasture management area should have an Annual Operating Contract that is an agreement between government and herders on management of livestock grazing and includes coordination of livestock grazing management strategies with utilization/residue sampling. Large-scale monitoring of rangeland will require different monitoring techniques. A number of techniques suitable for large-scale monitoring of rangeland have been described in our study including time-interval site monitoring and near-real time monitoring of rangeland habitat. The Forage Growth (PHYGROW) modeler, which is currently being established as a national level risk management tool, can also be used to monitor Mongolian rangelands by:
Evaluating trends in vegetation growth potential by evaluating weather databases at each monitoring point to assess climate impacts on Rangeland Health,
Evaluate changes in species composition of plant palatability groups at the monitoring site to establish trends related to animal grazing impacts on vegetation, and
Integrate weather information (i.e., temperature, precipitation, and solar radiation) and vegetation/soil attributes (NDVI) with measured site attributes (i.e., the species composition, cover, density, and productivity of vegetation and soils) to produce near-real time estimates of forage growth (kg/ha).
Our study provided insight into various monitoring techniques that will facilitate improved management of rangelands. We provided examples of their use as monitoring techniques with application to Mongolian rangelands. These techniques can be most effectively used to monitor rangeland if used within a national rangeland monitoring framework that is initiated at local scales, and is then scaled-up to higher levels. We feel that a rangeland monitoring system that includes conventional rangeland survey techniques, time-interval site monitoring, and near-real time monitoring of large herbivore grazing impacts is critical for the future of Mongolian rangelands. 6.4 National Monitoring Framework At least three types of monitoring are necessary to effectively manage Mongolian rangeland. Local-scale monitoring is needed to determine the impacts of large herbivore grazing on rangeland vegetation and soils. Large-scale monitoring is needed to determine regional and zonal impacts caused by a combination of factors that include: i) grazing by large herbivores, ii) climate induced droughts and dzuds, and iii) impacts associated with mining and economic infrastructure development. Time comparison monitoring is needed to determine changes in ecological condition and/or health of rangeland.
62
Sheehy, D., M. Hale, D. Damiran, T. Sheehy, D. Tsogoo, and Sh. Batsukh. 2012. Monitoring change on Mongolian rangelands. Final report for Netherlands-Mongolia Environmental Trust Fund for Environmental Reform (NEMO). 156 pp.
Monitoring Impacts of Grazing. Direct impacts of large herbivore grazing on rangeland ecosystems are usually measured at non-randomly selected monitoring sites in a rangeland management unit. Following selection of monitoring sites, a methodology to measure annual impacts of large herbivore use, especially impacts from grazing or browsing, should be selected and applied (Interagency Technical Reference 1734-3 1999). In our study we demonstrated the use of the Landscape Appearance-Key Forage Area monitoring method. Although a number of different methodologies are available to determine short-term impacts of large herbivore grazing, the “key forage area” method is quite suited to use in the Mongolian rangeland environment.. The key forage area should be identified as to Ecological Site if the site has not been previously described (Annex 7). GPS coordinates at the center of the measurement “macroplot” should be recorded and the point location fixed on soum land-use maps. Key areas should be within a unit of rangeland customarily used by one or more livestock herders (i.e., a sub-unit of the bag similar to the traditional seasonal rangeland management areas described by Sheehy and Damiran, In review). Within the defined rangeland unit, key grazing areas are monitored annually and/or seasonally to provide annual information on impacts of grazing in the rangeland management unit. This technique can be used to adjust the timing, duration and density of livestock grazing in the seasonal rangeland management unit. The information should also be included in soum databases established for herder households using specific rangeland management units. Information about grazing impacts on site condition should be used to formulate Annual Operating Instructions (AOI) that are the basis for implementing annual grazing plans designed to mitigate impacts of animal grazing on the rangeland management unit. . Monitoring Carrying Capacity. Defining the area of the rangeland management unit to be monitored is an important element of monitoring annual impacts of large herbivore grazing on local rangeland. Without knowing the area and boundaries of the management unit, it is difficult to determine conventional rangeland carrying capacity or determine optimal animal stocking rates. Various size and area of management units exist including seasonal pastures traditionally used by a few herders, rangeland management units controlled by members of a Pasture Use Group (PUG), and administrative pasture management units such as the bagh, soum, and aimag. Local-scale monitoring should focus on the rangeland management unit within the bag, or the bag itself, as an administrative management unit. Defining carrying capacity and optimal livestock stocking rate of a rangeland management unit or an administrative rangeland unit is difficult because precipitation, which is variable both within years and between years, directly influences growth and amount of forage available to be grazed. Adjusting livestock demand for forage with forage supply is difficult, especially within annual timeframes. Consequently, average stocking rates established over a period of years usually prevail, even though forage balance may be positive or negative relative to the average livestock demand for forage (Maday 2012). In our study we demonstrated how to use the Forage Growth (PHYGROW) Model to estimate an optimal carrying capacity. Longer term Monitoring The Forage Growth (PHYGROW) model is a robust and useful method for monitoring impacts of large herbivore grazing and climate change on rangeland ecosystems. A salient feature of the model is the integration of many of the previously described monitoring techniques into a rangeland monitoring protocol useful to the rangeland manager. Rangeland Health. Rangeland Health Assessment is increasingly being used to monitor condition of rangeland. However, Rangeland Health Assessment is not designed to: i) identify the cause of resource use problems, ii) independently make grazing and other management changes, iii) monitor land use directly or determine trend, and iv) independently generate national or regional assessments of rangeland health (Pellant and others, 2005). These limitations can be overcome by integrating conventional rangeland survey and monitoring with Rangeland Health Assessment. The Forage Growth (PHYGROW)
63
Sheehy, D., M. Hale, D. Damiran, T. Sheehy, D. Tsogoo, and Sh. Batsukh. 2012. Monitoring change on Mongolian rangelands. Final report for Netherlands-Mongolia Environmental Trust Fund for Environmental Reform (NEMO). 156 pp.
model enables dynamic monitoring of rangeland at various scales on a near-real time basis. The integrated monitoring protocol can be used to detect climate and grazing induced change to Rangeland Health. 6.5 Economic Infrastructure Development. We have concluded that economic infrastructure development will have substantial impact on rangeland condition and rangeland users. Although the two other major impacts (i.e., grazing and climate change) will continue to affect rangeland, we think these impacts will now become additive to impacts from mining and associated infrastructure development. Licensed and unlicensed mineral extraction, which is occurring at various scales, is already changing rangeland dynamics in the SGR and elsewhere throughout Mongolia (Sheehy and others, 2009). Infrastructure development associated with large scale mining, such as the Tavan Tolgoi and Oyu Tolgoi mines, is already having a major impact on the pastoral livestock production system and endangered populations of large wild herbivores. Legal and illegal extraction of minerals is becoming pervasive throughout Mongolia. Most rangeland in Mongolia has already been licensed for exploration to international and national companies. This includes large foreign companies such as Rio Tinto that developed the Oyu Tolgoi mine complex and the government owned Tavan Tolgoi, many smaller government and private companies that have obtained licenses to explore specific areas of rangeland, and thousands of illegal “ninja” miners who use smallscale mining to support their livelihood. The latter type of mining has become so pervasive that international projects and local governments have developed and tested programs designed to legalize these activities by forming cooperatives in exchange for greater control of mining activities. With miners operating legally, services can be provided to the miners and the government will benefit through increased tax revenue. However, these efforts make no attempt to address damage to rangelands or rehabilitation of damaged rangelands Previous studies in the SGR have addressed mining and associated impacts on rangeland habitat used by large herbivores (Kaczensky and others, 2006; Sheehy and others, 2009). These papers provided numerous recommendations and suggestions to mitigate impacts of economic development and associated infrastructure development on the pastoral livestock system and large wild herbivores in the SGR. The proposed new railway from Tavan Tolgoi and Oyu Tolgoi to access international markets is an example of mining associated infrastructure and policy development (Figure 43).
64
Sheehy, D., M. Hale, D. Damiran, T. Sheehy, D. Tsogoo, and Sh. Batsukh. 2012. Monitoring change on Mongolian rangelands. Final report for Netherlands-Mongolia Environmental Trust Fund for Environmental Reform (NEMO). 156 pp.
Figure 43. Route of proposed railroad through the SGR and Eastern Steppe region of Mongolia. (Source: MIAT Mongolian Airlines In-flight Magazine, 2012) The proposed railway route in figure 43 will have a major impact on Khulan and Gazelle populations in the SGR and Gazelle in the eastern steppe unless recommendations from earlier studies are incorporated into the design, building, and operation of the new railway. Previous studies with GPS collared Khulan have clearly shown that Khulan, which is an endangered species, rely on their mobility to escape drought. In our study of collared Khulan selection of rangeland habitat, NDVI analysis indicated that Khulan will travel long distances to access higher quality forage. Unless adequate structural modifications and protection from increased human intrusion are incorporated into the design of the railway, Khulan and Gazelle will essentially be confined to a narrow strip of winter rangeland habitat between the border with China and the new railway. Mr. Batzaya Baasandorj, Chief Executive Officer of Mongolian Railway State Owned Shareholding Company (MTZ) was quoted by MIAT Mongolian Airlines In-flight Magazine as saying “One of the objective for the railway policy is to enable to reach seaborne markets with Mongolian mining products.” In a further quote, Mr. Baasandorj observes that “We expect the new railroads to be nature friendly.” and “… We understand importance to avoid a mistake often incurred in infrastructure to save in basic capital investment and to spend all in operation, and to ensure balance.” To ensure that the new railroad is nature friendly, the MNET should monitor all aspects of railway design and construction relative to impacts on Khulan and Gazelle and other large wild herbivores such as Ibex and Argali. We feel a critical present need of Mongolian resource management is a functioning and effective Natural Resource Conservation System (Sheehy et al. 2009). In this natural resource conservation system, rangeland monitoring will be a responsibility of the government, and a functioning rangeland monitoring system will, by necessity, involve several Mongolian government institutions and administrative levels. A major component of the system would be monitoring of rangeland condition and impacts of use. A number of relevant rangeland monitoring techniques useful in resolving issues associated with rangeland use were described and demonstrated in this study and elsewhere (Sheehy et al., In Review). We demonstrated: i) conventional techniques designed to measure ecological change in rangeland habitat as an indicator of degradation, ii) tracking large herbivores with GPS and NDVI to determine larger-scale
65
Sheehy, D., M. Hale, D. Damiran, T. Sheehy, D. Tsogoo, and Sh. Batsukh. 2012. Monitoring change on Mongolian rangelands. Final report for Netherlands-Mongolia Environmental Trust Fund for Environmental Reform (NEMO). 156 pp.
herbivore use of rangeland habitat and seasonal home range area, and iii) used a forage growth model to establish carrying capacity of rangeland management units and relate zonal forage growth to increasing aridity. A rangeland monitoring system will need to focus on near-real time technologies because conventional techniques of monitoring will be unable to match the rate at which climate change and economic infrastructure development impact and change rural areas. Conventional monitoring techniques should be implemented but the focus should be on integrating near-real time techniques at all levels of government administration. Some technological components of a near-real time natural resource monitoring system are already operating and available in Mongolia, including:
The Forage Growth (PHYGROW) model will be actively monitoring rangeland throughout Mongolia. Since this model is accessible via the internet, and all Mongolian soums anticipate internet links in the near future, the model will facilitate monitoring of rangeland forage growth and large herbivore use of rangeland nationally. NAMHEM is the host unit for operating and providing output to other users. .
Google Earth images of Mongolian rangeland are accessible via the internet. Linking of images with GPS coordinates improves capacity of resource managers to track changes to rangeland on a near-real time basis at all administrative levels.
Low and high resolution satellite images such as NDVI and LANDSAT, linked with GPS tracking technology, can be used to establish large herbivore habitat preferences and home ranges. These technologies are especially useful to track large wild herbivores. It is proposed that MNET use these techniques, and others, to census large wild herbivores populations, determine preferred rangeland habitats, and monitor large herbivore movements
Conventional monitoring will continue to be part of a natural resource monitoring system, especially at soum level rangeland management units. It is proposed that soum government staff (i.e., land officer, environmental inspector, and Mongol Mal technicians monitor impacts of annual use and local economic development activities. The soum government monitoring staff would also have access to Google Earth and the Forage Growth (PHYGROW) Model.
66
Sheehy, D., M. Hale, D. Damiran, T. Sheehy, D. Tsogoo, and Sh. Batsukh. 2012. Monitoring change on Mongolian rangelands. Final report for Netherlands-Mongolia Environmental Trust Fund for Environmental Reform (NEMO). 156 pp.
References ADB (Asian Development Bank). 1997. Mongolia Extensive Livestock Production System. Angerer, J., G.D. Han, I. Fujisaki, and K. Havstad. 2008. Climate change and ecosystems of Asia with emphasis on Inner Mongolia and Mongolia. Rangelands 30 (3): 46-51. Damiran, D., T. DelCurto, E. Darambazar, P. L. Kennedy, R. V. Taylor, and A. A. Clark. 2007. Northwestern bunchgrass prairie monitoring points databases. Union, Oregon, USA: Eastern Oregon Agricultural Research Center, Oregon State University. Damiran, D., T. DelCurto, E. Darambazar, R. A. Riggs, M. Vavra, and J. G. Cook. 2008. Monitoring sites databases: Transitional forested rangelands in the Blue Mountains of Eastern Oregon. Circular of information No. 6. Union, Oregon, USA: Eastern Oregon Agricultural Research Center, Oregon State University. Damiran. D. 2012. Untitled Graphic. University of Saskatchewan. Saskatoon, SK, Canada Dornogov Office of Statistics. 2005. Personal Communication. Sainshand, Dornogov Province, Mongolia. Interagency Technical Reference 4400-3. BLM National Business Center. Denver, CO. Interagency Technical Reference. 1999. Qualitative Assessment-Landscape Appearance Method. US Johnson. D.E. 2007. Untitled Graphic. Oregon State University. Corvallis, OR Kaczensky, P., D.P. Sheehy, C. Walzer, D.E. Johnson, and C.M. Sheehy. 2006. Room to roam? The threat to Khulan (Wild Ass) from human intrusion. Mongolia Discussion Papers, East Asia and Pacific Environment and Social Development Department. World Bank. Washington D.C. Ministry of Nature, Environment, and Tourism, 2002. Land Cover Graphic. Ulaanbaatar, Mongolia. Morisita, M. 1959. Measuring of the dispersion and analysis of distribution patterns. Memoires of the Faculty of Science, Kyushu University, Series E. Biology. 2:215–235. National Range and Pasture Handbook, 3.1– 1, rev.1, 2003 National Research Council Committee on Rangeland Classification.1994.Rangeland health: new methods to classify, inventory and monitor rangelands. Washington, D.C. 180p Neter, J., W. Wasserman, and M.H. Kutner. 1983. Applied Linear Regression Models. Richard D. Irwin, Inc. Homewood, IL. 547p. Okayasu, T., M. Muto, U. Jamsran, and K. Takeuchi. 2007. Spatially heterogeneous impacts on rangeland after social system change in Mongolia. Land Degradation and Development. 18: 555-566. Oregon State University. 2006. Untitled Graphic. Corvallis, OR
67
Sheehy, D., M. Hale, D. Damiran, T. Sheehy, D. Tsogoo, and Sh. Batsukh. 2012. Monitoring change on Mongolian rangelands. Final report for Netherlands-Mongolia Environmental Trust Fund for Environmental Reform (NEMO). 156 pp.
Ariunsuren, P, D. Damiran, and P. Stevens. 2009. Results of assessment of the current status and degree of disturbance of the desert-steppe rangelands of western Mongolia . In: Proc. Soils & Crops conference, 25-26 February 2009. Saskatoon, SK; Canada. Pellant, M.., P. Shaver, D.A. Pyke, and J.E. Herrick. 2005. Interpreting indicators of rangeland health (4). Tech. Ref. 1734-6. USDI-BLM National Science and Technology Center. Denver, CO. 122p. Rangelands. 2010. Special issue on ecological sites. Society for Range Management. Vol.32 (6). Russian-Mongolian Complex Ecological Survey. 1997. Sh. Ouyntuya, D. Damiran, P. Stevens, B. Dorj, D. Azzaya. 2010. Determining major climatic factors and their variations in the central agricultural region of Mongolia . In: Proc. Soils & Crops conference, 24-26 February 2010. Saskatoon, Saskatchewan, Canada. Sheehy, D. P., P.J. Thorpe, and B. Kirychuk. 2006. Rangeland, livestock and herders revisited in the northern pastoral region of China. In: Rangelands of Central Asia: Proc. of the Conference on Transformations, Issues, and Future Challenges. RMRS-P-39: 62-81. Sheehy, D.P. 1996. Sustainable livestock use of pastoral resources. In: Bruan, O. and O. Odegaard (eds.) Mongolia in Transition: Old Patterns, New Challenges. Nordic Institute of Asian Studies. Copenhagen, Denmark. Sheehy, D.P. and D. Damiran. In Review. Assessment of Mongolian Rangeland Condition and Trend. Netherlands-Mongolia Trust Fund for Environmental Reform. World Bank. Washington D.C. Sheehy, D.P. and D.E. Johnson. 1994. Untitled Graphic. Oregon State University. Corvallis, OR. Sheehy, D.P., C.M. Sheehy, D.E. Johnson, D. Damiran, and M. Fiemingo. 2010. Livestock and Wildlife in the Context of Development in the Southern Gobi Region, with special attention to Wild Ass. Mongolia Discussion Papers, East Asia and Pacific Sustainable Development Department. World Bank. Washington, D.C. Sheehy. C.M. 2007. Untitled Graphic. ICAPS. Wallowa, OR Sheehy. C.M. 2011. Untitled Graphic. University of California-Davis. Davis, CA Sheehy. C.M. 2012. Untitled Graphic. University of California-Davis. Davis, CA Sheehy. D. P. 2012. Untitled Graphic. ICAPS. Wallowa, OR Stuth, J., J. Angerer, R. Kaitho, K. Zander, J. Bucher, W. Hamilton, R. Conner, and D. Inbody. 2003. The Livestock Early Warning System (LEWS): Blending technology and the human dimension to support grazing decisions. Center for Natural Resource Information Technology, Texas A&M University. College Station, TX.
68
Sheehy, D., M. Hale, D. Damiran, T. Sheehy, D. Tsogoo, and Sh. Batsukh. 2012. Monitoring change on Mongolian rangelands. Final report for Netherlands-Mongolia Environmental Trust Fund for Environmental Reform (NEMO). 156 pp.
Annexes
3 4 5 6 7 1 2 3 4 5 6 7 8 9 10 1 2 3
Slope
2
Aspect
1
Site ID DG0001 DG0006 DG0007 DG0034 DG0035 DG0036 DG0038 DO0001 DO0002 DO0003 DO0004 DO0005 DO0015 DO0016 DO0023 DO0028 DO0029 UG0037 UG0038 UG-
Start Elevation
№
Establishe d Date
Annex 1a: Location and description of permanent monitoring sites in the study area.
45.17033
108.46083 1083 165
3
45.30371
107.96959 1139 359
4
46.42533
108.23348 1268 160
1
44.81615
107.73573 1071 320
2
46.33413
107.78932 1360 100
3
46.63862
108.02813 1260 154
0
45.90213
108.21507 1231 186
2
45.85617
108.85750 1163 240
2
44.87433
109.13683 1100
90
1
44.36483
108.22667 1130
20
2
44.04583
108.02367 1159
0
0
44.05200
108.51233 1355
0
2
43.40758
108.18338
55
3
42.72695
108.74855 1110 146
1
8/20/2005 Dornogov, Airag
45.49183
109.78427
995 272
2
8/21/2005 Dornogov, Airag Dornogov, 10/2/2005 Saikhandulaan
45.68608
109.14720 1134 127
2
44.96347
109.22940 1089 255
7
7/12/2005 Omnigov, Manlai
43.57317
107.09565 1120
90
3
7/12/2005 Omnigov, Manlai 7/12/2005 Omnigov, Manlai
43.78008 44.01208
107.02778 1185 350 106.85964 1321 80
3 2
6/3/2005 8/16/2005 9/21/2005 9/22/2005 9/21/2005 9/21/2005 9/22/2005 6/3/2005 6/3/2005 6/4/2005 6/4/2005 6/4/2005 8/18/2005 8/19/2005
Aimag, sum Dundgov, Undurshil Dundgov, Undurshil Dundgov, Tsagaandelger Dundgov, Undurshil Dundgov, Tsagaandelger Dundgov, Tsagaandelger Dundgov, Bayanjargalan Dornogov, Dalanjargalan Dornogov, Saikhandulaan Dornogov, Mandakh Dornogov, Mandakh Dornogov, Mandakh Dornogov, Khantabulag Dornogov, Khantabulag
Start Latitude
Start Longitude
845
69
Sheehy, D., M. Hale, D. Damiran, T. Sheehy, D. Tsogoo, and Sh. Batsukh. 2012. Monitoring change on Mongolian rangelands. Final report for Netherlands-Mongolia Environmental Trust Fund for Environmental Reform (NEMO). 156 pp.
4 5 6 7 8
0039 UG0040 UG0044 UG0045 UG0046 UG0047
7/12/2005 Omnigov, Manlai
44.27798
106.67797 1283 230
3
8/17/2005 Omnigov, Manlai
44.21052
107.43993 1115
20
1
8/17/2005 Omnigov, Manlai
43.91695
107.49322 1158
65
3
8/17/2005 Omnigov, Manlai Omnigov, 8/18/2005 Khanbogd
43.74780
107.84267
885 139
1
43.20652
108.01132
890 358
1
Annex 1b. Monitoring sites, ecological zones, soum and vegetation type code number from the 1995-96 Mongolian-Russian (M-R) Complex Ecological Survey. Site ID
Ecological Zones/Location
M-R Veg-type Code
Dry and Semi-Desert Steppe 22-27 DO-0028
Dornogov, Airag
26
DO-0023
Dornogov, Airag
27
DO-0001
Dornogov, Dalanjargalan
26
DG-0038
Dundgov, Bayanjargalan
26
DG-0035
Dundgov, Tsagaandelger
26
DG-0036
Dundgov, Tsagaandelger
22
DG-0007
Dundgov, Tsagaandelger
22
Semi-Desert (North) 29-32 DO-0029
Dornogov, Saikhandulaan
30
DO-0002
Dornogov, Saikhandulaan
32
DG-0034
Dundgov, Undurshil
32
DG-0006
Dundgov, Undurshil
29
DG-0001
Dundgov, Undurshil
29
Middle Desert (Steppified) 33-36 OT-8R
Omnigov, Khanbogd
34
OT-7M
Omnigov, Khanbogd
34
OT-6M
Omnigov, Khanbogd
34
OT-10W
Omnigov, Khanbogd
33
UG-0040
Omnigov, Manlai
35
UG-0039
Omnigov, Manlai
35
OT-9W
Omnigov, Khanbogd
36
UG-0038
Omnigov, Manlai
34
UG-0037
Omnigov, Manlai
33
OT-12W
Omnigov, Khanbogd
36
DO-0016
Dornogov, Khantabulag
33
OT-11W
Omnigov, Khanbogd
35
DO-0003
Dornogov, Mandakh
34
UG-0045
Omnigov, Manlai
34
UG-0044
Omnigov, Manlai
36
South Desert (True) 37-41 UG-0047
Omnigov, Khanbogd
39
UG-0046
Omnigov, Manlai
38
70
Sheehy, D., M. Hale, D. Damiran, T. Sheehy, D. Tsogoo, and Sh. Batsukh. 2012. Monitoring change on Mongolian rangelands. Final report for Netherlands-Mongolia Environmental Trust Fund for Environmental Reform (NEMO). 156 pp. DO-0015
Dornogov, Khantabulag
39
OT-5R
Omnigov, Khanbogd
37
DO-0004
Dornogov, Mandakh
40
OT-4R
Omnigov, Khanbogd
37
OT-3R
Omnigov, Khanbogd
37
OT-1R
Omnigov, Khanbogd
40
OT-13W
Omnigov, Khanbogd
39
OT-2R
Omnigov, Khanbogd
True Desert 56-64 59
Annex 2. Forage Growth (PHYGROW) Model The Livestock Early Warning System (LEWS): Blending technology and the human dimension to support grazing decisions by Jerry Stuth, Jay Angerer, Robert Kaitho, Kristen Zander, Abdi Jama, Clint Heath, Jim Bucher, Wayne Hamilton, Richard Conner, and David Inbody
The Livestock Early Warning System (LEWS) technology relies on establishment of a series of carefully selected monitoring sites where vegetation measured from those sites are reflected in a rangeland production model. Associated soils, grazing rules and satellite-based weather data is used to produce daily estimates of forage production, deviation from normal forage on offer and associated percentile ranking. Advanced geostatistics coupled with NDVI greenness data is used to map areas of forage deficiencies and excesses as well as provided 90 day forecasts updated weekly. Timely issuance of reports on forage conditions relative to expected long-term averages updated every 7 to 10 days with 90-day forage forecasts and projected probabilities of precipitation and temperature issued monthly provides a new dimension to rangeland monitoring. This same technology allows indexing of where forage conditions are relative to historical response (percentile and percent deviation from average grazed standing crops). These indices could be incorporated into forage-loss insurance policies, which provide livestock producers with access to cash in a timely manner to help stimulate early actions to mediate risk. When coupled with disaster insurance associated with ice and snow in the winter and drought in summer, this policy and technology package could be integrated with other programs focused on development of markets, water, roads, and policy instruments to better protect livestock assets.
Livestock Early Warning System Texas A&M University has developed an innovative suite of automated technologies that allow the acquisition of satellite based weather data from NOAA to feed minimum/maximum temperature, precipitation and solar radiation daily into a pre71
Sheehy, D., M. Hale, D. Damiran, T. Sheehy, D. Tsogoo, and Sh. Batsukh. 2012. Monitoring change on Mongolian rangelands. Final report for Netherlands-Mongolia Environmental Trust Fund for Environmental Reform (NEMO). 156 pp.
parameterized rangeland model (PHYGROW) to provide daily estimates of forage on offer to a mixed population of herbivores. The resulting forage standing crop as subjected to grazing density rules derived from pastoralists is compared with a 50-yr historically generated weather dataset for a geographic area and the percent deviation in forage on offer from “normal” and the percentile ranking determined. The predicted forage standing crop is then co-regressed with NDVI satellite greenness data corresponding to the site to predict the likely weekly forage conditions over a 90-day window updated weekly. The forecasting technique uses the ARIMA forecasting techniques in SAS with detrending and wavelet spectral analysis to condition the signal NDVI and biophysical model data prior to analysis. To map the region’s forage status, a series of monitoring points (currently 300) are scattered across the Counties rangelands and a geo-statistical technique is used to “cokrig” the relationship between predicted forage supply and NDVI values of known points and predict conditions where only NDVI data is known. The resulting map of forage supply and deviation is a provided on a 8x8 km grid for the entire region. Once the analysis is completed each 10 days, a web site is updated automatically and all the data are made available to the public, NGO’s and other interested organizations. The web site is http://glews.tamu.edu. The Center for Natural Resource Information Technology at Texas A&M University provides the analysis hub for the automation site. Currently, the project is experimenting with strategically placed 2-way satellite internet systems linked with SMS cell phone messaging technology to determine if this new technology can improve reporting of market conditions, disaster incidents (flood, water shortage, disease outbreak, conflict) and livestock movement in a timely manner that is automatically packaged and distributed via the current network of WorldSpace satellite radios. NOAA currently places a global 4x4 km satellite weather data product that covers Mongolia on their FTP site each day. The Texas A&M University LEWS team has access to this data. Information includes daily rainfall, temperature and solar radiation. Wind, snow cover and relative humidity are other products that could be packaged. TAMU –LEWS has the skills to automate acquisition and use of this sort of data not requiring large investments in technique development. Using a predetermined number of monitoring sites reflecting the variety of landscapes and climate conditions, monitoring points could be established across the country where sufficient human and agency infrastructure exist to help provide feedback on the emerging conditions and serve as communication node for moving information into pastoral communities. The location and number of sites would have to be determined with experts in the region and analysis of prior response information. The establishment of these sites would provide information on current conditions, past conditions and their trends, and likely emerging conditions with updates every 7 to 10 days and new projections being made. Over time as the system is fine-tuned and human resource skills are established, the computerized automation technology can then be mirrored on computer systems without disruption of information flow. 72
Sheehy, D., M. Hale, D. Damiran, T. Sheehy, D. Tsogoo, and Sh. Batsukh. 2012. Monitoring change on Mongolian rangelands. Final report for Netherlands-Mongolia Environmental Trust Fund for Environmental Reform (NEMO). 156 pp.
The computation of forage loss as a percent deviation or percentile ranking, requires a geographical rich source of weather data with sufficient statistical variation to reflect a wide variety of likely forage responses in the region. A climatic surface is developed which takes known reporting stations within the county and surrounding area and splines the monthly average maximum/minimum temperature and precipitation values as adjusted for elevation and proximity to mountains and large bodies of water. A matching technique is used to assign known historical weather data with the newly created weather climate surfaces. The associated weather is then subjected to statistical analysis to create a weather generator coefficient file for that station. Once this is completed, the surface climate values for a specific grid replace the surface climate monthly means in the station and the weather generator produces 50 years of weather data using the probability distributions of temperature and precipitation events, coupling of sequences of rainfall and likely solar radiation. This generated 50-year weather set forms the foundation for comparing current forage conditions in terms of percent deviation and percentile ranking at each selected grid location. The key to success of this technique is to locate and properly match historical weather data with the selected grid in terms of behavior of events; absolute monthly average min/max temperatures or precipitation, e.g. the occurrence of ice or snow storms and their duration as well as the pattern of drought, have high correspondence with a selected locale. The vegetation is then characterized in terms of basal area of the grass species, frequency of the forb species and effective canopy cover of the woody species. The data is input into the PHYGROW model along with soil surface and horizon characteristics of the monitoring sites and the grazing rules derived from interviews with range users and specialists in the immediate area of the monitoring grid. Each site is then run for the 50 years and daily percent deviation and percentile ranking is determined for each day based on a “day of year” average standing crop of forage usable by a target herbivore, e.g. cattle, sheep, goats, horses, elk, deer, etc. PHYGROW accounts for differential preferences of mixed populations of livestock and models growth of individual plant species or functional groups of species competing for resources under selective grazing. Another important technology that we feel that should be interjected into this matrix is the creation of a NIRS laboratory that allows prediction of diet quality of free ranging large herbivores via fecal scans. Near infrared reflectance spectroscopy has been used to predict dietary crude protein and digestible organic matter of livestock in the USA, Kenya, Ethiopia, Uganda, Tanzania, Argentina, Japan, Hungary and Australia. When fecal profiling is coupled with an advanced nutritional management software, NUTBAL, performance of animals can be predicted with high accuracy and least cost feed inputs determine to mediate nutrient deficiencies. The concept of monitoring herds and providing advisories would allow rangeland users to have a direct connection between their animals, the land and their decision making process. We recognize that other mitigation strategies are needed to make the early warning system valuable. Issues of fodder conservation and distribution schemes, water development, breeding, strategic application of concentrate nutrients for managing body 73
Sheehy, D., M. Hale, D. Damiran, T. Sheehy, D. Tsogoo, and Sh. Batsukh. 2012. Monitoring change on Mongolian rangelands. Final report for Netherlands-Mongolia Environmental Trust Fund for Environmental Reform (NEMO). 156 pp.
condition and above all others management of stocking levels that insure that the resource is sustained and the animal’s body condition is at an optimal level should be pursued within the context of this program. Careful analysis of other organizations addressing these issues must be made to insure that coordination is taking place and scare funding is applied with maximum impact.
References (Back to top)
Al Hamad, M.N. 2002. Integration of point biophysical modeling and NDVI data to improve forecasting of near term forage conditions in Texas. Ph.D. diss., Texas A&M University, College Station. Angerer, J.P., J.W. Stuth, F.P. Wandera, and R.J. Kaitho. 2001. Use of satellite-derived data to improve biophysical model output: An example from Southern Kenya. Paper presented at Sustainable Agriculture and Natural Resource Management (SANREM) Research Synthesis Conference, Athens, Georgia, November 28-30. Online: http://www.sanrem.uga.edu/sanrem/conferences/nov2801/waf/satelitteDataImprovedOut put.htm (accessed 30 June 2003). Box, G.P., G.M. Jenkins, and G.C. Reinsel. 1994. Time series analysis: forecasting and control. 3rd ed. Upper Saddle River, N.J.: Prentice Hall. Corbett, J., J.W. Stuth, P.T. Dyke, and A. Jama. 1998. New tools for the characterization of agricultural (crop and livestock) environments: The identification of pastoral ecosystems as a preliminary structure for use in sample site identification. In Proceedings on pastoral early warning systems for Ethiopia, 31-40. Addis Ababa, Ethiopia. Funk, C., J. Michaelsen, J. Verdin, G. Artan, G. Husak, G. Senay, H. Gadain, and T. Magadazire. 2003. The collaborative historical African rainfall model: Description and evaluation. International Journal of Climatology 23:47-66. Herman, A., V.B. Kumar, P.A. Arkin, and J.V. Kousky. 1997. Objectively determined 10-day African rainfall estimates created for famine early warning systems. International Journal of Remote Sensing 18:2147-2159. Higgins, R.W., W. Shi, and E. Yarosh, 2000: Improved United States precipitation quality control system and analysis. NCEP/Climate Prediction Center Atlas Number 7, 40 pp. Online: http://www.cpc.ncep.noaa.gov/research_papers/ncep_cpc_atlas/7/index.html (accessed 25 June 2003). Hutchinson, M.F. 1991. The application of the thin plate smoothing splines to continentwide data assimilation. In Data assimilation systems, ed. J.D. Jasper 104-113. Bureau of 74
Sheehy, D., M. Hale, D. Damiran, T. Sheehy, D. Tsogoo, and Sh. Batsukh. 2012. Monitoring change on Mongolian rangelands. Final report for Netherlands-Mongolia Environmental Trust Fund for Environmental Reform (NEMO). 156 pp.
Meteorology Research Centre (BMRC) Research Report No. 27. Melbourne: Bureau of Meteorology. Jama, A., M. Kingamkono, W. Mnene, J. Ndungu, A. Mwilawa, J. Sawe, S. Byenkya, E. Muthiani, E. Goromela, R. Kaitho, J. Stuth, and J. Angerer. 2003. Field verification of simulated grazed forage standing crop using the PHYGROW model and satellite-based weather data. USAID Global Livestock CRSP, Research Brief 03-03-LEWS. Jochec, K.G., J.W. Mjelde, A.C. Lee, and J.R. Conner. 2001. Use of seasonal climate forecasts in rangeland-based livestock operations in West Texas. Journal of Applied Meteorology 40(9): 1629-1639. Kaitho, R., J. Stuth, J. Angerer, A. Jama, W. Mnene, M. Kingamkono, J. Ndungu, A. Mwilawa, J. Sawe, S. Byenkya, E. Muthiani, and E. Goromela. 2003. Forecasting nearterm forage conditions for early warning systems in pastoral regions of East Africa. USAID Global Livestock CRSP, Research Brief 03-02-LEWS. Lyons, R.K. and J.W. Stuth. 1992. Fecal NIRS equations for predicting diet quality of free ranging cattle. Journal for Range Management 45:238-243. Nicks, A.D., C.W. Richardson, and J.R. Williams. 1990. Evaluation of the EPIC model weather generator. In EPIC-Erosion/Productivity Impact Calculator, 1. Model documentation, eds. A. N. Sharpley and J. R. Williams, 105-124. USDA-ARS Technical Bulletin 1768. SAS Institute, Inc. 1999. Procedures guide for personal computers, Version 8 edition. Cary, N.C.: The Institute. Schumann, K.D., J.R. Conner, J.W. Richardson, J.W. Stuth, W.T. Hamilton, and D.L. Drawe. 2002. The use of biophysical and expected payoff probability simulation modeling in the economic assessment of brush management alternatives. Journal of Agricultural and Applied Economics 33:539-549. Svoboda, M., D. LeComte, M. Hayes, R. Heim, K. Gleason, J. Angel, B. Rippey, R. Tinker, M. Palecki, D. Stooksbury, D. Miskus, and S. Stephens. 2002. The Drought Monitor. Bulletin of the American Meteorological Society 83:1181-1190. Stuth, J. W., J. Angerer, R. Kaitho, A. Jama, and R. Marambii. 2003. Livestock Early Warning System for Africa rangelands. In Agricultural drought monitoring strategies in the world, ed. V. Boken. Forthcoming. Zander, K. and J. Stuth. 2003. Potential adoption rates by producers of an online decision support system for grazing management. National Grazing Lands Conservation Conference, Nashville, Tennessee. Forthcoming.
75
Sheehy, D., M. Hale, D. Damiran, T. Sheehy, D. Tsogoo, and Sh. Batsukh. 2012. Monitoring change on Mongolian rangelands. Final report for Netherlands-Mongolia Environmental Trust Fund for Environmental Reform (NEMO). 156 pp.
Xie, P. and P.A Arkin. 1998. Global monthly precipitation estimates from satelliteobserved outgoing long wave radiation. Journal of Climate 11:137-164.
Additional web resources (Back to top)
African Livestock Early Warning System (LEWS) portal http://cnrit.tamu.edu/aflews Texas LEWS portal http://cnrit.tamu.edu/txlews New Mexico LEWS portal http://cnrit.tamu.edu/nmlews Noble Foundation LEWS portal http://cnrit.tamu.edu/noble Livestock Nutritional Advisory System http://cnrit.tamu.edu/autosystem US Forage Condition Weather Data System http://cnrit.tamu.edu/usweather/weather.cgi Collaborative Historical African Rainfall Model (CHARM) portal http://cnrit.tamu.edu/charm LEWS Africa Weather Data Access portal http://cnrit.tamu.edu/rsg/rainfall/rainfall.cgi LEWS Africa interactive maps http://cnrit.tamu.edu/maps/map_init.html FEWSNET/African Data Dissemination Service http://edcw2ks21.cr.usgs.gov/adds/ RANET http://www.ranetproject.net Soil Water Characteristics: Hydraulic Properties Calculator http://www.bsyse.wsu.edu/saxton/soilwater/ National Drought Monitoring Center's "Drought Monitor" http://www.drought.unl/edu/dm/ About the Arid Lands Newsletter 76
Sheehy, D., M. Hale, D. Damiran, T. Sheehy, D. Tsogoo, and Sh. Batsukh. 2012. Monitoring change on Mongolian rangelands. Final report for Netherlands-Mongolia Environmental Trust Fund for Environmental Reform (NEMO). 156 pp.
Annex 3. Plant community composition in the SE Gobi (Source: UNEP Vegetation Type Maps compiled by the Russian-Mongolian Complex Ecological Survey, 1996).
ID
Description
Semidesert steppe 25
Artemisia-bunchgrass, bunchgrass (Stipa, Cleistogenes, Agropyron) steppes with Caragana on light chestnut soils
26
Petrophytic forbs-Artimisia-bunchgrass (Agropyron, Stipa) steppes on the light chestnut and mountain chestnut soils.
27
Psammophytic and hemipsammophitic bunchgrass (Agropyron, Stipa glareosa and Stipa gobica, Cleistogenes) steppes with shrubson light chestnut sandy loamy and sandy soils
28
Hemihalophytic Nanophyton-Artemisia-bunchgrass, Allium-Stipa glareosa steppes on light chestnut solonetz soils and solonetzes
DESERT North Desert ( Semi-Desert) 29
Bunchgrass (Stipa gobica, Sipa glareosa) with Anabasis, Allium, Ajania, Artemisia Nanophyton on brown desert-steppe, locally calcareous soils
30
Petrophytic bunchgrass (Stipa gobica, Stipa glareousa) with Ajania, Salsola Iaricifolia, Ceratoides papposa, Caragana on brown soils, locally in combination with perennial soltworts on solonetz brown soils
31
Psammophytic bunchgrass (Stipa gobica, Stipa glareosa) with Caragana, Ceratoides papposa, and Stipa-Cleistogenes communities on brown loosesandy soils and sands
32
Halophytic bunchgrass (Stipa gobica, Stipa glareousa) with perennial saltworts, Salsola passerina with Stipa and Allium; Reaumuria songarica with Stipa and Allium communities on solonetz brown soils and their complexes with solonetzes
Middle-Desert( Steppificated Desert)
33
Anabasis brevifolia with Stipa gobica, Stipa glareosa, Allium; Nanophyton erinaceum with Stipa, Artemisia, Ajania with Stipa deserts on pale-brown locally weakly solonetz soils
34
Petrophytic Anabasis brevifolia, Sympegma, Ajania, Salsola Iaricifolia with Stipa glareosa deserts on pale-brown soils.
35
36
Psammophytic Artemisia with grasses, Ceratoides papposa, Caragana, Potaninia deserts on pale-brown sandy soils Halophytic perennial saltworts with Stipa glareosa in combination with Kaldium deserts on solonchaks and Haloxylon stands on pale solonetzsolonchak
South-Desert (True)
37
Anabasis, Nanophyton, Sympegma, Ephedra, low Haloxylon stands on grey-brown desert, locally solonetz soils, often in combination with Sympegma-Potaninia or Artemisia terrae-abbae-Ceratoides papposa communities on sands
77
Sheehy, D., M. Hale, D. Damiran, T. Sheehy, D. Tsogoo, and Sh. Batsukh. 2012. Monitoring change on Mongolian rangelands. Final report for Netherlands-Mongolia Environmental Trust Fund for Environmental Reform (NEMO). 156 pp.
38
Petrophytic Anabasis, Salsola Iaricifolia, Sympegma, Amygdalus, perennial saltwort deserts on grey-brown skeleton and grey brown raw soils
39
Psammophytic Psammochloa, Artemisia, Caragana, Potaninia, Zygophyllum deserts, high Haloxylon stands on grey-brown, locally gypsic, sandy, weakly differentiated soils and sands
40
Halophytic, Reamuria, Salsola passerina, Anabasis brevifolia, Brachanthemum deserts on grey-brown solonetz soils and solonchak soils
41
Gypsum-halophytic Nitraria, Haloxylon with Nitraria on perennial saltworts deserts on grey-brown solonchak strongly gypsic soils
56
Sedge halophytic grass (Puccinellia, Hordeum) meadows on saline meadow soils, Iris-Carex duriuscula meadows on saline soddy soils, Puccinellia-Achnatherum and Suaeda Achnatherum meadows on meadow solonchacks and saline meadow-chestnut soils with participation of Trisetum-Carex meadows, locally with Phragmites, halophytic forb-grass, Puccinella-Achnatherum meadows on saline meadow-chestnut soils
57
Carex duriuscula-Iris and Anchnatherum communities on saline soddy soils, halophytic grass communities on saline meadow soils in combination with: a) Artemisia frigida-Cleistogenes communities on soddy and chestnut soils, b) Allium and Leymus communities on soddy desertificating calcareous soils
58
Puccenilia, Calamagrostis communities on saline meadow soils, Juncus, Eleocharis-Carex communities on swampy clay mucky-gley soils, Achnatherum and Iris communities with Caragana on soddy desertificating calcareous soils, locally with Phragmites on meadow-swampy soils in combination with: a) poplar stands with shrubs on soddy primitive soils
59
Combination of halophitic meadow communities (Phragmites, Carex, Achnatherum) and shrub tugals (Tamarix, Hallmodendron halodendron), locally with Populus on saline meadow and meadow -desert soils.
60
Shrub (Caragana, Halimodentron, Tamarix) Achnatherum splendens communities with Artemisia and halophytic forbs locally with Stipa on soddy desertificating calcareous soils
61
Phragmites, Eleocharis-Phragmites communities on meadow-swampy soils in combination with: a) Elymus-Carex communites on saline swampy claymucky gley soils and forb-Puccinella communities with Achnatherum on saline meadow soils; b) Eleocharis-Juncus communities on swampy peaty soils, Leymus communities with Limonium and Achnatherum, locally with shrubs (Tamarix, Caragana) on saline meadow soils; c) Phragmites, Carex-Phragmites communities, locally on peaty gley soils
62
Achnatherum communites (with Carex spp, Carex -Agropyron, PotentillaArtemisia -Stipa krylovii, Allium-Carex-Stipa krylovii) on meadow -chestnut, locally solonetz soils
63
Combinations of halophitic (perenial saltwort Reaumuria, Kalidum, Nitraria, Haloxylon) communities on meadow and fluffy solonchaks
64
Haloxylon (Reaumuria, Nitraria) with shrubs, sometimes in combination with Tamarix tugals and psammophytic communities on primitive sair soils
Desert
78
Sheehy, D., M. Hale, D. Damiran, T. Sheehy, D. Tsogoo, and Sh. Batsukh. 2012. Monitoring change on Mongolian rangelands. Final report for Netherlands-Mongolia Environmental Trust Fund for Environmental Reform (NEMO). 156 pp.
Annex 4. Frequency of plants at monitoring sites measured in 2005/06 and 2011 in the South Gobi Region study area. GRASS Achnatherum splendens Agropyron cristatum Agropyron repens Aristida heymannii Aristida neju Carex duriscula Cliestogens soongorica Cliestogens squarrosa Cloris virgata Elymus chinensis Eragrostis minor Koeleria cristata Juncus salsuginosa Phragmites communis Poa pratensis Poa sublastigata Stipa Stipa gobica Stipa krylovii FORB Allium mongolicum Allium odorum Allium polyrhizum Artemisia scoparia Asparagus gobicus Bleuplurum bicaule Caryoptherus mongolicus Chenopodium album Convoluvus ammanii Cymbaria dahurica Dontostemon integrifolius Erodium ? Euphorbia humifusa Ferula bungeana Halepestris ruthenica Heteropappus hispidis Kochia prostrate Lappula intermedia Limonium speciosum Potannia sp. Potentilla bifurica Ranunculus sp. Salsola collina Salsola laricifolia
2005
2 2 3 4 1 1 3
2011 4 3 4 1 7 14 2 1 1
1 1 1 7 2 1
4 1 10 1 2 1 3 4
1 10 9 4
12 13 7 1 3 5 3 2 2
1 2 2 1 1 2
1 3 2
1 2 1 1
4 5 3
79
Sheehy, D., M. Hale, D. Damiran, T. Sheehy, D. Tsogoo, and Sh. Batsukh. 2012. Monitoring change on Mongolian rangelands. Final report for Netherlands-Mongolia Environmental Trust Fund for Environmental Reform (NEMO). 156 pp.
Salsola passerine Salsola pestiferia Salsola sp. Sausarea amara Scorzonera divaricarpa Svedia corniculata Tribulus terrestris SHRUB Ajaina achilloides Anabasis brevifolia Artemisia adamsii Artemisia frigida Artemisia macrocepala Artemisia sp Bassia disiphyllus Caragana bungie Caragana korshinskii Caragana leucophylla Caragana microphyllum Caragana pygmaea Caragana stenophyllum Eurotia cerotoides Haloxylon ammodendron Kalidium foliatum Nitraria sibirica Oxytropis sp. Peganum niglast Reaumaria soongorica Zigophyllum xanthoxylon
2 3 6
3
1 4 1 1
4 3 4 1 2 1 1 1 1 1 3 2 1 3
3
7 6 3 7 6 1 1 6 4 1 5 7 2 3 2 1
2 1
80
Sheehy, D., M. Hale, D. Damiran, T. Sheehy, D. Tsogoo, and Sh. Batsukh. 2012. Monitoring change on Mongolian rangelands. Final report for Netherlands-Mongolia Environmental Trust Fund for Environmental Reform (NEMO). 156 pp.
Annex 6. Forage plants in Khanbogd soum and its assessment.
1
Small animals
Plant name
Abund ance 1.many 2.medi um 3.few
Large animal
Palatabili ty
3
4
2
Impo rtanc e of resou rces 1.hig h 2.mo derat e 3.lo w 5
Overall significan ce ranking 1. Essential 2. high 3.moderat e 4.low
Alternatives
Overall alternatives ranking 1.no alternative 2.few 3.some 4. sufficient
6
7
8
This group of plants with high importance of nutrition cannot be replaced due to its insufficiency
1
As they grow like weeds – possible to replace This group of plants with high importance of nutrition cannot be replaced due to its insufficiency
3 3 1 1
1 Grasses, grass like 1. Achnatherum splendens 2. Aristida heymannii 3. Carex duriuscula 4. Cleistogenes soongorica
1
P
P
1
2
1 3 1
D D D
D P P
2 3 1
3 3 1
5. Chloris virgata 6. Eragrostis minor 7. Ptilagrostis Pilliotii 8. Phragmites communis 9. Psammochloa villosa 10. Psathyrostachys juncea 11. Setaria viridis
3 2 2 2
NA U D U
D D U U
3 3 3 2
3 4 3 2
2
P
U
3
2
3
D
U
3
2
3
D
D
3
4
12. Stipa glareosa 13. S.gobica 14. Hordeum brevisubulatum
1 1 3
P P D
P P U
1 1 3
1 1 3
15. Allium mongolicum 16. A.polyrrhizum 17. Agriophyllum pungens 18. Artemisia anethifolia
1
D
P
2. Forbs 1 1
1 3
P P
P U
1 2
1 3
2
D
D
2
3
3 2 1
1 2
As they grow like weeds – possible to replace This group of plants with high importance of nutrition cannot be replaced due to its insufficiency
3 1 1 3
This group of plants with high importance of nutrition cannot be replaced due to its insufficiency
2
Abundance of this type of plants allows replacement
3
81
2 2
Sheehy, D., M. Hale, D. Damiran, T. Sheehy, D. Tsogoo, and Sh. Batsukh. 2012. Monitoring change on Mongolian rangelands. Final report for Netherlands-Mongolia Environmental Trust Fund for Environmental Reform (NEMO). 156 pp.
19. A.blepharolipis
3
20. A.xanthochroa
3
3 3
U U U
N A N A U U U
2 2 2
U U D
N N D
3 3 2
4 4 3
2 2
U U
D U
2 3
3 3
3 3
29. C. chinganicum
3
U
U
3
4
3
30. Convolvulus Ammanii 31. Chenopodium album
1
N
N
2
3
3
2
U
U
2
4
As this grows like weed, it is possible to replace
4
32. Echinops Gmelinii
3
D
N A
3
3
Few replacement
3
33. Iris tenuifolia
2
U
D
2
2
34. Panzera lanata
3
U
U
3
4
35. Peganum nigllastrum 36. Ptilotrichum canescens 37. Rheum nanum 38. Scorzonera pseudodivaricata
1
N
N
3
2
N
U
2 3
N N A
39. Salsola collina 40. S.pestifera
2 3
41. S.monoptera 42. S.ikonnikovii 43. Salicornia europaea
3 3 3
D N A D D N
21. Arnebia fimbriata 22. Asparagus gobicus 23. Astragalius monophyllus 24. Atriplex sibirica 25. Bassia dasyphylla 26. Dontostemon integrifolius 27. D.senilis 28. Corispermum mongolicum
2
N A U
3
4
3
3
4
3
3 3 3
4 4 4
This group of plants has not high importance of nutrition and can be replaced with other plants
4 4 4 3 3 3
2 4
4
As this grows like weed, it is possible to replace
3
3
Few replacement
3
D N A
2 3
2 3
D N A U U N
2 3
3 3
4 4
2 2 3
3 3 4
4 4 4
No replacing Can be replaced with other plants
4
1 4
3.Shrubs 44. Ajania achilleoides
2
D
D
1
1
No replacement
2
82
Sheehy, D., M. Hale, D. Damiran, T. Sheehy, D. Tsogoo, and Sh. Batsukh. 2012. Monitoring change on Mongolian rangelands. Final report for Netherlands-Mongolia Environmental Trust Fund for Environmental Reform (NEMO). 156 pp.
45. Anabasis brevifolia
1
T
T
2
2
This group of plants has not high importance of nutrition and can be replaced with other plants
3
46. Amygdalus mongolica 47. A.pedunculata 48. Atraphaxis pungens 49. Artemisia xeropphytica 50. A.caespitosa 51. A.santolinifolia
2
U
D
2
2
Few replacement
2
2 2
U D
D D
2 2
2 3
2 3
1
U
U
2
2
3
2 2
D U
U U
2 3
3 3
This group of plants has not high importance of nutrition and can be replaced with other plants
4 4
52. A.gobica 53. Asterothamnus centri-asiaticus
2 1
D U
D U
2 2
3 2
These have high nutrition and few replacement
3 2
54. Brachanthemum gobicum
2
U
U
2
2
2
55. Caryopteris mongolica 56. Calligonum gobicum 57. Caragana leucophloea 58. C.brachypoda 59. C,korshinskii 60. C.pygmae 61. Convolvulus fruticosus 62. Eurotia ceratoides
2
U
U
3
2
2
3
D
U
3
3
3
2
D
U
2
2
3
2 2 2 1
D D D U
U U U U
2 2 2 1
2 2 2 3
3 3 3 3
1
D
D
1
1
1
63. K.foliatum
2
N
N
3
3
3
64. K.cuspidatum 65. Kochia prostrata 66. Nitraria sibirica 67. Haloxylon ammodendron
3 2 1 1
U U U D
N D U N
3 2 1 1
3 2 1 1
68. Potaninia mongolica 69. Reaumuria soongorica
1
D
U
1
1
1
1
D
U
1
1
1
This group of plants with high importance of nutrition cannot be replaced due to its insufficiency
83
3 2 1 1
Sheehy, D., M. Hale, D. Damiran, T. Sheehy, D. Tsogoo, and Sh. Batsukh. 2012. Monitoring change on Mongolian rangelands. Final report for Netherlands-Mongolia Environmental Trust Fund for Environmental Reform (NEMO). 156 pp.
70. Rhamnus erythroxylon
3
N A
N A
3
3
No replacement
1
71. Salsola passerina 72. S.pestifera
1 2
D N A
U N A
1 3
1 3
73. S.laricifolia
1
U
1
2
74. Suaeda corniculata 75. S.prostrata 76. S.salsa 77. Sympegma regelii 78. Tamarix ramosissima 79. Zygophyllum rosovii 80. Z.xanthoxylon
3
N
N A N
3
3
3
2 3 1 2
N N D N
N N U N
3 3 1 2
3 3 1 1
3 3 1 1
3
U
U
3
2
1
1
U
U
2
1
2
81.Ulmus pumila 82.Populus diversifolia
3 3
D D
D D
1 1
Few replacement This group of plants has not high importance of nutrition and can be replaced with other plants
No replacement
1 3 2
4.Trees 1 1
No replacement
1 1
4. Effected plant species and their reasons Location \ Plant name corresponding Reasons for change number at table 3\ 1. Achnatherum 1,5, 9, 14 Surrounding dryness, and lowering of depth splendens water level, closeness to water pipes and OT licensed sites – resulted in changes.This high nutritive plant tolerant to winter and spring weather is an important shelter-like for animals. As seeds of other plants are naturally collected at straw grove, it has unique impact on surrounding areas. 2. Cleistogenes soongorica
1,2,3,5,7, 12
3. Ptilagrostis Pilliotii 1 ,12
4. Phragmites communis
6 ,14
Resulting from depth water pipes, licensed sites, airport, road facilities of OT and TT and dryness, vegetation cover of changing pastures has significant number of it. An important plant with no replacement. Effected from buildings at licensed sites. Unique specie with limited distribution at certain points only Does not belong to OT construction zone, grows nearby roads. Due to surrounding 84
Sheehy, D., M. Hale, D. Damiran, T. Sheehy, D. Tsogoo, and Sh. Batsukh. 2012. Monitoring change on Mongolian rangelands. Final report for Netherlands-Mongolia Environmental Trust Fund for Environmental Reform (NEMO). 156 pp.
5. Stipa giareosa 6,S.gobica
1 .2, 7, 12
7. A.polyrrhizum
1,7
8. Convolvulus Ammanii 9. Peganum nigllastrum 10. Ajania achilleoides
1, 5, 12
11. Anabasis brevifolia 12. Amygdalus mongolica
1, 2, 7
13. Convolvulus fruticosus 14. Chiazospermum laciflorum
1, 7,
1, 2, 5, 14 1, 6, 7
5, 14
1,7
15. Eurotia ceratoides 2, 3, 12
16. Ephedra sinica 17. E,equisetina 18,Erodium stephanianum 19. Echinopis Gmelinii 20. Haloxylon ammodendron
13 1, 7
dryness, plant growth worsened and become shorter. Though, 1950 study recorded that it grew mixed with straws along Undain River, but none of this mixed growth is recorded now. Definitely one of important and unique Gobi plant specie. Affected from depth water pipes, airport, and road facilities. Main forage for smaller animals with no replacement Recorded at pasture along the OT and TT, effected from roads. Good animal forage plant. Grows with first spring rain and helps weak animals to recover quickly. Good for animal health, dairy and wool outputs. Can be used for making animal fodder in winter and spring Abundant in the areas, affected mostly from airport, depth water pipes. Can be replaced. Abundant in the areas, affected mostly from airport, depth water pipes. Can be replaced. affected from depth water pipes, and road facilities. Important plant of nutrition. Г Abundant in the areas, affected mostly from airport, depth water pipes. Can be replaced Its growth area is changed due to dryness and climate changes. One of rare and native plants listed in Red Book. No replacement Abundant in the areas, affected mostly from airport, depth water pipes. Can be replaced Affected from licensed sites, water pipes and road facilities. Considered as good medical plant. No replacement Abundant in the areas, affected mostly from airport, depth water pipes. Tolerant to drought and a very good source of forage as it grows well in extremely drought. Increase camel body mass. Affected from licensed sites, water pipes and road facilities. Considered as good medical plant. No replacement.
1 4, 5
Affected from depth water pipes. If no actions taken, can be completely disappeared in some places. Due to climate and human actions, has 85
Sheehy, D., M. Hale, D. Damiran, T. Sheehy, D. Tsogoo, and Sh. Batsukh. 2012. Monitoring change on Mongolian rangelands. Final report for Netherlands-Mongolia Environmental Trust Fund for Environmental Reform (NEMO). 156 pp.
21. Nitraria sibirica
1,2, 3,5,7,9
22. Reaumuria soongorica 23. Rheum nanum 24. Salsola passerine
5 ,7,8
25. Scorzonera pseudodivaricata 26. Sympegma regelii 27. Tamarix ramosissima 28. Z.xanthoxylon 29. Ulmus pumila 30. Populus diversifolia
1, 6 ,14
1 1, 7, 12
1,7,8 6, 14 7 5,9, 14 14
been changed.NasnyZam LL, a road company, uses as a fuel in big number according to herders. Abundant in the area, and affected from depth water pipes and road facilities. As signs of water deficit, at some place its leaves are dried and seemed can no longer re-grow. Affected from road facilities and climate factors. Affected from depth water pipes. Abundant in the area, and affected from road facilties and depth water pipes. With high nutrition, it is categorized as with no replacement. Affected from road facilities and depth water pipes. Possible to replace. Abundant in the area, affected much from road facilities. With high nutrition, it is categorized as with no replacement. Its growth area is changed due to dryness and climate changes. One of rare and native plants listed in Red Book. No replacement.
3.Pasture and its types in affected zone Pasture type and location name 1.Stipa gg-Anabasis brevifolia,Anabasis brevifolia-Stipagg
2.Nitraria sibiricaEurotiaceratoides3.Reaumuria soongorica-Salsola passerina 4.Haloxylon ammodendron
Location
Changes
N 43° 05 20.8" E 106° 50 54,3" h-1219 m N 43° 03' 24,6" E 106° 51' 50.0" h-1219 m N 43° 10' 38,2" E 106° 57' 56,3" h-1237 m N 43° 17'57,0" E 107°09' 12,3" h1038 m
Vegetation covering over 50 hectares around water transmission pipe and road facilities is completely gone. Heavy soil erosion Eastern and northern east part of OT licensed site. High probability to disappear during full operation of OT 20 meter wide pasture along the pipe and road. No changes to pasture yet. High emission of dust No significant changes to this – though in 3 km from here, water pipe is expanded into 6 branches that completely ruined soil and vegetation cover around. With no water pipes built not significant changes to the pasture yet. Though, it is expected to completely gone in future with preventive actions taken
N 43° 24' 45,1" E 107° 24' 29,1" h- 975 m
86
Sheehy, D., M. Hale, D. Damiran, T. Sheehy, D. Tsogoo, and Sh. Batsukh. 2012. Monitoring change on Mongolian rangelands. Final report for Netherlands-Mongolia Environmental Trust Fund for Environmental Reform (NEMO). 156 pp.
5. Nitraria sibiricaConvolvilusfruticosus
N42° 40' 19.3" E106° 57' 44,9" h-986
6.Tamarix ramosissima
N42° 38' 02,7" E107° 18' 23,6" h-927 N42° 48' 55,7" E107° 03' 08,4" h-1044 N 42° 57' 38,3" E 106° 42' 25,1" h-1203
7.Nitraria sibiricaStipaggConvolvilusfruticosus
8.Sympegma regeliiSalsola passerineAnabassis brevifolia
N42° 49' 37,0" E107° 03' 59,3" h-1026
9. Achnatherum spelendens, Iris lactae,Nitraria sibirica
N42° 51' 07,3" E107° 15' 12,0" h-1003 m
10.Nearby
Nitraria sibirica, a dominant plant is abundant but those are almost not grown, branches, leaves are dried and about to dye. Water deficiency is the most possible reason. Located at 50 km from OT site along the Undyn River – possible to be affected from road facilities No significant changes yet. Its location close to many roads and current dryness makes it vulnerable community Though located between TavanTolgoi and OyuTolgoi roads, no significant changes to it yet. Affected area size is reduced with new and old roads meet nearby Javkhlant bag. Temporary camp of road construction workers and due to two roads, it is under risks of changes. New and old roads of Tavantolgoi get closer in 100-200 m from the pasture and vegetation cover and soil between the roads were completely gone. In two sides of the road, 10 m deep canal is built with access road around. All these roads makes 600 m wide road in some places. Located between Tavan tolgoi and OyuTolgoi roads, yet no significant changes. Winter shelters of several households such as Bulten, Tseveenjav, and Khangarid are located in midst of two roads. Nearby pastures can be used at all. Located close to paved roads being constructed Oyu tolgoi, no significant changes are observed yet. Elm tree grows in line 10 km long following the BogtorKhoovryn River swash. It used to have water far from Khan Bogd mountain, but not a drop of water in last few years. Due to that, runways of Khoovryn and Bulagtyn Rivers disapperad. (Runway means a place where no ground water is shown but the place where animals can drink water by digging with legs). Due to weather and roads, it is under risks of changes Soil and vegetation cover is completely 87
Sheehy, D., M. Hale, D. Damiran, T. Sheehy, D. Tsogoo, and Sh. Batsukh. 2012. Monitoring change on Mongolian rangelands. Final report for Netherlands-Mongolia Environmental Trust Fund for Environmental Reform (NEMO). 156 pp.
Tsagaankhad village
11.Road filling material delivery sites \13\
N42°52' 29,9" E107° 09' 06,9" h-1057
12.Anabasis brevifoliaCleistogenes soongorica-Stipagg
N43° 06' 24,4" E106° 52' 06,6" h-1055
13. Ephedra sinicaStipagg 14. Togoon mountain
N42° 32'52,9" E107°34'06,8" h-1012
gone. Too much dust from coal and other places. Due to soil erosion, everywhere holes, dips and hollows. Soil erosion continues 10 km long along the coal road in the west from village. Pollution is huge with high population in the village. Minimum standards of hygiene for living is not met . Clay is taken from 3-4 deep holes next to new road of OT. Average hole size is 50*50meters. No changes to vegetation cover. No pollution, no changes nearby the airport. Almost no changes to vegetation cover. At the airport, there is place where vegetation got scarce. The area is what Gabiluud bag residents use as summer pasture. Northern part of OY. Can be completely gone with operation of OT. Eastern and southern east side of OT licensed site. Under risks of complete disappearance during operation of OT No live Popolus diversifolia are in 180х 50m areas. No specific reasons can be given yet – but most likely dryness and lowering of depth water level are resulted in.
1. Pasture use by Herders in Khanbogdsoum and its assessment
Pasture name
Size, ha
1
2
1. Stipag gAllium polyrrhizum
14413
2.StipaggArtemisia pectinata
4662
Soil name
Palatabilit y 1.Smaller 2.Larger
Importance of resources 1.high 2.moderate 3.low
Overall significa nce ranking 1. Essential 2. high 3.moder ate 4.low
Alternatives for replacement
3 4 5 6 7 Gobi desert and desert steppe mountainous pasture Mountainou 1 1 1 This pasture s swash is insufficient. brown No replacement Mountainou 1 2 3 This pasture s swash is insufficient. brown No 88
Overall alternatives ranking 1.no alternative 2.few 3.some 4. sufficient
8 1
2
Sheehy, D., M. Hale, D. Damiran, T. Sheehy, D. Tsogoo, and Sh. Batsukh. 2012. Monitoring change on Mongolian rangelands. Final report for Netherlands-Mongolia Environmental Trust Fund for Environmental Reform (NEMO). 156 pp.
replacement Few replacement
3. Anabasis brevifoliaStipagg 4.Anabassis brevifolia, Anabassis brevifoliaReaumuriasoongorica 5. Salsola passerine – Stipagg 6.Eurotia ceratoidesAjaniaachilleoi des7. Eurotia ceratoidesArtemisia xerophytica 8. Sympegma regelii-Anabassisbrevi folia 9.Anabassis brevifoliaSalsola collina
5531
Swashsandy brown
1,2
1
1
19694
Swashsandy brown
1,2
3
4
Can be replaced with other types of shrub pastures
4
96076
Mountainou s swash brown Swashsandy brown
1,2
1
2
Few replacement
3
1,2
1
2
3
4533
Swashsandy brown
2
1
2
20647
Swashsandy brown
2
2
3
15599
Swashsandy brown
2
2
4
10. Salsola passerine, S.laricifolia ,Eurotiaceratoi des, Anabassis brevifolia,Conv olvilus fruticosus\ 11. Artemisia santolinifoliaA.xerophyticaA. pectinata12. Artemisia xerophyticaBrachanthemu m gobicum
11721
Swashsandy brown
2
1
2
Can be replaced with other types of shrub pastures Can be replaced with other types of shrub pastures Can be replaced with other types of shrub pastures Can be replaced with other types of shrub pastures Can be replaced with other types of shrub pastures
53210
Swashsandy brown
2
3
4
Swash sandy brown
2
2
2
45069
50505
Can be replaced with other types of shrub pastures Can be replaced with other types of shrub pastures
Desert-steppe pasture 89
2
4
3
4
3
4
3
Sheehy, D., M. Hale, D. Damiran, T. Sheehy, D. Tsogoo, and Sh. Batsukh. 2012. Monitoring change on Mongolian rangelands. Final report for Netherlands-Mongolia Environmental Trust Fund for Environmental Reform (NEMO). 156 pp.
13.Stipa ggCliestogenes soongorica
8358
Steppe-like desert sandy brown
14. Stipa ggArtemisia santolinifoliaArtemisia coespitosa 15.StipaggAllium polyrrhizumSalsola passerine 16. Stipa ggAnabasis brevifolia 17. Allium polyrrhizum Stipa ggArtemisia frigida 18. Cleistogenes soongorica Allium polyrrhizum 19. Allium polyrrhizum .Stjpa gg
8958
sandy brown
20. Artenisia frigidaA.xerophytica
1
1
1
1
3
4
This pasture is insufficient. No replacement Few replacement
1
3
12987 8
Steppe-like desert sandy brown
1
1
1
This pasture is insufficient. No replacement
1
97836
sandy brown
1,2
2
3
Few replacement
3
49592
Steppe-like desert sandy brown
1
1
1
This pasture is insufficient. No replacement
1
5824
Steppe-like desert sandy brown
1
1
1
This pasture is insufficient. No replacement
1
2958
Steppe-like desert sandy brown
1
1
1
1
5850
sandy brown
1,2
2
3
This pasture is insufficient. No replacement .Possible to be replaced with some other types of shrub pastures
3
Gobi-desert-valley pasture 21. Salsola passerineStipagg-Allium polyrrhizum 22. Reaumuria soongoricaSalsola passerine
sandy brown 2876
83803
1.2
Desert brown grey
1,2
1
1
1
1
Few replacement
Can be replaced with other types of shrub pastures 90
2
3
Sheehy, D., M. Hale, D. Damiran, T. Sheehy, D. Tsogoo, and Sh. Batsukh. 2012. Monitoring change on Mongolian rangelands. Final report for Netherlands-Mongolia Environmental Trust Fund for Environmental Reform (NEMO). 156 pp.
23. Salsola passerine
45497
Desert brown grey
2
2
3
22. Nitraria sibiricaConvolvilus fruticosus
27375
sandy brown
2
3
4
Can be replaced with other types of shrub pastures Can be replaced with other types of shrub pastures
4
Unique composition, rare- no replacement Can be replaced with only after improvement actions taken Can be replaced with other types of shrub pastures Unique composition, rare- no replacement Can be replaced with other types of shrub pastures Can be replaced with other types of shrub pastures Can be replaced with only after improvement actions taken 2 Unique composition, rare – no replacement
2
4
Gobi Loose sandy and salt marshy pasture 24.Psammochl oa villosaArtemisia gobica 25.Reaumuria soongoricaAchnatherum spelendens
6821
sandy
1,2
2
2
15268 3
Salt marshy
1,2
1
2
26. Reaumuria soongoricaNitraria sibirica 27.Nitraria sibirica, &Tamarix ramosissima 28. Artemisia anethifolia Kalidium foliatum 29. Kalidium foliatumReaumuria soongorica 30. Kalidium foliatumK.gracileAchnatherumsp elendens
16613
sandy brown 1,2
3
3
31. Haloxylon ammodendron
12245
60043
Salt marshy
2
3
4
27210
Salt marshy
2
3
4
12508
Salt marshy
2
2
3
56029
Salt marshy 1,2
2
3
2
2
3
sandy brown
91
2
4
2
4
3
2
2
Sheehy, D., M. Hale, D. Damiran, T. Sheehy, D. Tsogoo, and Sh. Batsukh. 2012. Monitoring change on Mongolian rangelands. Final report for Netherlands-Mongolia Environmental Trust Fund for Environmental Reform (NEMO). 156 pp.
Mountain hillside swash pasture 32. Haloxylon ammodendron
33. Salsola passerinePotaninia mongolicaConvolvilus fruticosus, Artemisia xerophytica\ 34 .Artemisia xerophyticaSalsolacollinaCorispermumm ongolicum 35. Allium polyrrhizumSalsola passerineReaumuria soongorica 36. Artemisia santolinifoliaA.xerophytica
3846
sandy brown
2
2
3
2
2
2
2
3
4
sandy brown 48071
19880
sandy brown
sandy brown 33250
18558
sandy brown
1,2
2
2
2
3
4
Unique composition, rare – no replacement Can be replaced with other types of shrub pastures
Can be replaced with other types of shrub pastures Can be replaced with other types of shrub pastures
Can be replaced with other types of shrub pastures
Annex 7. ECOLOGICAL SITE DESCRIPTIONS: 2011 GOBI PHYGROW SURVEY DRAFT ECOLOGICAL SITE DESCRIPTIONS
1. GRAVELLY LOAM 10-15 STIPA SEMI-DESERT STEPPE A. PHYSICAL CHARACTERISTICS 1. Physiography This site occurs on terraces, tablelands and rolling uplands. Slopes typically range from 2 to 15%. 2. Climate
92
2
3
4
2
4
Sheehy, D., M. Hale, D. Damiran, T. Sheehy, D. Tsogoo, and Sh. Batsukh. 2012. Monitoring change on Mongolian rangelands. Final report for Netherlands-Mongolia Environmental Trust Fund for Environmental Reform (NEMO). 156 pp.
Annual average precipitation is 10-15 cm occurring most during mid-June to the end of August. Localized winds from the south result, in extremely cold, dry winter; dry, cold, and windy conditions in the spring. Mean annual precipitation decreases from north to south. Soil temperature regime is frigid with mean average temperature of 8.7 degrees C. Temperature extremes range from 30 in July to -25 in January. 3. Soils Light chestnut and mountain chestnut soils, typically surface horizon is gravelly loam (pedon described to 43 cm). Assume ochric epipedon, cambic horizon from 5 to 35 cm. with lithic bedrock described at 35 cm, classify as Lithic Haplocambids 4. Vegetation a. The potential native plant community is dominated by bunchgrass (Stipa gobica, S. glareosa, Agropyron cristatum) and Allium polyrrhizum with Anabasis, Allium, Ajania, Artemisia and Nanophyton. Annual increaser grasses are Setaria viridis and Eragrostis minor. The vegetative composition of the community is approximately 55% grass, 35% forbs and 10% shrubs. b. The major plant species in the potential community and their potential by air-dry weight: COMMON NAME PLANT SYMBOL % COMP Grasses and grass-like plants Stipa gobica, S. glareosa STGL, STGB 10-30 Agropyron cristatum, A. AGCR, AGDE 5-10 desertorum Cleistogenes songorica CLSO 2-5 Cleistogenes squarrosa CLSQ 1-3 Other perennial grasses PPGG 2-8* *Allow no more than 2 percent of each species and no more than 8 percent in aggregate. COMMON NAME PLANT SYMBOL % COMP Forbs Allium polyrrhizum ALLPO 5-20 Heteropappus hispidus STGB 1-2 Other perennial forbs PPFF 1-5 *Allow no more than 1 percent of each species and no more than 5 percent in aggregate. COMMON NAME PLANT SYMBOL % COMP Shrubs Caragena stenophylla CARST 5-10 Salsola passerina SAPA 2-5 Ajaina achilloides AJAC 1-2 Artemesia spp. ARTEM 1-2 Other perennial shrubs SSSS 1-2* *Allow no more than 2 percent of each species and no more than 2 percent in aggregate. 93
Sheehy, D., M. Hale, D. Damiran, T. Sheehy, D. Tsogoo, and Sh. Batsukh. 2012. Monitoring change on Mongolian rangelands. Final report for Netherlands-Mongolia Environmental Trust Fund for Environmental Reform (NEMO). 156 pp.
c. Approximate ground cover is 30-60 percent (basal and crown). d. Annual production per acre (air dry weight): Favorable years: 600 kg/ha Average years: 400 kg/ha Unfavorable years: 100 kg/ha 5. Range of Characteristics Variability in plant composition and production results from variation in soil surface texture and depth. Production increases with increasing soil depth. 6. Response to disturbance If the condition of the site deteriorates as a result of overgrazing, Stipa app. and Agropyron spp. decrease while annual grasses (Setaria viridis, Eragrostis minor) Ajania achillodes increase. With further deterioration annuals and bare ground increases resulting in increased risk of erosion and reduced site productivity. 7. Location of reference sites DO-0001 Latitude Longitude 45.8562 108.857 North sloping grass steppe, 10-15% slope aspect 3280, 1170 m elevation Mongolian Russian Classification Major Zone: Steppe, Eco-type: semi-desert steppe, plant community #26 DG-0035 Latitude Longitude 43.3341 107.7890 Gravely ridges grass steppe, no aspect, 1367 m elevation Mongolian Russian Classification Major Zone: Steppe, Eco-type: semi-desert steppe, plant community #26
2. SHALLOW CLAY LOAM 10-15 PZ ALLIUM/STIPA SEMI-DESERT STEPPE A. PHYSICAL CHARACTERISTICS 1. Physiography This site occurs on ridgetops and rolling uplands with shallow soils. Slopes typically range from 2 to 15%. 2. Climate Annual average precipitation is 10-15 cm occurring most during mid-June to the end of August. Localized winds from the south result, in extremely cold, dry winter; dry, cold, 94
Sheehy, D., M. Hale, D. Damiran, T. Sheehy, D. Tsogoo, and Sh. Batsukh. 2012. Monitoring change on Mongolian rangelands. Final report for Netherlands-Mongolia Environmental Trust Fund for Environmental Reform (NEMO). 156 pp.
and windy conditions in the spring. Mean annual precipitation decreases from north to south. Soil temperature regime is frigid with mean average temperature of 8.7 degrees C. Temperature extremes range from 30 in July to -25 in January. 3. Soils Light chestnut sandy loamy and sandy soils, very shallow light clay loam. Pedon described to 13 cm. Assume ochric epipedon, argillic horizon at 5 cm, classify as Typic Haplargids. 4. Vegetation a. The potential native plant community is dominated by bunchgrass (Stipa glareosa, Cleistogenes songorica) and Allium polyrrhizum with Caragana stenophylla, Artemisia xerophytica, Ajania, and Nanophyton. Annual increaser grasses are Setaria viridis and Eragrostis minor. The vegetative composition of the community is approximately 50% grass, 40% forbs and 10% shrubs. b. The major plant species in the potential community and their potential by air-dry weight: COMMON NAME PLANT SYMBOL % COMP Grasses and grass-like plants Stipa glareosa STGL 10-30 Cleistogenes squarrosa CLSQ 5-15 Other perennial grasses PPGG 2-8* *Allow no more than 2 percent of each species and no more than 8 percent in aggregate. COMMON NAME PLANT SYMBOL % COMP Forbs Allium polyrrhizum ALLPO 5-20 Caryopteris mongolica CAMO 1-2 Orostachys malacophylla ORMA 1-2 Other perennial forbs PPFF 1-5 *Allow no more than 1 percent of each species and no more than 5 percent in aggregate. COMMON NAME PLANT SYMBOL % COMP Shrubs Caragena stenophylla CARST 5-10 Artemisia xerophytica/frigida ARXE, ARFR 1-2 Scorzonera divaricata SCDI 1-2 Salsola collina SACOL 2-5 Other perennial shrubs SSSS 2-5* *Allow no more than 2 percent of each species and no more than 10 percent in aggregate. c. Approximate ground cover is 20-50 percent (basal and crown). d. Annual production per acre (air dry weight): Favorable years: 400 kg/ha 95
Sheehy, D., M. Hale, D. Damiran, T. Sheehy, D. Tsogoo, and Sh. Batsukh. 2012. Monitoring change on Mongolian rangelands. Final report for Netherlands-Mongolia Environmental Trust Fund for Environmental Reform (NEMO). 156 pp.
Average years: 300 kg/ha Unfavorable years: 100 kg/ha 5. Range of Characteristics Variability in plant composition and production results from variation in soil surface texture and depth. Production increases with increasing soil depth. 6. Response to disturbance If the condition of the site deteriorates as a result of overgrazing, Stipa spp. decreases while annual grasses (Setaria viridis, Eragrostis minor) and Artemisia spp. and Ajania achillodes increase. With further deterioration Cleistogenes spp. decreases, and annuals and bare ground increases resulting in increased risk of erosion and reduced site productivity. 7. Location of reference sites DO-002 Latitude Longitude 44.8743 109.137 Siltstone ridges Anabasis-Stipa steppe with inclusions of Achnatherum splendens swales, rolling with 1-10% slopes, 1098 m elevation DO-0023 Latitude Longitude 45.4918 109.7840 Stony ridge 5-10% slight aspect 3640, 998 m elevation.
96
Sheehy, D., M. Hale, D. Damiran, T. Sheehy, D. Tsogoo, and Sh. Batsukh. 2012. Monitoring change on Mongolian rangelands. Final report for Netherlands-Mongolia Environmental Trust Fund for Environmental Reform (NEMO). 156 pp.
3. CLAY LOAM 10-20 STIPA/ALLIUM SEMI-DESERT STEPPE A. PHYSICAL CHARACTERISTICS 1. Physiography This site occurs on terraces, dry basins with inclusions of floodplains and accompanying Elymus chinensis and Achnetherum splendens. 2. Climate Annual average precipitation is 10-20 cm occurring most during mid-June to the end of August. Localized winds from the south result, in extremely cold, dry winter; dry, cold, and windy conditions in the spring. Mean annual precipitation decreases from north to south. Soil temperature regime is frigid with mean average temperature of 8.7 degrees C. Temperature extremes range from 30 in July to -25 in January. 3. Soils Clay loam soils, pedon described to 58 cm. Assume ochric epipedon, argillic (based on clay increase), calcic horizon based on white color in pedon description at 47 cm classify as Typic Calciargids 4. Vegetation a. The potential native plant community is dominated by bunchgrass (Stipa Krylovii, Cleistogenes songorica) and Allium polyrrhizum with Artemisia xerophytica, Ajania, Caragana and Nanophyton. Annual increaser grasses are Setaria viridis and Eragrostis minor. The vegetative composition of the community is approximately 60% grass, 45% forbs and 5% shrubs. b. The major plant species in the potential community and their potential by air-dry weight: COMMON NAME PLANT SYMBOL % COMP Grasses and grass-like plants Stipa Krylovii STKR 10-20 Carex duriusula CXDU 5-10 Cleistogenes songorica CLSO 5-10 Koleria cristata KOCR 2-5 Elymus chinensis ELCHN 1-2 Achnetherum splendens ACSP 1-2 Other perennial grasses PPGG 2-8* *Allow no more than 2 percent of each species and no more than 8 percent in aggregate. COMMON NAME Forbs Allium polyrrhizum Potentilla bifurca
PLANT SYMBOL ALLPO POTBI
% COMP 5-10 2-5 97
Sheehy, D., M. Hale, D. Damiran, T. Sheehy, D. Tsogoo, and Sh. Batsukh. 2012. Monitoring change on Mongolian rangelands. Final report for Netherlands-Mongolia Environmental Trust Fund for Environmental Reform (NEMO). 156 pp.
Other perennial forbs PPFF 1-5 *Allow no more than 1 percent of each species and no more than 5 percent in aggregate. COMMON NAME PLANT SYMBOL % COMP Shrubs Caragena stenophylla CARST 5-10 Caragena leucophloea CARLE 1-2 Scorzonera divaricata SCDI 1-2 Salsola passerina SACOL 2-5 Other perennial shrubs SSSS 2-5* *Allow no more than 2 percent of each species and no more than 10 percent in aggregate. c. Approximate ground cover is 20-50 percent (basal and crown). d. Annual production per acre (air dry weight): Favorable years: 700 kg/ha Average years: 300 kg/ha Unfavorable years: 100 kg/ha 5. Range of Characteristics Variability in plant composition and production results from variation in soil surface texture and depth. Production increases with increasing soil depth. 6. Response to disturbance If the condition of the site deteriorates as a result of overgrazing, Stipa, Carex and Koleria decrease, while annual grasses (Setaria viridis, Eragrostis minor increase. Palatable Caragana shrubs decrease and undesirable shrubs (Oxytropsis, Kochia Artemisia) increase. With further deterioration, Cliestogenes decreases, annual forbs and bare ground increases resulting in increased risk of erosion and reduced site productivity. 7. Location of reference sites DG-36 Latitude Longitude 46.6385 108.0280 Sloping terrace Allium-Stipa steppe, no aspect, 1277 m elevation DG-38 Latitude Longitude 45.9021 108.2150 Dry terrace Allium-Stipa steppe, with inclusions of dry flood plain, no aspect, 1239 m elevation
98
Sheehy, D., M. Hale, D. Damiran, T. Sheehy, D. Tsogoo, and Sh. Batsukh. 2012. Monitoring change on Mongolian rangelands. Final report for Netherlands-Mongolia Environmental Trust Fund for Environmental Reform (NEMO). 156 pp.
4. LOAMY SKELETAL 10-15 STIPA/ALLIUM/CARAGANA/ARTEMISIA STEPPE A. PHYSICAL CHARACTERISTICS 1. Physiography This site occurs on gently sloping plains and rolling hills, terraces, dry basins with inclusions of floodplains and associated Achnetherum splendens. 2. Climate Annual average precipitation is 10-15 cm occurring most during mid-June to the end of August. Localized winds from the south result, in extremely cold, dry winter; dry, cold, and windy conditions in the spring. Mean annual precipitation decreases from north to south. Soil temperature regime is frigid with mean average temperature of 8.7 degrees C. Temperature extremes range from 30 in July to -25 in January. 3. Soils Light chestnut and mountain chestnut soils, loamy skeletal Lithic Torriorthent with greater tan 50% rock fragments in profile. 4. Vegetation a. The potential native plant community is dominated by bunchgrass (Stipa Krylovii S. gobica, Festuca lenensis, Cleistogenes songorica) and Allium polyrrhizum with shrubs Caragana leucophloea, C. stenophylla, C. korshinskii, Eurotia Ceratoides, Artemisia xerophytica, Ajania achilloidea and Nanophyton. Annual increaser grasses are Setaria viridis and Eragrostis minor. The vegetative composition of the community is approximately 40% grass, 20% forbs and 40% shrubs. b. The major plant species in the potential community and their potential by air-dry weight: COMMON NAME PLANT SYMBOL % COMP Grasses and grass-like plants Stipa Krylovii, S. gobica STKR, STGO 10-20 Festuca lenensis FELE 5-10 Cleistogenes songorica CLSO 5-10 Other perennial grasses PPGG 2-8* *Allow no more than 2 percent of each species and no more than 8 percent in aggregate. COMMON NAME PLANT SYMBOL % COMP Forbs Allium polyrrhizum ALLPO 5-10 Heteropappus hispidus HEHI 2-5 Other perennial forbs PPFF 1-5 *Allow no more than 1 percent of each species and no more than 5 percent in aggregate. COMMON NAME
PLANT SYMBOL
% COMP 99
Sheehy, D., M. Hale, D. Damiran, T. Sheehy, D. Tsogoo, and Sh. Batsukh. 2012. Monitoring change on Mongolian rangelands. Final report for Netherlands-Mongolia Environmental Trust Fund for Environmental Reform (NEMO). 156 pp.
Shrubs Caragena leucophloea CARLE 5-10 C. stenophylla C. korshinskii CARST, CAKO 2-5 Artemisia xerophytica ARXE 1-2 Artemisia frigida ARFRI 1-2 Other perennial shrubs SSSS 2-5* *Allow no more than 2 percent of each species and no more than 10 percent in aggregate. c. Approximate ground cover is 20-50 percent (basal and crown). d. Annual production per acre (air dry weight): Favorable years: 600 kg/ha Average years: 300 kg/ha Unfavorable years: 100 kg/ha 5. Range of Characteristics Variability in plant composition and production results from variation in soil surface texture and depth. Production increases with increasing soil depth. 6. Response to disturbance If the condition of the site deteriorates as a result of overgrazing, Stipa, Carex and Koleria decrease, while annual grasses (Setaria viridis, Eragrostis minor increase. Palatable Caragana shrubs decrease and undesirable shrubs (Oxytropsis, Kochia Artemisia) increase. With further deterioration, Cliestogenes decreases, annual forbs and bare ground increases resulting in increased risk of erosion and reduced site productivity. 7. Location of reference sites DO-03 Latitude Longitude 44.3648 108.227 Foot slope Stipa/Allium/Caragana/Eurotia semi-desert steppe, 1300 m elevation DO-28 Latitude Longitude 45.6861 109.1470 Rolling hills Stipa/Allium/Artemisia semi-desert steppe, 1-5% slight slopes, 1130 m elevation DG-07 Latitude Longitude 46.4253 108.2330 Sloping plain Stipa/Allium/Artemisia dry steppe, no aspect, 1274 m elevation
100
Sheehy, D., M. Hale, D. Damiran, T. Sheehy, D. Tsogoo, and Sh. Batsukh. 2012. Monitoring change on Mongolian rangelands. Final report for Netherlands-Mongolia Environmental Trust Fund for Environmental Reform (NEMO). 156 pp.
5. LOAMY SAND 10-15 ALLIUM/STIPA SEMI-DESERT STEPPE A. PHYSICAL CHARACTERISTICS 1. Physiography This site occurs on gently sloping plains and rolling hills terraces, dry basins with inclusions of floodplains and accompanying Achnetherum splendens. 2. Climate Annual average precipitation is 10-15 cm occurring most during mid-June to the end of August. Localized winds from the south result, in extremely cold, dry winter; dry, cold, and windy conditions in the spring. Mean annual precipitation decreases from north to south. Soil temperature regime is frigid with mean average temperature of 8.7 degrees C. Temperature extremes range from 30 in July to -25 in January. 3. Soils Loamy sand Typic Torripsamments pedon described to 68 cm 4. Vegetation a. The potential native plant community is dominated by bunchgrass (Stipa glareosa, Cleistogenes squarrosa) and forbs Allium polyrrhizum, A. mongolicum, Scorzonera austriaca with shrubs Caragana korshinskii, Eurotia ceratoides, Artemisia xerophytica, Ajania achilloidea. Annual increaser grasses are Setaria viridis and Eragrostis minor. The vegetative composition of the community is approximately 45% grass, 40% forbs and 15% shrubs. b. The major plant species in the potential community and their potential by air-dry weight: COMMON NAME PLANT SYMBOL % COMP Grasses and grass-like plants Stipa glareosa, S. gobica STGL, STGO 10-20 Cleistogenes squarrosa CLSQ 5-10 Other perennial grasses PPGG 2-8* *Allow no more than 2 percent of each species and no more than 8 percent in aggregate. COMMON NAME PLANT SYMBOL % COMP Forbs Allium polyrrhizum ALLPO 10-20 Scorzonera austriaca SCAU 2-5 Other perennial forbs PPFF 1-5 *Allow no more than 1 percent of each species and no more than 5 percent in aggregate. COMMON NAME Shrubs Caragena korshinkii
PLANT SYMBOL CARKO
% COMP 5-10 101
Sheehy, D., M. Hale, D. Damiran, T. Sheehy, D. Tsogoo, and Sh. Batsukh. 2012. Monitoring change on Mongolian rangelands. Final report for Netherlands-Mongolia Environmental Trust Fund for Environmental Reform (NEMO). 156 pp.
Eurotia ceratoides CARST, CAKO 5-10 Artemisia xerophytica ARXE 1-2 Artemisia frigida ARFRI 1-2 Other perennial shrubs SSSS 2-5* *Allow no more than 2 percent of each species and no more than 10 percent in aggregate. c. Approximate ground cover is 40-60 percent (basal and crown). d. Annual production per acre (air dry weight): Favorable years: 700 kg/ha Average years: 400 kg/ha Unfavorable years: 100 kg/ha 5. Range of Characteristics Variability in plant composition and production results from variation in annual precipitation, soil surface texture and depth. Production increases with increasing soil depth. 6. Response to disturbance If the condition of the site deteriorates as a result of overgrazing, Stipa, Carex and Koleria decrease, while annual grasses (Setaria viridis, Eragrostis minor increase. Palatable Caragana and Eurotia shrubs decrease while undesirable shrubs (Ajania, Artemisia) increase. With further deterioration, Ajania achilloidea and Artemesia frigida communities is succeeded by Convulvlus ammanni communities. 7. Location of reference sites DO-29 Latitude Longitude 44.9635 109.229 Gravelly dunes, coarse surface, deep profile, no aspect, 1083 m elevation
102
Sheehy, D., M. Hale, D. Damiran, T. Sheehy, D. Tsogoo, and Sh. Batsukh. 2012. Monitoring change on Mongolian rangelands. Final report for Netherlands-Mongolia Environmental Trust Fund for Environmental Reform (NEMO). 156 pp.
6. CLAY LOAM 10-15 SALSOLA/STIPA/ALLIUM NORTH-DESERT STEPPE A. PHYSICAL CHARACTERISTICS 1. Physiography This site occurs on rolling uplands and dry basins. 2. Climate Annual average precipitation is 10-15 cm occurring most during mid-June to the end of August. Localized winds from the south result, in extremely cold, dry winter; dry, cold, and windy conditions in the spring. Mean annual precipitation decreases from north to south. Soil temperature regime is frigid with mean average temperature of 8.7 degrees C. Temperature extremes range from 30 in July to -25 in January. 3. Soils Clay loam soils, pedon described to 48 cm, ochric epipedon, argillic (based on clay increase), calcic horizon based on white color in pedon description at 47 cm, Typic Calciargids 4. Vegetation a. The potential native plant community is dominated by shrubs Salsola passerina, Anabasis brevifolia and Reamuria soongorica, bunchgrass (Stipa gobica and Cleistogenes songorica), Carex korshinskyi and Allium mongolicum Annual increaser grasses are Setaria viridis and Eragrostis minor. The vegetative composition of the community is approximately 30% grass, 20% forbs and 50% shrubs. b. The major plant species in the potential community and their potential by air-dry weight: COMMON NAME PLANT SYMBOL % COMP Grasses and grass-like plants Stipa gobica STKR 5-10 Cleistogenes songorica CLSO 5-10 Carex korshinskyi CXKO 2-5 Other perennial grasses PPGG 2-8* *Allow no more than 2 percent of each species and no more than 8 percent in aggregate. COMMON NAME PLANT SYMBOL % COMP Forbs Allium polyrrhizum/ ALLPO/ ALLMGL 5-15 A. mongolicum Other perennial forbs PPFF 1-5 *Allow no more than 1 percent of each species and no more than 5 percent in aggregate. COMMON NAME
PLANT SYMBOL
% COMP 103
Sheehy, D., M. Hale, D. Damiran, T. Sheehy, D. Tsogoo, and Sh. Batsukh. 2012. Monitoring change on Mongolian rangelands. Final report for Netherlands-Mongolia Environmental Trust Fund for Environmental Reform (NEMO). 156 pp.
Shrubs Anabasis brevifolia ANBR 5-10 Reamuria soongorica RESO 10-20 Salsola passerina SAPA 10-20 Other perennial shrubs SSSS 5-10* *Allow no more than 10 percent of each species and no more than 50 percent in aggregate. c. Approximate ground cover is 20-50 percent (basal and crown). d. Annual production per acre (air dry weight): Favorable years: 900 kg/ha Average years: 600 kg/ha Unfavorable years: 100 kg/ha 5. Range of Characteristics Variability in plant composition and production results from variation in soil surface texture and depth. Production increases with increasing soil depth. Basins may have presence of sedges. 6. Response to disturbance If the condition of the site deteriorates as a result of overgrazing, Stipa, Carex and Cleistogenes decrease, while annual grasses (Setaria viridis, Eragrostis minor increase. Shrubs palatable to camels will decrease and undesirable shrubs (Oxytropsis, Kochia Artemisia) increase. With further deterioration, annual forbs and bare ground increases resulting in increased risk of erosion and reduced site productivity. 7. Location of reference sites DG-34 Latitude Longitude 44.8162 107.736 Rolling plains with pale brown weakly solentz soils, slight aspects, 1-5%, 1081 m elevation.
104
Sheehy, D., M. Hale, D. Damiran, T. Sheehy, D. Tsogoo, and Sh. Batsukh. 2012. Monitoring change on Mongolian rangelands. Final report for Netherlands-Mongolia Environmental Trust Fund for Environmental Reform (NEMO). 156 pp.
7. SANDY LOAM 10-15 STIPA/EUROTIA Semi-desert steppe A. PHYSICAL CHARACTERISTICS 1. Physiography This site occurs on rolling uplands and sloping plains. 2. Climate Annual average precipitation is 10-15 cm occurring most during mid-June to the end of August. Localized winds from the south result, in extremely cold, dry winter; dry, cold, and windy conditions in the spring. Mean annual precipitation decreases from north to south. Soil temperature regime is frigid with mean average temperature of 8.7 degrees C. Temperature extremes range from 30 in July to -25 in January. 3. Soils Typic Petrocalcids sandy loam, ochric epipedon, carbonate cemented pan, pedon described to 50 cm 4. Vegetation a. The potential native plant community is dominated by bunchgrass (Stipa gobicus, S. glaresoa, Cleistogenes songorica) forbs Allium mongolicum, A. polyrrhizum, shrubs Eurotia ceratoides, Caragana leucoplhloea, C. microphylla, Caryopteris mongolicum. Annual increaser grasses are Setaria viridis and Eragrostis minor. The vegetative composition of the community is approximately 40% grass, 20% forbs and 40% shrubs. b. The major plant species in the potential community and their potential by air-dry weight: COMMON NAME PLANT SYMBOL % COMP Grasses and grass-like plants Stipa gobica, S. glaresoa STGO, STGL 10-20 Cleistogenes songorica CLSO 5-10 Other perennial grasses PPGG 2-8* *Allow no more than 2 percent of each species and no more than 8 percent in aggregate. COMMON NAME PLANT SYMBOL % COMP Forbs Allium polyrrhizum/ ALLPO/ ALLMGL 5-15 A. mongolicum Heteropappus hispidus HEHI 1-5 Other perennial forbs PPFF 1-5 *Allow no more than 1 percent of each species and no more than 15 percent in aggregate. COMMON NAME
PLANT SYMBOL
% COMP 105
Sheehy, D., M. Hale, D. Damiran, T. Sheehy, D. Tsogoo, and Sh. Batsukh. 2012. Monitoring change on Mongolian rangelands. Final report for Netherlands-Mongolia Environmental Trust Fund for Environmental Reform (NEMO). 156 pp.
Shrubs Eurotia ceratoides EUCE 10-20 Caragana leucophloea CARLE 5-10 Caragana microphylla CARMI 5-10 Caryopteris mongolicum CAMO 1-5 Other perennial shrubs SSSS 5-10* *Allow no more than 10 percent of each species and no more than 40 percent in aggregate. c. Approximate ground cover is 20-50 percent (basal and crown). d. Annual production per acre (air dry weight): Favorable years: 800 kg/ha Average years: 400 kg/ha Unfavorable years: 200 kg/ha 5. Range of Characteristics Variability in plant composition and production results from variation in soil surface texture and depth. Production increases with increasing soil depth. 6. Response to disturbance If the condition of the site deteriorates as a result of overgrazing, Stipa and Cleistogenes decrease, while annual grasses (Setaria viridis, Eragrostis minor increase. Palatable Eurotia decreases with overgrazing while Anjania and Artemisia increase. With further deterioration, annual forbs unpalatable shrubs and bare ground increases resulting in increased risk of erosion and reduced site productivity. 7. Location of reference sites DG-01 Latitude Longitude 45.1703 108.461 Gentle north sloping plain, 5-15%, brown sandy soils, locally in combination with perennial saltworts on solonetz brown soils DG-06 Latitude Longitude 45.3037 107.97 Gentle north sloping plain, 5-15%, brown sandy soils, locally in combination with perennial saltworts on solonetz brown soils
106
Sheehy, D., M. Hale, D. Damiran, T. Sheehy, D. Tsogoo, and Sh. Batsukh. 2012. Monitoring change on Mongolian rangelands. Final report for Netherlands-Mongolia Environmental Trust Fund for Environmental Reform (NEMO). 156 pp.
8. LOAMY 7-13 STIPA/ANABASIS/SYMPEGMA DESERT-SEMI-DESERT
A. PHYSICAL CHARACTERISTICS 1. Physiography This site occurs on sloping, outwash plains, pena-plains with inclusions of droughty bottoms and swales. 2. Climate Annual average precipitation is 7-13 cm occurring most during mid-June to the end of August. Localized winds from the south result, in extremely cold, dry winter; dry, cold, and windy conditions in the spring. Mean annual precipitation decreases from north to south. Soil temperature regime is frigid with mean average temperature of 8.7 degrees C. Temperature extremes range from 30 in July to -25 in January. 3. Soils Petronodic and or Typic Haplocambid loams, ochric epipedon, pedon described to 50 cm 4. Vegetation a. The potential native plant community is shrub dominate with bunchgrass (Stipa glaresoa, Cleistogenes songorica) forbs Allium polyrrhizum, shrubs Caragana stenophylla, Anabasis brevifolia, Sympegma regelii and Salsola passerina. Annual increaser grasses are Setaria viridis and Eragrostis minor. The vegetative composition of the community is approximately 25% grass, 15% forbs and 60% shrubs. b. The major plant species in the potential community and their potential by air-dry weight: COMMON NAME PLANT SYMBOL % COMP Grasses and grass-like plants Stipa gobica, S. glaresoa STGO, STGL 10-20 Cleistogenes songorica CLSO 5-10 Other perennial grasses PPGG 2-5* *Allow no more than 2 percent of each species and no more than 5 percent in aggregate. COMMON NAME PLANT SYMBOL % COMP Forbs Allium polyrrhizum ALLPO 5-15 Other perennial forbs PPFF 1-5 *Allow no more than 1 percent of each species and no more than 5 percent in aggregate. COMMON NAME Shrubs
PLANT SYMBOL
% COMP
107
Sheehy, D., M. Hale, D. Damiran, T. Sheehy, D. Tsogoo, and Sh. Batsukh. 2012. Monitoring change on Mongolian rangelands. Final report for Netherlands-Mongolia Environmental Trust Fund for Environmental Reform (NEMO). 156 pp.
Caragana stenophylla CARST 10-20 Anabasis brevifolia ANBR 5-10 Sympegma regelii SYRE 5-10 Salsola passerina SAPA 5-10 Other perennial shrubs SSSS 5-10* *Allow no more than 10 percent of each species and no more than 10 percent in aggregate. c. Approximate ground cover is 20-50 percent (basal and crown). d. Annual production per acre (air dry weight): Favorable years: 800 kg/ha Average years: 400 kg/ha Unfavorable years: 200 kg/ha 5. Range of Characteristics Variability in plant composition and production results from variation in soil surface texture and depth. Production increases with increasing soil depth. 6. Response to disturbance If the condition of the site deteriorates as a result of overgrazing, bunchgrasses Stipa and Cleistogenes decrease, while annual grasses (Setaria viridis, Eragrostis minor increase. Palatable Caragana shrubs decrease with overgrazing while Anjania and Artemisia shrubs increase. With further deterioration, annual forbs and bare ground increases resulting in increased risk of erosion and reduced site productivity. 7. Location of reference sites OT-1R Latitude Longitude 42.6541 107.447 South desert plateau, pale brown soils, no aspect, 1014 m elevation OT-2R Latitude Longitude 42.650 107.288 South desert plains, pale brown to grey brown solonetz soils, no aspect, 991 m elevation OT-3-R Latitude Longitude 42.666 107.226 South desert plains, pale brown soils, no aspect, 945 m elevation OT-4R Latitude Longitude 42.719 107.126 108
Sheehy, D., M. Hale, D. Damiran, T. Sheehy, D. Tsogoo, and Sh. Batsukh. 2012. Monitoring change on Mongolian rangelands. Final report for Netherlands-Mongolia Environmental Trust Fund for Environmental Reform (NEMO). 156 pp.
Middle desert/steppificated desert plain, pale brown soils, no aspect, 986 m elevation 9. CLAY LOAM 7-13 STIPA/ANABASIS/REAMURIA DESERT STEPPE A. PHYSICAL CHARACTERISTICS 1. Physiography This site occurs on outwash plains, terraces, swales, loamy bottoms with inclusions of sodic floodplains and sandy dunes. 2. Climate Annual average precipitation is 7-13 cm occurring most during mid-June to the end of August. Localized winds from the south result, in extremely cold, dry winter; dry, cold, and windy conditions in the spring. Mean annual precipitation decreases from north to south. Soil temperature regime is frigid with mean average temperature of 8.7 degrees C. Temperature extremes range from 30 in July to -25 in January. 3. Soils Typic Haplargids and Petronodic Haplargids, if calcic horizon is present then Typic Calciargids, clay loam to light clay loam, pedon described from 25 to 45 cm 4. Vegetation a. The potential native plant community is shrub dominate with bunchgrass (Stipa gobica, Cleistogenes songorica) forbs Allium polyrrhizum, Haplophyllum dauricum, shrubs Caragana leucophloea, Anabasis brevifolia, Reaumuria soongorica, Salsola passerine and Nitraria siberica. Annual increaser grasses are Setaria viridis and Eragrostis minor. The vegetative composition of the community is approximately 25% grass, 15% forbs and 60% shrubs. b. The major plant species in the potential community and their potential by air-dry weight: COMMON NAME PLANT SYMBOL % COMP Grasses and grass-like plants Stipa gobica, S. glaresoa STGO, STGL 10-20 Cleistogenes songorica CLSO 5-10 Other perennial grasses PPGG 2-5* *Allow no more than 2 percent of each species and no more than 5 percent in aggregate. COMMON NAME PLANT SYMBOL % COMP Forbs Allium polyrrhizum ALLPO 5-15 Haplophyllum dauricum HADA 1-5 Other perennial forbs PPFF 1-5 *Allow no more than 1 percent of each species and no more than 5 percent in aggregate.
109
Sheehy, D., M. Hale, D. Damiran, T. Sheehy, D. Tsogoo, and Sh. Batsukh. 2012. Monitoring change on Mongolian rangelands. Final report for Netherlands-Mongolia Environmental Trust Fund for Environmental Reform (NEMO). 156 pp.
COMMON NAME PLANT SYMBOL % COMP Shrubs Caragana leucophloea CARLE 10-20 Anabasis brevifolia ANBR 5-10 Reaumuria soongorica RESO 5-10 Salsola passerina SAPA 5-10 Other perennial shrubs SSSS 5-10* *Allow no more than 10 percent of each species and no more than 10 percent in aggregate. c. Approximate ground cover is 20-50 percent (basal and crown). d. Annual production per acre (air dry weight): Favorable years: 600 kg/ha Average years: 300 kg/ha Unfavorable years: 100 kg/ha 5. Range of Characteristics Variability in plant composition and production results from variation in soil surface texture and depth. Production increases with increasing soil depth. Shifting dunes of sandy loam to loamy sands occur on terraces 6. Response to disturbance If the condition of the site deteriorates as a result of overgrazing, bunchgrasses Stipa and Cleistogenes decrease, while annual grasses (Aristida heymannii, Setaria viridis, Eragrostis minor increase. Palatable Caragana shrubs decrease with overgrazing while Anjania and Artemisia shrubs increase. With further deterioration, annual forbs and bare ground increases resulting in increased risk of erosion and reduced site productivity. 7. Location of reference sites DO-16 Latitude Longitude 42.727 108.749 Plains with inclusions of swales and loamy bottoms, pale brown locally weak solonetz soils, no aspect, 1108 m elevation OT-5R Latitude Longitude 42.773 107.034 Loamy bottom, pale brown soils, no aspect, 1023 m elevation OT-10W Latitude Longitude 43.188 106.979
110
Sheehy, D., M. Hale, D. Damiran, T. Sheehy, D. Tsogoo, and Sh. Batsukh. 2012. Monitoring change on Mongolian rangelands. Final report for Netherlands-Mongolia Environmental Trust Fund for Environmental Reform (NEMO). 156 pp.
Outwash plain, with dune formations, pale-brown locally weakly solonetz soils and or grey-brown solonetz soils and solonchak soils, no aspect, 1125 m elevation OT-12W Latitude Longitude 43.348 107.277 Sodic bottom, pale brown solonchak soils, no aspect, 1056 m elevation
111
Sheehy, D., M. Hale, D. Damiran, T. Sheehy, D. Tsogoo, and Sh. Batsukh. 2012. Monitoring change on Mongolian rangelands. Final report for Netherlands-Mongolia Environmental Trust Fund for Environmental Reform (NEMO). 156 pp.
10. LOAMY SKELETAL 7-13 STIPA/ANABASIS DESERT STEPPE A. PHYSICAL CHARACTERISTICS 1. Physiography This site occurs on gravely mountain ridges, rolling hills with inclusions of swales. 2. Climate Annual average precipitation is 7-13 cm occurring most during mid-June to the end of August. Localized winds from the south result, in extremely cold, dry winter; dry, cold, and windy conditions in the spring. Mean annual precipitation decreases from north to south. Soil temperature regime is frigid with mean average temperature of 8.7 degrees C. Temperature extremes range from 30 in July to -25 in January. 3. Soils Petronodic Haplocambids, ochric epipedon, pale brown to grey brown solenetz loamy soils, pedon described to 23 cm 4. Vegetation a. The potential native plant community is shrub dominate with bunchgrass (Stipa crylobii and Ptiloagrostis pellioti), forbs Allium polyrrhizum, Haplophyllum dauricum, shrubs Amygdalus mongolica, Caragana leucophloea, Anabasis brevifolia and Anjania achilloides. Annual increaser grasses are Aristida heymannii and Eragrostis minor. The vegetative composition of the community is approximately 25% grass, 15% forbs and 60% shrubs. b. The major plant species in the potential community and their potential by air-dry weight: COMMON NAME PLANT SYMBOL % COMP Grasses and grass-like plants Stipa crylobii STCR 10-20 Ptilagrostis pelliottii PTPE 5-10 Other perennial grasses PPGG 2-5* *Allow no more than 2 percent of each species and no more than 5 percent in aggregate. COMMON NAME PLANT SYMBOL % COMP Forbs Allium polyrrhizum ALLPO 5-15 Haplophyllum dauricum HADA 1-5 Other perennial forbs PPFF 1-5 *Allow no more than 1 percent of each species and no more than 5 percent in aggregate. COMMON NAME Shrubs
PLANT SYMBOL
% COMP
112
Sheehy, D., M. Hale, D. Damiran, T. Sheehy, D. Tsogoo, and Sh. Batsukh. 2012. Monitoring change on Mongolian rangelands. Final report for Netherlands-Mongolia Environmental Trust Fund for Environmental Reform (NEMO). 156 pp.
Caragana leucophloea CARLE 10-20 Anabasis brevifolia ANBR 5-10 Reaumuria soongorica SYRE 5-10 Salsola passerina SAPA 5-10 Other perennial shrubs SSSS 5-10* *Allow no more than 10 percent of each species and no more than 10 percent in aggregate. c. Approximate ground cover is 20-50 percent (basal and crown). d. Annual production per acre (air dry weight): Favorable years: 400 kg/ha Average years: 200 kg/ha Unfavorable years: 100 kg/ha 5. Range of Characteristics Variability in plant composition and production results from variation in soil surface texture and depth. Production increases with increasing soil depth. Shifting dunes of sandy loam to loamy sands occur on terraces 6. Response to disturbance If the condition of the site deteriorates as a result of overgrazing, bunchgrasses Stipa and Ptilagrostis decrease, while annual grasses (Aristida heymannii, Setaria viridis, Eragrostis minor increase. Palatable Caragana shrubs decrease with overgrazing while Anjania and Artemisia shrubs increase. With further deterioration, annual forbs (Convolvulus ammanii) and bare ground increases resulting in increased risk of erosion and reduced site productivity. 7. Location of reference sites OT-6M Latitude Longitude 42.870 107.013 Old mountain ridge, rolling hills, slight aspects, 1086 m elevation
113
Sheehy, D., M. Hale, D. Damiran, T. Sheehy, D. Tsogoo, and Sh. Batsukh. 2012. Monitoring change on Mongolian rangelands. Final report for Netherlands-Mongolia Environmental Trust Fund for Environmental Reform (NEMO). 156 pp.
11. LOAMY SAND 7-13 STIPA/CARAGANA/EUROTIA DESERT STEPPE A. PHYSICAL CHARACTERISTICS 1. Physiography This site occurs on plateaus and associated outwash plains with inclusions of flood plains, swales and loamy bottoms. 2. Climate Annual average precipitation is 7-13 cm occurring most during mid-June to the end of August. Localized winds from the south result, in extremely cold, dry winter; dry, cold, and windy conditions in the spring. Mean annual precipitation decreases from north to south. Soil temperature regime is frigid with mean average temperature of 8.7 degrees C. Temperature extremes range from 30 in July to -25 in January. 3. Soils Typic Torriorthents and Torripsamments pale brown loamy sands, pedon described 45-65 cm 4. Vegetation a. The potential native plant community is shrub dominate with bunchgrass (Stipa gobica, S. glareosa and Cleistogenes squarrosa), forbs Allium polyrrhizum, A. mongolicum, Lagochilus ilicifolius, Ptilotrichum canescens, shrubs Caragana leucophloea, C. bungei, Anabasis brevifolia, Eurotia ceratoides, Atraphaxis frutescens and Anjania achilloides. Annual increaser grasses are Aristida heymannii and Eragrostis minor. The vegetative composition of the community is approximately 30% grass, 20% forbs and 50% shrubs. b. The major plant species in the potential community and their potential by air-dry weight: COMMON NAME PLANT SYMBOL % COMP Grasses and grass-like plants Stipa gobica/ S. glareosa STCR, STGL 10-20 Cleistogenes squarrosa CLSQ 5-10 Other perennial grasses PPGG 2-5* *Allow no more than 2 percent of each species and no more than 5 percent in aggregate. COMMON NAME PLANT SYMBOL % COMP Forbs Allium polyrrhizum/A. ALLPO, ALLMO 5-15 mongolicum Lagochilus ilicifolius LAIL 1-5 Ptilotrichum canescens PTCA 1-5 Other perennial forbs PPFF 1-5 *Allow no more than 1 percent of each species and no more than 5 percent in aggregate. 114
Sheehy, D., M. Hale, D. Damiran, T. Sheehy, D. Tsogoo, and Sh. Batsukh. 2012. Monitoring change on Mongolian rangelands. Final report for Netherlands-Mongolia Environmental Trust Fund for Environmental Reform (NEMO). 156 pp.
COMMON NAME PLANT SYMBOL % COMP Shrubs Caragana leucophloea CARLE 10-20 Anabasis brevifolia ANBR 5-10 Reaumuria soongorica SYRE 5-10 Eurotia ceratoides EUCE 5-10 Other perennial shrubs SSSS 5-10* *Allow no more than 10 percent of each species and no more than 10 percent in aggregate. c. Approximate ground cover is 20-50 percent (basal and crown). d. Annual production per acre (air dry weight): Favorable years: 500 kg/ha Average years: 350 kg/ha Unfavorable years: 100 kg/ha 5. Range of Characteristics Variability in plant composition and production results from variation in soil surface texture and depth. Production increases with increasing soil depth. Shifting dunes of sandy loam to loamy sands occur on terraces 6. Response to disturbance If the condition of the site deteriorates as a result of overgrazing, bunchgrasses Stipa and Cleistogenes decrease, while annual grasses (Aristida heymannii, Setaria viridis, Eragrostis minor increase. Palatable Caragana and Eurotia shrubs decrease with overgrazing while Anjania and Artemisia shrubs increase. With further deterioration, annual forbs (Convolvulus ammanii) and bare ground increases resulting in increased risk of erosion and reduced site productivity. 7. Location of reference sites UG-39 Latitude Longitude 44.0121 106.929 Middle desert plateau, no aspect, 1396 m elevation UG-40 Latitude Longitude 44.278 106.678 Middle desert outwash plain, no aspect, 976 m elevation UG-44 Latitude Longitude 44.2105 107.44 115
Sheehy, D., M. Hale, D. Damiran, T. Sheehy, D. Tsogoo, and Sh. Batsukh. 2012. Monitoring change on Mongolian rangelands. Final report for Netherlands-Mongolia Environmental Trust Fund for Environmental Reform (NEMO). 156 pp.
Middle desert plain, no aspect, 1116 m elevation UG-45 Latitude Longitude 43.917 107.493 Middle desert plateau and outwash plain, no aspect, 1115 m elevation
116
Sheehy, D., M. Hale, D. Damiran, T. Sheehy, D. Tsogoo, and Sh. Batsukh. 2012. Monitoring change on Mongolian rangelands. Final report for Netherlands-Mongolia Environmental Trust Fund for Environmental Reform (NEMO). 156 pp.
12. FINE SANDY LOAM 7-13 ZYGOPHYLLUM DUNES/STIPA MIDDLE DESERT A. PHYSICAL CHARACTERISTICS 1. Physiography This site occurs on plateaus and associated outwash plains with shifting dunes inclusions of flood plains, swales and loamy bottoms. 2. Climate Annual average precipitation is 7-13 cm occurring most during mid-June to the end of August. Localized winds from the south result, in extremely cold, dry winter; dry, cold, and windy conditions in the spring. Mean annual precipitation decreases from north to south. Soil temperature regime is frigid with mean average temperature of 8.7 degrees C. Temperature extremes range from 30 in July to -25 in January. 3. Soils Typic Calciargids and Torripsamments pale brown pale-brown locally weakly solonetz soils overlaid with loamy sands, pedon described 25 to cm in inter-dune and 60 cm in dunes. 4. Vegetation a. The potential native plant community is shrub dominate with bunchgrass (Stipa gobica, S. glareosa and Cleistogenes songorica), sedge Carex duriscula, forbs Allium polyrrhizum, shrubs Zygophyllum xanthoxylon, Reamuria soongorica, Eurotia ceratoide, Anabasis brevifolia and Nitraria sphearocarpa. Annual increaser grasses are Aristida heymannii and Eragrostis minor. The vegetative composition of the community is approximately 30% grass, 20% forbs and 50% shrubs. b. The major plant species in the potential community and their potential by air-dry weight: COMMON NAME PLANT SYMBOL % COMP Grasses and grass-like plants Stipa gobica/ S. glareosa STCR, STGL 10-20 Cleistogenes squarrosa CLSQ 5-10 Other perennial grasses PPGG 2-5* *Allow no more than 2 percent of each species and no more than 5 percent in aggregate. COMMON NAME PLANT SYMBOL % COMP Forbs Allium polyrrhizum ALLPO 5-15 Other perennial forbs PPFF 1-5 *Allow no more than 1 percent of each species and no more than 5 percent in aggregate. COMMON NAME
PLANT SYMBOL
% COMP 117
Sheehy, D., M. Hale, D. Damiran, T. Sheehy, D. Tsogoo, and Sh. Batsukh. 2012. Monitoring change on Mongolian rangelands. Final report for Netherlands-Mongolia Environmental Trust Fund for Environmental Reform (NEMO). 156 pp.
Shrubs Zygophyllum xanthoxylon ZYXA 5-10 Reaumuria soongorica RESO 5-10 Eurotia ceratoides EUCE 5-10 Anabasis brevifolia ANBR 5-10 Nitraria sphearocarpa NISP 1-5 Other perennial shrubs SSSS 5-10* *Allow no more than 10 percent of each species and no more than 10 percent in aggregate. c. Approximate ground cover is 20-40 percent (basal and crown). d. Annual production per acre (air dry weight): Favorable years: 600 kg/ha Average years: 400 kg/ha Unfavorable years: 100 kg/ha 5. Range of Characteristics Variability in plant composition and production results from variation in soil surface texture and depth. Production increases with increasing soil depth. Shifting dunes of sandy loam to loamy sands occur on terraces and outwash plains. 6. Response to disturbance If the condition of the site deteriorates as a result of overgrazing, Stipa bunchgrasses Stipa decreases, while annual grasses (Aristida heymannii, Setaria viridis, Eragrostis minor increase. Palatable Caragana and Eurotia shrubs decrease with overgrazing while Anjania and Artemisia shrubs increase. With further deterioration, Cleistogenes decreases and annual forbs (Convolvulus ammanii) and bare ground increases resulting in increased risk of erosion and reduced site productivity. 7. Location of reference sites UG-38 Latitude Longitude 43.7801 107.088 Shifting dunes on plateau, rolling terrain slight aspects, 1232 m elevation OT-11W Latitude Longitude 43.238 107.068 Shifting dunes on terrace, rolling terrain slight aspects, 1082 m elevation
118
Sheehy, D., M. Hale, D. Damiran, T. Sheehy, D. Tsogoo, and Sh. Batsukh. 2012. Monitoring change on Mongolian rangelands. Final report for Netherlands-Mongolia Environmental Trust Fund for Environmental Reform (NEMO). 156 pp.
13. SHRUBBY SANDY LOAM 6-12 HALOXYLON/STIPA/REAMURIA DESERT A. PHYSICAL CHARACTERISTICS 1. Physiography This site occurs on plateaus and plains with shifting dunes and inclusions of swales and loamy bottoms. 2. Climate Annual average precipitation is 6-12 cm occurring most during mid-June to the end of August. Localized winds from the south result, in extremely cold, dry winter; dry, cold, and windy conditions in the spring. Mean annual precipitation decreases from north to south. Soil temperature regime is frigid with mean average temperature of 8.7 degrees C. Temperature extremes range from 30 in July to -25 in January. 3. Soils Typic Torriorthents grey-brown, locally gypsic, sandy, weakly differentiated soils and sands, pedon described 55 to cm. 4. Vegetation a. The potential native plant community is shrub dominate with bunchgrass (Stipa glareosa and Cleistogenes squarrosa), forbs Allium polyrrhizum, shrubs Haloxylon ammodendron, Reamuria soongorica, Nitraria sphearocarpa, Anabasis brevifolia, Eurotia ceratoides, Zygophyllum xanthoxylon. Annual increaser grasses are Aristida heymannii and Eragrostis minor. The vegetative composition of the community is approximately 25% grass, 10% forbs and 65% shrubs. b. The major plant species in the potential community and their potential by air-dry weight: COMMON NAME PLANT SYMBOL % COMP Grasses and grass-like plants Stipa glareosa STGL 10-20 Cleistogenes squarrosa CLSQ 5-10 Other perennial grasses PPGG 2-5* *Allow no more than 2 percent of each species and no more than 5 percent in aggregate. COMMON NAME PLANT SYMBOL % COMP Forbs Allium polyrrhizum ALLPO 5-15 Other perennial forbs PPFF 1-5 *Allow no more than 1 percent of each species and no more than 5 percent in aggregate. COMMON NAME
PLANT SYMBOL
% COMP 119
Sheehy, D., M. Hale, D. Damiran, T. Sheehy, D. Tsogoo, and Sh. Batsukh. 2012. Monitoring change on Mongolian rangelands. Final report for Netherlands-Mongolia Environmental Trust Fund for Environmental Reform (NEMO). 156 pp.
Shrubs Haloxylon ammodendron HAAM 10-20 Reaumuria soongorica RESO 5-10 Eurotia ceratoides EUCE 5-10 Anabasis brevifolia ANBR 5-10 Nitraria sphearocarpa NISP 1-5 Zygophyllum xanthoxylon ZYXA 1-5 Other perennial shrubs SSSS 5-10* *Allow no more than 10 percent of each species and no more than 10 percent in aggregate. c. Approximate ground cover is 20-40 percent (basal and crown). d. Annual production per acre (air dry weight): Favorable years: 600 kg/ha Average years: 400 kg/ha Unfavorable years: 100 kg/ha 5. Range of Characteristics Variability in plant composition and production results from variation in soil surface texture and depth. Production increases with increasing soil depth. Shifting dunes of sandy loam to loamy sands occur on terraces and outwash plains. 6. Response to disturbance If the condition of the site deteriorates as a result of overgrazing, Stipa bunchgrasses Stipa decreases, while annual grasses (Aristida heymannii, Setaria viridis, Eragrostis minor increase. Palatable Haloxylon and Eurotia shrubs decrease with overgrazing while unpalatable and toxic shrubs increase. With further deterioration, Cleistogenes decreases and annual forbs (Convolvulus ammanii) and bare ground increases resulting in increased risk of erosion and reduced site productivity.
7. Location of reference sites UG-47 Latitude Longitude 43.2065 108.011 Dunes and interspaces on terraces in association with outwash plains and fans, no aspect, 854 m elevation
120
Sheehy, D., M. Hale, D. Damiran, T. Sheehy, D. Tsogoo, and Sh. Batsukh. 2012. Monitoring change on Mongolian rangelands. Final report for Netherlands-Mongolia Environmental Trust Fund for Environmental Reform (NEMO). 156 pp.
14. DESERT LOAM 6-12 NITRARIA/STIPA DESERT A. PHYSICAL CHARACTERISTICS 1. Physiography This site occurs on level plains, plateaus and terraces in association with shifting dunes. 2. Climate Annual average precipitation is 6-12 cm occurring most during mid-June to the end of August. Localized winds from the south result, in extremely cold, dry winter; dry, cold, and windy conditions in the spring. Mean annual precipitation decreases from north to south. Soil temperature regime is frigid with mean average temperature of 8.7 degrees C. Temperature extremes range from 30 in July to -25 in January. 3. Soils Typic Haplargids, grey-brown skeleton and raw soils, ochric epipedon, argillic horizon, gravelly loam, pedon described 48 to cm. 4. Vegetation a. The potential native plant community is shrub dominate with Nitraria sphearocarpa and Haloxylon ammodendron on dunes, Reamuria soongorica and Anabasis brevifolia on inter-dune sites and Eurotia ceratoides presence on swale inclusions, bunchgrasses Stipa glareosa and Cleistogenes squarrosa and forb Allium polyrrhizum. Annual increaser grasses are Aristida heymannii and Eragrostis minor. The vegetative composition of the community is approximately 25% grass, 10% forbs and 65% shrubs. b. The major plant species in the potential community and their potential by air-dry weight: COMMON NAME PLANT SYMBOL % COMP Grasses and grass-like plants Stipa glareosa STGL 10-20 Cleistogenes squarrosa CLSQ 5-10 Other perennial grasses PPGG 2-5* *Allow no more than 2 percent of each species and no more than 5 percent in aggregate. COMMON NAME PLANT SYMBOL % COMP Forbs Allium polyrrhizum ALLPO 5-15 Other perennial forbs PPFF 1-5 *Allow no more than 1 percent of each species and no more than 5 percent in aggregate. COMMON NAME Shrubs
PLANT SYMBOL
% COMP
121
Sheehy, D., M. Hale, D. Damiran, T. Sheehy, D. Tsogoo, and Sh. Batsukh. 2012. Monitoring change on Mongolian rangelands. Final report for Netherlands-Mongolia Environmental Trust Fund for Environmental Reform (NEMO). 156 pp.
Nitraria sphearocarpa NISP 10-20 Haloxylon ammodendron HAAM 5-10 Reaumuria soongorica RESO 5-10 Eurotia ceratoides EUCE 5-10 Anabasis brevifolia ANBR 5-10 Zygophyllum xanthoxylon ZYXA 1-5 Other perennial shrubs SSSS 5-10* *Allow no more than 10 percent of each species and no more than 10 percent in aggregate. c. Approximate ground cover is 20-40 percent (basal and crown). d. Annual production per acre (air dry weight): Favorable years: 400 kg/ha Average years: 200 kg/ha Unfavorable years: 150 kg/ha 5. Range of Characteristics Variability in plant composition and production results from variation in soil surface texture and depth. Production increases with increasing soil depth. Shifting dunes of sandy loam to loamy sand occur on terraces and outwash plains. 6. Response to disturbance If the condition of the site deteriorates as a result of overgrazing, Stipa bunchgrass decreases, palatable Haloxylon and Eurotia shrubs decrease and unpalatable and toxic shrubs increase. With further deterioration, annual forbs (Convolvulus ammanii) and bare ground increase resulting in increased risk of erosion and reduced site productivity.
7. Location of reference sites UG-46 Latitude Longitude 43.7478 107.843 Level plain with shifting dunes, no aspect, 884 m elevation
122
Sheehy, D., M. Hale, D. Damiran, T. Sheehy, D. Tsogoo, and Sh. Batsukh. 2012. Monitoring change on Mongolian rangelands. Final report for Netherlands-Mongolia Environmental Trust Fund for Environmental Reform (NEMO). 156 pp.
123
Sheehy, D., M. Hale, D. Damiran, T. Sheehy, D. Tsogoo, and Sh. Batsukh. 2012. Monitoring change on Mongolian rangelands. Final report for Netherlands-Mongolia Environmental Trust Fund for Environmental Reform (NEMO). 156 pp.
15. DROUGHTY LOAM 7-13 HALOXYLON/STIPA DESERT A. PHYSICAL CHARACTERISTICS 1. Physiography This site occurs on level plains, plateaus and terraces in association with shifting dunes. 2. Climate Annual average precipitation is 7-13 cm occurring most during mid-June to the end of August. Localized winds from the south result, in extremely cold, dry winter; dry, cold, and windy conditions in the spring. Mean annual precipitation decreases from north to south. Soil temperature regime is frigid with mean average temperature of 8.7 degrees C. Temperature extremes range from 30 in July to -25 in January. 3. Soils Typic Petrocalcids to Petronodic Haplocambids grey-brown gypsic skeleton and raw soils, ochric epipedon, silt loam to loamy sands, pedon described 43 to 60 cm. 4. Vegetation a. The potential native plant community is shrub dominate with Haloxylon ammodendron and Nitraria sphearocarpa on dunes and Anabasis brevifolia and Reamuria soongorica on inter-dune sites. Bunchgrass Stipa glareosa and Carex stenophyloides are the dominant perennial grass. Allium polyrrhizum. Annual increaser grasses are Aristida heymannii and Eragrostis minor. The vegetative composition of the community is approximately 25% grass, 10% forbs and 65% shrubs. b. The major plant species in the potential community and their potential by air-dry weight: COMMON NAME PLANT SYMBOL % COMP Grasses and grass-like plants Stipa glareosa STGL 10-20 Cleistogenes squarrosa CLSQ 5-10 Other perennial grasses PPGG 2-5* *Allow no more than 2 percent of each species and no more than 5 percent in aggregate. COMMON NAME PLANT SYMBOL % COMP Forbs Allium polyrrhizum ALLPO 5-15 Other perennial forbs PPFF 1-5 *Allow no more than 1 percent of each species and no more than 5 percent in aggregate. COMMON NAME Shrubs
PLANT SYMBOL
% COMP
124
Sheehy, D., M. Hale, D. Damiran, T. Sheehy, D. Tsogoo, and Sh. Batsukh. 2012. Monitoring change on Mongolian rangelands. Final report for Netherlands-Mongolia Environmental Trust Fund for Environmental Reform (NEMO). 156 pp.
Haloxylon ammodendron HAAM 10-20 Nitraria sphearocarpa NISP 5-10 Salsola passerina SAPA 5-10 Reamuria soongorica RESO 5-10 Anabasis brevifolia ANBR 5-10 Eurotia ceratoides EUCE 1-5 Other perennial shrubs SSSS 5-10* *Allow no more than 10 percent of each species and no more than 10 percent in aggregate. c. Approximate ground cover is 20-40 percent (basal and crown). d. Annual production per acre (air dry weight): Favorable years: 400 kg/ha Average years: 200 kg/ha Unfavorable years: 150 kg/ha 5. Range of Characteristics Variability in plant composition and production results from variation in soil surface texture and depth. Production increases with increasing soil depth. Shifting dunes of sandy loam to loamy sand occur on terraces and outwash plains. 6. Response to disturbance If the condition of the site deteriorates as a result of overgrazing, Stipa bunchgrass decreases, palatable Haloxylon, Salsola and Eurotia shrubs decrease while unpalatable and toxic shrubs increase. With further deterioration, forbs Convolvulus ammanii, Peganum nigellastrum and bare ground increase resulting in increased risk of erosion and reduced site productivity.
7. Location of reference sites DO-15 Latitude Longitude 43.4076 108.183 Plains and rolling hills with inclusions of gravelly fans, no aspect, 849 m elevation
OT-13W Latitude Longitude 43.357 107.293 Plains with shifting sand dunes, no aspect, 981 m elevation
125
Sheehy, D., M. Hale, D. Damiran, T. Sheehy, D. Tsogoo, and Sh. Batsukh. 2012. Monitoring change on Mongolian rangelands. Final report for Netherlands-Mongolia Environmental Trust Fund for Environmental Reform (NEMO). 156 pp.
16. SODIC LOAM 7-13 NITRARIA/STIPA/ACHNETHERUM DUNES A. PHYSICAL CHARACTERISTICS 1. Physiography This site occurs on outwash plains and terraces in association with dry flood plains and loamy swales. Dune forming sands occur on terraces and plains. 2. Climate Annual average precipitation is 7-13 cm occurring most during mid-June to the end of August. Localized winds from the south result, in extremely cold, dry winter; dry, cold, and windy conditions in the spring. Mean annual precipitation decreases from north to south. Soil temperature regime is frigid with mean average temperature of 8.7 degrees C. Temperature extremes range from 30 in July to -25 in January. 3. Soils Typic Haplargids grey-brown solonetz and solanchak soils with primitive sair soils in dunes, ochric epipedon, loam to loamy sands, pedon described to 65 cm. 4. Vegetation a. The potential native plant community is shrub dominate with Nitraria siberica on dunes with occasional Tamarix tugals. Kalidium foliatum, Reamuria soongorica and Salsola passerine are dominant on inter-dune sites. Bunchgrass Stipa glareosa and Achnatherum splendens occur discretely in the site. Allium polyrrhizum is the dominant forb. Annual increaser grasses are Aristida heymannii and Eragrostis minor. The vegetative composition of the community is approximately 30% grass, 20% forbs and 50% shrubs. b. The major plant species in the potential community and their potential by air-dry weight: COMMON NAME PLANT SYMBOL % COMP Grasses and grass-like plants Achnetherum splendens ACSP 5-15 Stipa glareosa STGL 5-10 Other perennial grasses PPGG 2-5* *Allow no more than 2 percent of each species and no more than 5 percent in aggregate. COMMON NAME PLANT SYMBOL % COMP Forbs Allium polyrrhizum ALLPO 5-15 Other perennial forbs PPFF 1-5 *Allow no more than 1 percent of each species and no more than 5 percent in aggregate. COMMON NAME
PLANT SYMBOL
% COMP 126
Sheehy, D., M. Hale, D. Damiran, T. Sheehy, D. Tsogoo, and Sh. Batsukh. 2012. Monitoring change on Mongolian rangelands. Final report for Netherlands-Mongolia Environmental Trust Fund for Environmental Reform (NEMO). 156 pp.
Shrubs Nitraria sphearocarpa NISP 10-20 Kalidium foliatum KAFO 5-10 Reamuria soongorica RESO 5-10 Salsola passerina SAPA 5-10 Other perennial shrubs SSSS 5-10* *Allow no more than 10 percent of each species and no more than 10 percent in aggregate. c. Approximate ground cover is 20-40 percent (basal and crown). d. Annual production per acre (air dry weight): Favorable years: 700 kg/ha Average years: 400 kg/ha Unfavorable years: 150 kg/ha 5. Range of Characteristics Variability in plant composition and production results from variation in soil surface texture and depth. Production increases with increasing soil depth. Shifting dunes of sandy loam to loamy sand occur on terraces and outwash plains. 6. Response to disturbance If the condition of the site deteriorates as a result of overgrazing, Stipa bunchgrass and Achnetherum decreases, palatable shrubs decrease while unpalatable and toxic shrubs increase. With further deterioration, annual forbs, e.g. Convolvulus ammanii, and bare ground increase resulting in increased risk of erosion and reduced site productivity. 7. Location of reference sites DO-04A Latitude Longitude 44.0458 108.024 South sloping dry flood plain, 975 m elevation DO-04B Latitude Longitude 44.9635 109.229 Terrace in association with flood plains, swales and wet meadows, no aspect, 981 m elevation
127
Sheehy, D., M. Hale, D. Damiran, T. Sheehy, D. Tsogoo, and Sh. Batsukh. 2012. Monitoring change on Mongolian rangelands. Final report for Netherlands-Mongolia Environmental Trust Fund for Environmental Reform (NEMO). 156 pp.
17. WET MEADOW 7-13 PHRAGMITES/JUNCUS MEADOW A. PHYSICAL CHARACTERISTICS 1. Physiography This site occurs on terraces, outwash plains and flood plains in association with dry flood plains and loamy swales. Dune forming sands occur on terraces and plains. 2. Climate Annual average precipitation is 7-13 cm occurring most during mid-June to the end of August. Localized winds from the south result, in extremely cold, dry winter; dry, cold, and windy conditions in the spring. Mean annual precipitation decreases from north to south. Soil temperature regime is frigid with mean average temperature of 8.7 degrees C. Temperature extremes range from 30 in July to -25 in January. 3. Soils Typic Haplargids meadow-swampy soils in combination with: a) saline swampy clay-mucky gley soils; b) swampy peaty soils; c) peaty gley soils, silty clay loam, pedon described to 65 cm. 4. Vegetation a. The potential native plant community is rush and grass dominant with Phragmites communis, Juncus salsuginosus, Agrostis trinii and Poa pratensis. Forb component includes Halerpestes ruthenica and Ranunculus japonicus. The vegetative composition of the community is approximately 70% grass and grasslike and 30% forbs. b. The major plant species in the potential community and their potential by air-dry weight: COMMON NAME PLANT SYMBOL % COMP Grasses and grass-like plants Phragmites communis PHCO 10-20 Juncus salsuginosus JUSA 5-20 Agrostis trinii AGTR 5-10 Poa pratensis POPR 5-10 Other perennial grasses PPGG 5-10* *Allow no more than 5 percent of each species and no more than 10 percent in aggregate. COMMON NAME PLANT SYMBOL % COMP Forbs Halerpestes ruthenica HARU 5-15 Ranunculus japonicus RAJO 2-10 Other perennial forbs PPFF 2-10 *Allow no more than 2 percent of each species and no more than 10 percent in aggregate.
128
Sheehy, D., M. Hale, D. Damiran, T. Sheehy, D. Tsogoo, and Sh. Batsukh. 2012. Monitoring change on Mongolian rangelands. Final report for Netherlands-Mongolia Environmental Trust Fund for Environmental Reform (NEMO). 156 pp.
c. Approximate ground cover is 20-40 percent (basal and crown). d. Annual production per acre (air dry weight): Favorable years: 1500 kg/ha Average years: 1000 kg/ha Unfavorable years: 500 kg/ha 5. Range of Characteristics Variability in plant composition and production results from variation in soil surface texture and depth. Production increases with increasing soil depth and moisture availability. 6. Response to disturbance If the condition of the site deteriorates as a result of overgrazing, grasses decreases while unpalatable and toxic forbs increase, (i.e. Ranunculus spp). With further deterioration, annual forbs, e.g. Convolvulus ammanii and bare ground increase resulting in increased risk of erosion and reduced site productivity. 7. Location of reference sites D0-04C Latitude Longitude 44.0458 108.024 South sloping wet meadow in association with dry flood plain and terrace, 975 m elevation
129
Sheehy, D., M. Hale, D. Damiran, T. Sheehy, D. Tsogoo, and Sh. Batsukh. 2012. Monitoring change on Mongolian rangelands. Final report for Netherlands-Mongolia Environmental Trust Fund for Environmental Reform (NEMO). 156 pp.
18. SILT LOAM 7-13 STIPA/ANABASIS/REAMURIA DESERT A. PHYSICAL CHARACTERISTICS 1. Physiography This site occurs on plateaus, terraces, outwash plains and flood plains in association with dry flood plains and loamy swales. Dune forming sands occur on terraces and plains. 2. Climate Annual average precipitation is 7-13 cm occurring most during mid-June to the end of August. Localized winds from the south result, in extremely cold, dry winter; dry, cold, and windy conditions in the spring. Mean annual precipitation decreases from north to south. Soil temperature regime is frigid with mean average temperature of 8.7 degrees C. Temperature extremes range from 30 in July to -25 in January. 3. Soils Typic Haplocalcids and or Typic Petrocalcids pale-brown to pale to pale solonetz-solonchak soils, loamy silt loam, pedon described to 70 cm 4. Vegetation a. The potential native plant community is shrub dominant with Reamuria soongorica, Anabasis brevifolia and Salsola passerina. Dominant bunchgrass is Stipa gobica and Cleistogenes songorica. Allium polyrrhizum is present in mid to late seral condition. Annual increaser grasses are Aristida heymannii and Eragrostis minor. The vegetative composition of the community is approximately 30% grass, 15% forbs and 65% shrubs. b. The major plant species in the potential community and their potential by air-dry weight: COMMON NAME PLANT SYMBOL % COMP Grasses and grass-like plants Stipa glareosa STGL 10-20 Cleistogenes songorica CLSO 10-20 Other perennial grasses PPGG 2-5* *Allow no more than 2 percent of each species and no more than 5 percent in aggregate. COMMON NAME PLANT SYMBOL % COMP Forbs Allium polyrrhizum ALLPO 5-15 Other perennial forbs PPFF 1-5 *Allow no more than 1 percent of each species and no more than 5 percent in aggregate. COMMON NAME Shrubs
PLANT SYMBOL
% COMP
130
Sheehy, D., M. Hale, D. Damiran, T. Sheehy, D. Tsogoo, and Sh. Batsukh. 2012. Monitoring change on Mongolian rangelands. Final report for Netherlands-Mongolia Environmental Trust Fund for Environmental Reform (NEMO). 156 pp.
Reamuria soongorica RESO 10-20 Anabasis brevifolia ANBR 5-10 Salsola passerina SAPA 5-10 Other perennial shrubs SSSS 5-10* *Allow no more than 10 percent of each species and no more than 10 percent in aggregate. c. Approximate ground cover is 20-40 percent (basal and crown). d. Annual production per acre (air dry weight): Favorable years: 600 kg/ha Average years: 450 kg/ha Unfavorable years: 100 kg/ha 5. Range of Characteristics Variability in plant composition and production results from variation in soil surface texture and depth. Production increases with increasing soil depth and moisture availability. 6. Response to disturbance If the condition of the site deteriorates as a result of overgrazing, grasses decreases while unpalatable and toxic forbs increase. With further deterioration, annual forbs, e.g. Convolvulus ammanii and bare ground increase resulting in increased risk of erosion and reduced site productivity. 7. Location of reference sites OT-8R Latitude Longitude 43.007 106.945 Terrace with inclusions of loamy bottoms and sodic floodplains, pale brown soils, no aspect, 1143 m elevation OT-9W Latitude Longitude 43.012 106.919 Plateau and terraces with inclusion of dry floodplains and swales, no aspect, 1183 m elevation
131
Sheehy, D., M. Hale, D. Damiran, T. Sheehy, D. Tsogoo, and Sh. Batsukh. 2012. Monitoring change on Mongolian rangelands. Final report for Netherlands-Mongolia Environmental Trust Fund for Environmental Reform (NEMO). 156 pp.
19. LOAMY SILT 7-13 STIPA/IRIS/AMYGDALUS MIDDLE DESERT STEPPE A. PHYSICAL CHARACTERISTICS 1. Physiography This site occurs on sloping hills and ridges, in association with loamy bottoms and swales. 2. Climate Annual average precipitation is 7-13 cm occurring most during mid-June to the end of August. Localized winds from the south result, in extremely cold, dry winter; dry, cold, and windy conditions in the spring. Mean annual precipitation decreases from north to south. Soil temperature regime is frigid with mean average temperature of 8.7 degrees C. Temperature extremes range from 30 in July to -25 in January. 3. Soils Typic Haplocambids and or Petronodic Haplocambids pale-brown soils, loamy silt loam, pedon described to 70 cm 4. Vegetation a. The potential native plant community is shrub dominant with Amygdalus mongolica, Caragana stenophylla, Zygophyllum xanthoxylon and Anabasis brevifolia. Dominant bunchgrass is Stipa gobica and Cleistogenes songorica with presence of Achnetherum splendens in swales. Iris bungei is a dominant forb with Allium polyrrhizum present in mid to late seral condition. The vegetative composition of the community is approximately 10% grass, 30% forbs and 60% shrubs. b. The major plant species in the potential community and their potential by air-dry weight: COMMON NAME PLANT SYMBOL % COMP Grasses and grass-like plants Stipa glareosa STGL 10-20 Cleistogenes songorica CLSO 10-20 Other perennial grasses PPGG 2-5* *Allow no more than 2 percent of each species and no more than 5 percent in aggregate. COMMON NAME PLANT SYMBOL % COMP Forbs Allium polyrrhizum ALLPO 5-15 Other perennial forbs PPFF 1-5 *Allow no more than 1 percent of each species and no more than 5 percent in aggregate. COMMON NAME
PLANT SYMBOL
% COMP 132
Sheehy, D., M. Hale, D. Damiran, T. Sheehy, D. Tsogoo, and Sh. Batsukh. 2012. Monitoring change on Mongolian rangelands. Final report for Netherlands-Mongolia Environmental Trust Fund for Environmental Reform (NEMO). 156 pp.
Shrubs Reamuria soongorica RESO 10-20 Anabasis brevifolia ANBR 5-10 Salsola passerina SAPA 5-10 Other perennial shrubs SSSS 5-10* *Allow no more than 10 percent of each species and no more than 10 percent in aggregate. c. Approximate ground cover is 20-40 percent (basal and crown). d. Annual production per acre (air dry weight): Favorable years: 700 kg/ha Average years: 500 kg/ha Unfavorable years: 200 kg/ha 5. Range of Characteristics Variability in plant composition and production results from variation in soil surface texture and depth. Production increases with increasing soil depth and moisture availability. 6. Response to disturbance If the condition of the site deteriorates as a result of overgrazing, grasses decreases while unpalatable and toxic forbs increase. With further deterioration, annual forbs, e.g. Convolvulus ammanii, Peganum nigellastrum and Artemesia scoparia and bare ground increase resulting in increased risk of erosion and reduced site productivity. 7. Location of reference sites OT-7M Latitude Longitude 42.939 107.013 Sloping hills with loamy bottoms and swales, slight aspects, 1136 m elevation
133
Sheehy, D., M. Hale, D. Damiran, T. Sheehy, D. Tsogoo, and Sh. Batsukh. 2012. Monitoring change on Mongolian rangelands. Final report for Netherlands-Mongolia Environmental Trust Fund for Environmental Reform (NEMO). 156 pp.
Annex 7. RANGELAND HEALTH INDICATORS IN THREE MONGOLIA AIMAGS: DUNDGOV, DORNOGOV AND OMNIGOV (Michael B. Hale, Consultant) The concept of rangeland health is promoted as an alternative to range condition and assesses the hard to quantify ecological processes, the integrity of soil, vegetation and water in the ecosystem. Qualitative assessments help determine how well ecological processes on a site are functioning. An ecological site inventory (ESI) distinguishes distinct ecological sites based on climate, landform, soils and vegetation and determines the potential natural community (PNC) by the key climax species that a site will support. ESI has potential to provide rapid assessment of ecological sites with a similarity index comparing the present plant community with the PNC. Estimates on a per-species basis of percent foliar cover and percent weight composition, compared to a reference description, rates the site by percent climax vegetation or departure from PNC. Accompanying this data, the observed apparent trend (OAT) and soil surface factors are also estimated. Major land resource area (MLRA) are geographically associated land resource units (LRUs) that comprise many distinct ecological communities used by the NRCS for statewide agricultural planning for interstate, regional, and national planning. MLRAs derive from the ecological province concept and are based on geological land forms, soils and associated plant communities. ESI mapping is delineated by ecological sites that occur within MLRAs. In the Mongolia context, MLRAs may be substituted with major agro-ecological regions and six major rangeland ecosystems, each having different topography, elevation, temperature, rainfall distribution, soils, and vegetation1. Mongolia’s major vegetation zones are: alpine tundra, mountain taiga, mountain steppe and forest steppe, grass steppe, desert steppe, and desert. The 1995-96 MongolianRussian Vegetation Survey mapped vegetation communities and associations across vegetation zones. The Gobi Desert Region, grass steppe, desert steppe and desert dominate with complex of open elm forests and wet meadows. Each site description is prefaced by the vegetation zone followed by the numbered vegetation/soil description. The 2011 survey visited 25 PHYGROW sites in Dorngobi, Dundgobi and Omnigobi Aimags, collecting prescribed quantitative data accompanied with a qualitative assessment of rangeland health2, i.e. collecting ecological site inventory (ESI)3 data including: 1
Batjargal Z. Desertification in Mongolia. Proceedings of an international workshop on rangeland desertification. RALA Report No. 200. Reykjavik: Agricultural Research Institute, 1997. 2 Interpreting Indicators of Rangeland Health Technical Reference 1734-6 V. 4-2005
134
Sheehy, D., M. Hale, D. Damiran, T. Sheehy, D. Tsogoo, and Sh. Batsukh. 2012. Monitoring change on Mongolian rangelands. Final report for Netherlands-Mongolia Environmental Trust Fund for Environmental Reform (NEMO). 156 pp.
1) Ground cover percent of Lichen (L), Moss (M), Litter (LT), Plant basal cover (PC), Stones, larger than 250 cm (ST), Cobbles, between 8 and 250 cm (CB), Gravel, between sand size fraction and 8 cm, GR and Bare ground (BG), where all fractions equal 100% and “T” equals trace amounts less than 0.5%. 2) observed apparent trend (OAT) and soil surface factors (SSF) The OAT indictors include a three level gradient of upward to stable to downward trend assessing plant vigor, seedling viability and presence of surface litter, pedestals and gullies. The SSF indicators to assess soil erosion risk use a five level gradient, i.e. stable, slight, moderate, critical and severe.
Table 1. Observed Apparent Trend (OAT) Field Data Sheet VIGOR 10 points
Desirable grasses, forbs and shrubs are vigorous, showing good health Desirable grasses, forbs and shrubs have moderate vigor
6 points Desirable grasses, forbs and shrubs have low vigor 2 points SEEDLINGS invader or 10 points plant 6 points or 2 points SURFACE LITTER 5 points
There is seedling establishment of desirable grasses, forbs and shrubs. Few seedlings of undesirable plants are present. Some seedlings of desirable grasses are present; some seedlings of invader or undesirable species may be present. Few if any seedlings off desirable grasses, forbs and shrubs are present; seedlings of invader undesirable plants are present in open spaces between plants. Surface litter is accumulating in place. Moderate movement of surface litter is apparent and deposited against obstacles.
3 points Very little surface litter is remaining. 2 points PEDESTALS 5 points
There is little evidence of pedestalling. Moderate plant pedestalling
3 points Most rocks and plants are pedestalled. 1 point GULLIES plants 5 points
Gullies may be present in stable condition with moderate sloping or rounded sides. Perennial should be establishing themselves on bottom and side of channel. Gullies are well developed with small amounts of active erosion. Some vegetation may be
present. 3
INVENTORY AND MONITORING Technical Reference 1734–7 • Ecological Site Inventory
135
Sheehy, D., M. Hale, D. Damiran, T. Sheehy, D. Tsogoo, and Sh. Batsukh. 2012. Monitoring change on Mongolian rangelands. Final report for Netherlands-Mongolia Environmental Trust Fund for Environmental Reform (NEMO). 156 pp. 3 points Sharply incised V-shaped gullies cover most of the area with most actively eroding and mostly devoid of perennial plants.
1 point TOTAL POINTS
RATING: 26-35 UPWARD______ 17-25 STABLE ______ 16> DOWNWARD______
Table 2. Soil Surface Factors Field Data Sheet Soil movement
No visual evidence.
Some movement
Moderate movement; slight terracing < 1 inch
4 5 Slight movement
Surface rock
0 1 2 3 Accumulating in place 0 1 2 3 No visual effect
6 7 8 Moderate movement deposited against obstacles. 7 8 Poorly developed distribution
Pedestalling
0 1 2 No pedestalling
Flow patterns
0 1 2 3 No flow patterns
Rills
0 1 No rills
Surface litter
Gullies
2
3
0 1 2 3 May be present in stable condition 0
1
2
3
4 5 6 Truncated appearance or spotty distribution 3 4 5 Slight pedestalling
4 5 6 Some deposition of material 4 5 6 Some rills, infrequent, intervals over 10ft. 4 5 6 Few gullies with little bed or slope erosion 4 5 6
Occurs with each event; soil and debris deposited against minor obstructions. 9 10 11 Extreme movement; large deposits against obstacles 9 10 11 Exhibit accumulation behind obstacles
Subsoil exposed over much of area. 12 13 14 Very little remaining
6 7 8 Small rock and plant pedestals occurring in flow patterns
9 10 11 Pedestals evident, plant roots exposed.
12 13 14 Dissected by rills and gullies, or washed away 12 13 14 Most pedestalled with exposed roots
7 8 9 Well defined, small and few with intermittent deposits 7 8 9 Rills ½ to 6in. deep at 10ft. intervals
10 11 Flow patterns contain silt and sand and alluvial fans 10 11 12 Rills ½ to 6in. deep at 5 to 10ft. intervals
12 13 14 Flow patterns are numerous 13 14 15 Rills 3 to 6in. deep, less than 5ft. interval
7 8 9 Gullies well developed; active erosion along 50% 10 11 12
13 14 Sharply incised gullies cover area; over 50% are actively eroding 13 14 15
7
8
9
TOTAL
STABLE 0-20
SLIGHT 21-40
MODERATE 41-60
CRITICAL 61-80
SEVERE 81-1
DORNOGOBI PHYGROW SITES GROUND COVER ATTRIBUTES AND RANGELAND HEALTH ASSESSMENT DO-0001 STIPA SEMI-DESERT STEPPE GRAVELLY LOAM 10-15 PZ, 1170 m elev. 26 Petrophytic forbs-Artemisia-bunchgrass (Agropyron, Stipa) steppes on the light chestnut and mountain chestnut soils Ground Cover Attributes (%) Lichen Moss Litter Plant Basal Cover Stones Cobbles Gravel Bare Ground T T 2 6 3 20 20 49 Soil Surface Factors and Observed Apparent Trend 136
Sheehy, D., M. Hale, D. Damiran, T. Sheehy, D. Tsogoo, and Sh. Batsukh. 2012. Monitoring change on Mongolian rangelands. Final report for Netherlands-Mongolia Environmental Trust Fund for Environmental Reform (NEMO). 156 pp.
Soil Surface Factors 22- slight
Observed Apparent Trend 19 - stable
ECOLOGICAL STATUS – MID (FAIR)
137
Sheehy, D., M. Hale, D. Damiran, T. Sheehy, D. Tsogoo, and Sh. Batsukh. 2012. Monitoring change on Mongolian rangelands. Final report for Netherlands-Mongolia Environmental Trust Fund for Environmental Reform (NEMO). 156 pp.
DO-0002 NORTH DESERT QUARTZITE STONE RIDGE 10-15 cm PZ, 1098 m elev. 32 Halophytic bunchgrass (Stipa gobica, S. glareousa) with perennial saltworts, Salsola passerina with Stipa and Allium; Reaumuria songarica with Stipa and Allium communities on solonetz brown soils and their complexes with solonetzes Ground Cover Attributes (%) Lichen Moss Litter Plant Basal Cover Stones Cobbles Gravel Bare Ground T T 1 4 5 15 25 45 Soil Surface Factors and Observed Apparent Trend Soil Surface Factors Observed Apparent Trend 51- moderate 18 - stable ECOLOGICAL STATUS – MID (FAIR) DO-0003 MIDDLE DESERT (DESERT STEPPE) GRAVELLY SAND 10-13 cm PZ, 1300 m elev. Complex with elm (Ulmus japonica) groves in floodplain 30 Petrophytic bunchgrass (Stipa gobica, S. glareousa) with Ajania, Salsola laricifolia, Ceratoides papposa, Caragana on brown soils, locally in combination with perennial saltworts on solonetz brown soils with elm groves in swales Ground Cover Attributes (%) Lichen Moss Litter Plant Basal Cover Stones Cobbles Gravel Bare Ground T 2 2 3 15 20 33 25 Soil Surface Factors and Observed Apparent Trend Soil Surface Factors Observed Apparent Trend 38- slight 19 - stable ECOLOGICAL STATUS – MID (FAIR-GOOD) DO-0004 SOUTH DESERT (A) TERRACE/PAVEMENT/DUNES (B) SODIC FLOODPLAIN (C) WET MEADOW COMPLEX 7-12 cm PZ, 981 m elev. (A) 40 Halophytic, Reamuria, Salsola passerina, Anabasis brevifolia, Brachanthemum deserts on grey-brown solonetz soils and solonchak soils Ground Cover Attributes (%) Lichen Moss Litter Plant Basal Cover Stones Cobbles Gravel Bare Ground 1 T 3 6 1 1 40 48 Soil Surface Factors and Observed Apparent Trend Soil Surface Factors Observed Apparent Trend 138
Sheehy, D., M. Hale, D. Damiran, T. Sheehy, D. Tsogoo, and Sh. Batsukh. 2012. Monitoring change on Mongolian rangelands. Final report for Netherlands-Mongolia Environmental Trust Fund for Environmental Reform (NEMO). 156 pp.
21 - slight ECOLOGICAL STATUS – MID (FAIR)
25 - stable
(B) 64 Haloxylon (Reaumuria, Nitraria) with shrubs, sometimes in combination with Tamarix tugals and psammophytic communities on primitive sair soils Ground Cover Attributes (%) Lichen Moss Litter Plant Basal Cover Stones Cobbles Gravel Bare Ground T T 1 2 T 2 30 65 Soil Surface Factors and Observed Apparent Trend Soil Surface Factors Observed Apparent Trend 61 – critical 17 – stable/downward ECOLOGICAL STATUS – EARLY (POOR) (C) 61 Phragmites, Eleocharis-Phragmites communities on meadow-swampy soils in combination with: a) Blysmus-Carex communites on saline swampy clay-mucky gley soils and forb-Puccinella communities with Achnatherum on saline meadow soils; b) Eleocharis-Juncus communities on swampy peaty soils, Leymus communities with Limonium and Achnatherum, locally with shrubs( Tamarix, Caragana) on saline meadow soils; c) Phragmites, Carex-Phragmites communities, locally on peaty gley soils Ground Cover Attributes (%) Lichen Moss Litter Plant Basal Cover Stones Cobbles Gravel Bare Ground T T 10 60 15 T T 30 Soil Surface Factors and Observed Apparent Trend Soil Surface Factors Observed Apparent Trend 19- stable risk 26 - upward ECOLOGICAL STATUS – LATE (GOOD) DO-0015 SOUTH DESERT SANDY LOAM SAUXAL PLAINS 6-13 cm PZ, 849 m elev. 39 Psammophytic Psammochloa, Artemisia, Caragana, Potaninia, Zygophyllum deserts, high Haloxylon stands on grey-brown, locally gypsic, sandy, weakly differentiated soils and sands Ground Cover Attributes (%) Lichen Moss Litter Plant Basal Cover Stones Cobbles Gravel Bare Ground T T 1 4 T 2 20 62 Soil Surface Factors and Observed Apparent Trend Soil Surface Factors Observed Apparent Trend 39- slight 21 - stable 139
Sheehy, D., M. Hale, D. Damiran, T. Sheehy, D. Tsogoo, and Sh. Batsukh. 2012. Monitoring change on Mongolian rangelands. Final report for Netherlands-Mongolia Environmental Trust Fund for Environmental Reform (NEMO). 156 pp.
ECOLOGICAL STATUS – EARLY (POOR) DO-0016 DESERT DRY STEPPE LOAMY SAND 6-10 cm PZ, 1108 m elev. 33 Anabasis brevifolia with Stipa gobica, S.glareosa, Alliu; Nanophyton erinaceum with Stipa, Artemisia, Ajania with Stipa deserts on pale-brown locally weakly solonetz soils Ground Cover Attributes (%) Lichen Moss Litter Plant Basal Cover Stones Cobbles Gravel Bare Ground T 1 7 4 2 4 30 42 Soil Surface Factors and Observed Apparent Trend Soil Surface Factors Observed Apparent Trend 28 – slight 27 - upward ECOLOGICAL STATUS – MID (FAIR-GOOD) DO-0023 SEMI-DESERT STEPPE STONY RIDGE 10-15cm PZ, 998m elev. 27 Psammophytic and hemipsammophitic bunchgrass (Agropyron, Stipa glareosa and gobica, Cleistogenes) steppes with shrubs on light chestnut sandy loamy and sandy soils Ground Cover Attributes (%) Lichen Moss Litter Plant Basal Cover Stones Cobbles Gravel Bare Ground 1 3 1 7 15 20 10 43 Soil Surface Factors and Observed Apparent Trend Soil Surface Factors Observed Apparent Trend 42 – moderate 20 - stable ECOLOGICAL STATUS – MID (FAIR-GOOD) DO-0028 SEMI-DESERT STEPPE SANDY LOAM HILLS 10-16 cm PZ, 1130 m elev. 26 Petrophytic forbs-Artemisia-bunchgrass (Agropyron, Stipa) steppes on the light chestnut and mountain chestnut soils Ground Cover Attributes (%) Lichen Moss Litter Plant Basal Cover Stones Cobbles Gravel Bare Ground T 1 2 5 1 5 30 56 Soil Surface Factors and Observed Apparent Trend Soil Surface Factors Observed Apparent Trend 25 – slight 25 - stable ECOLOGICAL STATUS – MID (FAIR-GOOD) 140
Sheehy, D., M. Hale, D. Damiran, T. Sheehy, D. Tsogoo, and Sh. Batsukh. 2012. Monitoring change on Mongolian rangelands. Final report for Netherlands-Mongolia Environmental Trust Fund for Environmental Reform (NEMO). 156 pp.
141
Sheehy, D., M. Hale, D. Damiran, T. Sheehy, D. Tsogoo, and Sh. Batsukh. 2012. Monitoring change on Mongolian rangelands. Final report for Netherlands-Mongolia Environmental Trust Fund for Environmental Reform (NEMO). 156 pp.
DO-0029 NORTH DESERT LOAMY SAND DUNES 10-15 cm PZ, 1083 m elev. 26 Psammophytic bunchgrass (Stipa gobica, S.glareosa) with Caragana, Ceratoides papposa, and Stipa-Cleistogenes communities on brown loose-sandy soils and sands Ground Cover Attributes (%) Lichen Moss Litter Plant Basal Cover Stones Cobbles Gravel Bare Ground T T 2 5 1 10 45 37 Soil Surface Factors and Observed Apparent Trend Soil Surface Factors Observed Apparent Trend 27 – slight 28 - upward ECOLOGICAL STATUS – MID (FAIR-GOOD)
DUNDGOBI PHYGROW SITES GROUND COVER ATTRIBUTES AND RANGELAND HEALTH ASSESSMENT DG-0001 NORTH DESERT NORTH SLOPING PLAINS 10-15cm PZ, 1097m elev. 31 Psammophytic bunchgrass(Stipa gobica, S. glareosa) with Caragana, Ceratoides papposa, and Stipa-Cleistogenes communities on brown loose-sandy soils and sands Ground Cover Attributes (%) Lichen Moss Litter Plant Basal Cover Stones Cobbles Gravel Bare Ground T T 2 7 T 4 50 37 Soil Surface Factors and Observed Apparent Trend Soil Surface Factors Observed Apparent Trend 31 – slight 27 - upward ECOLOGICAL STATUS – LATE (GOOD) DG-0006 NORTH DESERT NORTH SLOPING PLAINS 10-15 cm PZ, 1362 m elev. 30 Petrophytic bunchgrass (Stipa gobica, S. glareousa) with Ajania, Salsola Iaricifolia, Ceratoides papposa, Caragana on brown soils, locally in combination with perennial saltworts on solonetz brown soils Ground Cover Attributes (%) Lichen Moss Litter Plant Basal Cover Stones Cobbles Gravel Bare Ground T T 1 6 2 10 20 39 Soil Surface Factors and Observed Apparent Trend Soil Surface Factors Observed Apparent Trend 142
Sheehy, D., M. Hale, D. Damiran, T. Sheehy, D. Tsogoo, and Sh. Batsukh. 2012. Monitoring change on Mongolian rangelands. Final report for Netherlands-Mongolia Environmental Trust Fund for Environmental Reform (NEMO). 156 pp.
27 – slight 25 - stable ECOLOGICAL STATUS – MID (FAIR-GOOD) DG-0007 DRY STEPPE SANDY LOAM 10-20 cm PZ, 1274 m elev. 22 Bunchgrass and rhizomatous grass (Agropyron, Cleistogenes, Stipa, Leymus) steppes on chestnut soils and locally in complex with hemihalophytic communities on solonetz chestnut soils Ground Cover Attributes (%) Lichen Moss Litter Plant Basal Cover Stones Cobbles Gravel Bare Ground T T 5 10 T 1 15 69 Soil Surface Factors and Observed Apparent Trend Soil Surface Factors Observed Apparent Trend 32 – slight 25 - stable ECOLOGICAL STATUS – MID (FAIR-GOOD) DG-0034 MIDDLE DESERT CLAY LOAM 8-12 cm PZ, 1081 m elev. 33 Anabasis brevifolia with Stipa gobica, S.glareosa, Allium, Nanophyton erinaceum with Artemisia, Ajania deserts on pale-brown locally weakly solonetz soils Ground Cover Attributes (%) Lichen Moss Litter Plant Basal Cover Stones Cobbles Gravel Bare Ground T 2 2 7 T 4 37 48 Soil Surface Factors and Observed Apparent Trend Soil Surface Factors Observed Apparent Trend 26 – slight 27 - upward ECOLOGICAL STATUS – MID (FAIR-GOOD) DG-0035 STIPA SEMI-DESERT STEPPE GRAVELLY LOAM 10-15 PZ, 1367 m elev. 26 Petrophytic forbs-Artemisia-bunchgrass (Agropyron, Stipa) steppes on the light chestnut and mountain chestnut soils Ground Cover Attributes (%) Lichen Moss Litter Plant Basal Cover Stones Cobbles Gravel Bare Ground T T 1 5 4 25 15 50 Soil Surface Factors and Observed Apparent Trend Soil Surface Factors Observed Apparent Trend 32 – slight 20 - stable 143
Sheehy, D., M. Hale, D. Damiran, T. Sheehy, D. Tsogoo, and Sh. Batsukh. 2012. Monitoring change on Mongolian rangelands. Final report for Netherlands-Mongolia Environmental Trust Fund for Environmental Reform (NEMO). 156 pp.
ECOLOGICAL STATUS – MID (FAIR) DG-0036 DRY STEPPE LOAMY TERRACE 10-20 cm PZ, 1277 m elev. 22 Bunchgrass and rhizomatous grass (Agropyron, Cleistogenes, Stipa, Leymus) steppes on chestnut soils and locally in complex with hemihalophytic communities on solonetz chestnut soils Ground Cover Attributes (%) Lichen Moss Litter Plant Basal Cover Stones Cobbles Gravel Bare Ground T T T 10 T T 60 30 Soil Surface Factors and Observed Apparent Trend Soil Surface Factors Observed Apparent Trend 21 – slight 24 - stable ECOLOGICAL STATUS – LATE (GOOD) DG-0038 DRY BASIN GRAVELLY LOAM 10-20 cm PZ, 1239 m elev. 26 Petrophytic forbs-Artemisia-bunchgrass (Agropyron, Stipa) steppes on the light chestnut and mountain chestnut soils Ground Cover Attributes (%) Lichen Moss Litter Plant Basal Cover Stones Cobbles Gravel Bare Ground T 2 3 8 1 8 38 40 Soil Surface Factors and Observed Apparent Trend Soil Surface Factors Observed Apparent Trend 27 – slight 26 - upward ECOLOGICAL STATUS – MID (FAIR-GOOD)
OMNIGOBI PHYGROW SITES GROUND COVER ATTRIBUTES AND RANGELAND HEALTH ASSESSMENT UG-0037 MIDDLE DESERT OUTWASH PLAIN 8-12 cm PZ, 1120 m elev. 33 Anabasis brevifolia with Stipa gobica, S.glareosa, Allium, Nanophyton erinaceum with Artemisia, Ajania deserts on pale-brown locally weakly solonetz soils Ground Cover Attributes (%) Lichen Moss Litter Plant Basal Cover Stones Cobbles Gravel Bare Ground T T 2 6 2 7 35 49 144
Sheehy, D., M. Hale, D. Damiran, T. Sheehy, D. Tsogoo, and Sh. Batsukh. 2012. Monitoring change on Mongolian rangelands. Final report for Netherlands-Mongolia Environmental Trust Fund for Environmental Reform (NEMO). 156 pp.
Soil Surface Factors and Observed Apparent Trend Soil Surface Factors Observed Apparent Trend 29 – slight 25 - upward ECOLOGICAL STATUS – MID (FAIR) UG-0038 MIDDLE DESERT DUNES 8-12 cm PZ, 1232 m elev. 33 Anabasis brevifolia with Stipa gobica, S.glareosa, Allium, Nanophyton erinaceum with Artemisia, Ajania deserts on pale-brown locally weakly solonetz soils Or (with presence of Ceratoides) 35 Psammophytic Artemisia with grasses, Ceratoides papposa, Caragana, Potaninia deserts on pale-brown sandy soils Ground Cover Attributes (%) Lichen Moss Litter Plant Basal Cover Stones Cobbles Gravel Bare Ground T T 3 4 T 5 10 77
Soil Surface Factors and Observed Apparent Trend Soil Surface Factors Observed Apparent Trend 28 – slight 23 - stable ECOLOGICAL STATUS – EARLY (POOR) UG-0039 MIDDLE DESERT PLATEAU 8-12 cm PZ, 1396 m elev. 35 Psammophytic Artemisia with grasses, Ceratoides papposa, Caragana, Potaninia deserts on pale-brown sandy soils (no presence of Ceratoides) Ground Cover Attributes (%) Lichen Moss Litter Plant Basal Cover Stones Cobbles Gravel Bare Ground T T 5 4 T 1 30 60
Soil Surface Factors and Observed Apparent Trend Soil Surface Factors Observed Apparent Trend 45 – moderate 21 - stable ECOLOGICAL STATUS – MID (FAIR) UG-0040 MIDDLE DESERT LOAMY SAND BASIN 8-12 cm PZ, 976 m elev. 35 Psammophytic Artemisia with grasses, Ceratoides papposa, Caragana, Potaninia deserts on pale-brown sandy soils 145
Sheehy, D., M. Hale, D. Damiran, T. Sheehy, D. Tsogoo, and Sh. Batsukh. 2012. Monitoring change on Mongolian rangelands. Final report for Netherlands-Mongolia Environmental Trust Fund for Environmental Reform (NEMO). 156 pp.
Ground Cover Attributes (%) Lichen Moss Litter Plant Basal Cover Stones Cobbles Gravel Bare Ground T 4 3 6 1 5 30 52 Soil Surface Factors and Observed Apparent Trend Soil Surface Factors Observed Apparent Trend 42 – moderate 20 - stable ECOLOGICAL STATUS – MID (FAIR) UG-0044 SEMI-DESERT LOAMY SAND 8-12 cm PZ, 1116 m elev. 31 Psammophytic bunchgrass (Stipa gobica, S. glareosa) with Caragana, Ceratoides papposa, and Stipa-Cleistogenes communities on brown loose-sandy soils and sands Ground Cover Attributes (%) Lichen Moss Litter Plant Basal Cover Stones Cobbles Gravel Bare Ground T T 3 7 1 7 50 32 Soil Surface Factors and Observed Apparent Trend Soil Surface Factors Observed Apparent Trend 26 – slight 25 - stable ECOLOGICAL STATUS – MID (FAIR-GOOD) UG-0045 MIDDLE DESERT PLAINS 8-12 cm PZ, 1115 m elev. 34 Petrophytic Anabasis brevifolia, Sympegma, Ajania, Salsola laricifolia with Stipa glareosa deserts on pale-brown soils Ground Cover Attributes (%) Lichen Moss Litter Plant Basal Cover Stones Cobbles Gravel Bare Ground T 1 3 4 T 1 50 41 Soil Surface Factors and Observed Apparent Trend Soil Surface Factors Observed Apparent Trend 27 – slight 28 - upward ECOLOGICAL STATUS – MID (FAIR) UG-0046 SOUTH DESERT LOAM 6-12 cm PZ, 884 m elev. 38 Petrophytic Anabasis, Salsola laricifolia, Sympegma, Amygdalus, perennial saltwort deserts on grey-brown skeleton and grey brown raw soils 146
Sheehy, D., M. Hale, D. Damiran, T. Sheehy, D. Tsogoo, and Sh. Batsukh. 2012. Monitoring change on Mongolian rangelands. Final report for Netherlands-Mongolia Environmental Trust Fund for Environmental Reform (NEMO). 156 pp.
(Better fit) 41 Gypsum-halophytic Nitraria, Haloxylon with Nitraria on perennial saltworts deserts on grey-brown solonchak strongly gypsic soils Ground Cover Attributes (%) Lichen Moss Litter Plant Basal Cover Stones Cobbles Gravel Bare Ground T T 2 2 1 10 60 25 Soil Surface Factors and Observed Apparent Trend Soil Surface Factors Observed Apparent Trend 42 – moderate 15 - downward ECOLOGICAL STATUS – EARLY (POOR) UG-0047 39 SOUTH DESERT SANDY LOAM DUNES 6-12 cm PZ, 854 m elev. Psammophytic Psammochloa, Artemisia, Caragana, Potaninia, Zygophyllum deserts, high Haloxylon stands on grey-brown, locally gypsic, sandy, weakly differentiated soils and sands Ground Cover Attributes (%) Lichen Moss Litter Plant Basal Cover Stones Cobbles Gravel Bare Ground T T 3 3 T 5 35 54 Soil Surface Factors and Observed Apparent Trend Soil Surface Factors Observed Apparent Trend 44 – moderate 21 - stable ECOLOGICAL STATUS – MID (FAIR)
147
Sheehy, D., M. Hale, D. Damiran, T. Sheehy, D. Tsogoo, and Sh. Batsukh. 2012. Monitoring change on Mongolian rangelands. Final report for Netherlands-Mongolia Environmental Trust Fund for Environmental Reform (NEMO). 156 pp.
ECOLOGICAL STATUS – MID (FAIR) OYU TOLGOI MINE INVENTORY GROUND COVER ATTRIBUTES AND RANGELAND HEALTH ASSESSMENT
Symbol Key: OT = Oyu Tolgoi area, R = road side adjacent sites, W = waterline development and aquifer sites, M = “old” mountain sites OT-O1R SOUTH DESERT SYMPEGMA PENAPLAIN 6-12 cm PZ, 1014 m elev. 40 Halophytic, Reamuria, Salsola passerina, Anabasis brevifolia, Brachanthemum deserts on grey-brown solonetz soils and solonchak soils Ground Cover Attributes (%) Lichen Moss Litter Plant Basal Cover Stones Cobbles Gravel Bare Ground T 1 5 4 T 3 20 67 Soil Surface Factors and Observed Apparent Trend Soil Surface Factors Observed Apparent Trend 42 – moderate 14 - downward ECOLOGICAL STATUS – EARLY (POOR-FAIR) OT-02R SOUTH DESERT SYMPEGMA PENAPLAIN 6-12 cm PZ, 991 m elev. 40 Halophytic, Reamuria, Salsola passerina, Anabasis brevifolia, Brachanthemum deserts on grey-brown solonetz soils and solonchak soils Ground Cover Attributes (%) Lichen Moss Litter Plant Basal Cover Stones Cobbles Gravel Bare Ground T 1 10 4 T 1 30 54 Soil Surface Factors and Observed Apparent Trend Soil Surface Factors Observed Apparent Trend 48 – moderate 12 - downward ECOLOGICAL STATUS – EARLY (POOR) OT-03R SOUTH DESERT LOAMY SAND (ANABASIS) 6-12 cm PZ, 945 m elev. 37 Anabasis, Nanophyton, Sympegma, Ephedra, low Haloxylon stands on grey-brown desert, locally solonetz soils, often in combination with Sympegma-Potaninia or Artemisia terrae-abbae-Ceratoides papposa communities on sands Ground Cover Attributes (%) Lichen Moss Litter Plant Basal Cover Stones Cobbles Gravel Bare Ground 148
Sheehy, D., M. Hale, D. Damiran, T. Sheehy, D. Tsogoo, and Sh. Batsukh. 2012. Monitoring change on Mongolian rangelands. Final report for Netherlands-Mongolia Environmental Trust Fund for Environmental Reform (NEMO). 156 pp.
1
T
3
2
T
1
45
48
Soil Surface Factors and Observed Apparent Trend Soil Surface Factors Observed Apparent Trend 40 – slight 19 - stable ECOLOGICAL STATUS – MID (POOR-FAIR) OT-04R SOUTH DESERT LOAM 6-12 cm PZ, 986 m elev. 34 Petrophytic Anabasis brevifolia, Sympegma, Ajania, Salsola laricifolia with Stipa glareosa deserts on pale-brown soils Ground Cover Attributes (%) Lichen Moss Litter Plant Basal Cover Stones Cobbles Gravel Bare Ground T T 6 6 T 1 20 67 Soil Surface Factors and Observed Apparent Trend Soil Surface Factors Observed Apparent Trend 40 - slight 22 - stable ECOLOGICAL STATUS – MID (FAIR) OT-05R SOUTH DESERT CLAY LOAM 6-12 cm PZ, 1023 m elev. 34 Petrophytic Anabasis brevifolia, Sympegma, Ajania, Salsola laricifolia with Stipa glareosa deserts on pale-brown soils Ground Cover Attributes (%) Lichen Moss Litter Plant Basal Cover Stones Cobbles Gravel Bare Ground T T 5 6 T 1 30 58 Soil Surface Factors and Observed Apparent Trend Soil Surface Factors Observed Apparent Trend 29 - slight 19 - stable ECOLOGICAL STATUS – MID (FAIR) OT-06R MIDDLE DESERT LOAM 6-12 cm PZ, 1086 m elev. (BLUE GRAVEL) 34 Petrophytic Anabasis brevifolia, Sympegma, Ajania, Salsola laricifolia with Stipa glareosa deserts on pale-brown soils Ground Cover Attributes (%) Lichen Moss Litter Plant Basal Cover Stones Cobbles Gravel Bare Ground T T 2 4 5 15 35 39 149
Sheehy, D., M. Hale, D. Damiran, T. Sheehy, D. Tsogoo, and Sh. Batsukh. 2012. Monitoring change on Mongolian rangelands. Final report for Netherlands-Mongolia Environmental Trust Fund for Environmental Reform (NEMO). 156 pp.
Soil Surface Factors and Observed Apparent Trend Soil Surface Factors Observed Apparent Trend 35 - slight 20 - stable ECOLOGICAL STATUS – EARLY (POOR) OT-O7M MIDDLE DESERT SANDY LOAM 6-12 cm PZ, 1136 m elev. (BLUE GRAVEL) 34 Petrophytic Anabasis brevifolia, Sympegma, Ajania, Salsola laricifolia with Stipa glareosa deserts on pale-brown soils (Better fit for sand-silt-loam & trace of Ceratoides) 35 Psammophytic Artemisia with grasses, Ceratoides papposa, Caragana, Potaninia deserts on pale-brown sandy soils Ground Cover Attributes (%) Lichen Moss Litter Plant Basal Cover Stones Cobbles Gravel Bare Ground T 1 3 7 10 20 25 34 Soil Surface Factors and Observed Apparent Trend Soil Surface Factors Observed Apparent Trend 35 - slight 20 - stable ECOLOGICAL STATUS – MID (FAIR-GOOD) OT-08R MIDDLE DESERT 6-12 cm PZ, 1143 m elev. complex with loamy bottoms Elm groves 34 Petrophytic Anabasis brevifolia, Sympegma, Ajania, Salsola laricifolia with Stipa glareosa deserts on pale-brown soils Ground Cover Attributes (%) Lichen Moss Litter Plant Basal Cover Stones Cobbles Gravel Bare Ground T T 2 4 T 15 30 41 Soil Surface Factors and Observed Apparent Trend Soil Surface Factors Observed Apparent Trend 30 - slight 25 - stable ECOLOGICAL STATUS – MID (FAIR) OT-09W MIDDLE DESERT CLAY LOAM 6-12 cm PZ, 1183 m elev. (3% Ceratoides present) 150
Sheehy, D., M. Hale, D. Damiran, T. Sheehy, D. Tsogoo, and Sh. Batsukh. 2012. Monitoring change on Mongolian rangelands. Final report for Netherlands-Mongolia Environmental Trust Fund for Environmental Reform (NEMO). 156 pp.
36 Halophytic perennial saltworts with Stipa glareosa in combination with Kaldium deserts on solonchaks and Haloxylon stands on pale solonetz-solonchak Ground Cover Attributes (%) Lichen Moss Litter Plant Basal Cover Stones Cobbles Gravel Bare Ground T T 6 4 T 1 30 58 Soil Surface Factors and Observed Apparent Trend Soil Surface Factors Observed Apparent Trend 40 - slight 16 - stable ECOLOGICAL STATUS – MID (FAIR) OT-10W MIDDLE DESERT (REAMURIA/SALSOLA ASSOCIATION) 6-12 cm PZ, 1125 m elev. 33 Anabasis brevifolia with Stipa gobica, S.glareosa, Allium, Nanophyton erinaceum with Artemisia, Ajania deserts on pale-brown locally weakly solonetz soils SOUTH DESERT 40 Halophytic, Reamuria, Salsola passerina, Anabasis brevifolia, Brachanthemum deserts on grey-brown solonetz soils and solonchak soils Ground Cover Attributes (%) Lichen Moss Litter Plant Basal Cover Stones Cobbles Gravel Bare Ground T T 5 6 2 10 25 52 Soil Surface Factors and Observed Apparent Trend Soil Surface Factors Observed Apparent Trend 32 - slight 16 - downward ECOLOGICAL STATUS – EARLY (POOR) OT-11W MIDDLE DESERT SANDY 6-12 cm PZ, 1082 m elev. 35 Psammophytic Artemisia with grasses, Ceratoides papposa, Caragana, Potaninia deserts on pale-brown sandy soils Ground Cover Attributes (%) Lichen Moss Litter Plant Basal Cover Stones Cobbles Gravel Bare Ground T T 6 8 T T 8 78 Soil Surface Factors and Observed Apparent Trend Soil Surface Factors Observed Apparent Trend 35 - slight 18 - stable 151
Sheehy, D., M. Hale, D. Damiran, T. Sheehy, D. Tsogoo, and Sh. Batsukh. 2012. Monitoring change on Mongolian rangelands. Final report for Netherlands-Mongolia Environmental Trust Fund for Environmental Reform (NEMO). 156 pp.
ECOLOGICAL STATUS – MID (FAIR)
152
Sheehy, D., M. Hale, D. Damiran, T. Sheehy, D. Tsogoo, and Sh. Batsukh. 2012. Monitoring change on Mongolian rangelands. Final report for Netherlands-Mongolia Environmental Trust Fund for Environmental Reform (NEMO). 156 pp.
OT-12W MIDDLE DESERT 5-10 cm PZ, 981 m elev. 36 Halophytic perennial saltworts with Stipa glareosa in combination with Kaldium deserts on solonchaks and Haloxylon stands on pale solonetz-solonchak SOUTH DESERT SAUXAL DUNES 5-10 cm PZ, 981 m elev. 41 Gypsum-halophytic Nitraria, Haloxylon with Nitraria on perennial saltworts deserts on grey-brown solonchak strongly gypsic soils Ground Cover Attributes (%) Lichen Moss Litter Plant Basal Cover Stones Cobbles Gravel Bare Ground T T 3 7 T 1 20 69 Soil Surface Factors and Observed Apparent Trend Soil Surface Factors Observed Apparent Trend 33 - slight 21 - stable ECOLOGICAL STATUS – MID (FAIR) OT-13W SOUTH DESERT 5-10 cm PZ, 1056 m elev. 39 Psammophytic Psammochloa, Artemisia, Caragana, Potaninia, Zygophyllum deserts, high Haloxylon stands on grey-brown, locally gypsic, sandy, weakly differentiated soils and sands Ground Cover Attributes (%) Lichen Moss Litter Plant Basal Cover Stones Cobbles Gravel Bare Ground T T 4 6 1 10 20 59 Soil Surface Factors and Observed Apparent Trend Soil Surface Factors Observed Apparent Trend 37 - slight 22 - stable ECOLOGICAL STATUS – MID (FAIR)
Annex 9. Short-Term Grazing Utilization Monitoring Methods Landscape Appearance-Key Forage Plant Utilization
153
Sheehy, D., M. Hale, D. Damiran, T. Sheehy, D. Tsogoo, and Sh. Batsukh. 2012. Monitoring change on Mongolian rangelands. Final report for Netherlands-Mongolia Environmental Trust Fund for Environmental Reform (NEMO). 156 pp.
Measuring Grazing Utilization Impacts on Key Forage Plants (Form 7). 1/ 2/ Season of Use: Winter Spring Summer Fall Date: 3/ 4/ Soil Moisture or Plant Growth: Low Average High Key Sp: 5/
Use Class (15) None 015% Light 1635% Moderate 36-65% Heavy 66-80% Severe 81-100%
Midpoint (a)
5/
Tally (checks or marks)
6/
Grazed Plants (b)
6/
(c)
(d)
Current Use (b) * (a)
8 25 50 73 90
Totals >>> Percent species utilization (d)/(c) >>>
(1) Check or circle the season of use during which the pasture is grazed by PUG livestock. (2) Enter the date that the estimate was conducted. (3) Check or circle the amount of soil moisture or plant growth apparent during the grazing season. (4) Enter the key forage plant species to be evaluated. Key forage species are individual or groups of plants that represent a healthy pastureland or pasture condition. Begin a “step transect” by walking in one direction from the metal post, rod or GPS point. Take two steps; at the second step, stop, and estimate which use class is apparent for the key species nearest your foot. (5) Enter a check or hash mark in the “tally” blank on the form in the row that represents the “use class” of the key forage plant. Box 1. Key Forage Plant Utilization Box Degree of use refers to the amount of annual, above-ground forage removed from the plant by grazing animals. Degrees of use for grazed plants and meaning relative to grazing impacts are: i) None: 0-15% degree of use which indicates very little or no use of key forage plants because only preferred areas and plants are grazed. ii) Light: 16-35% degree of use which indicates key forage plants are lightly to moderately used, with practically no use of lower value forage plants. 154
Sheehy, D., M. Hale, D. Damiran, T. Sheehy, D. Tsogoo, and Sh. Batsukh. 2012. Monitoring change on Mongolian rangelands. Final report for Netherlands-Mongolia Environmental Trust Fund for Environmental Reform (NEMO). 156 pp.
iii) Moderate: 36-65% degree of use which indicates key forage plants are used about right for the season of grazing and the ecological sites involved. Some use of low value forage plants is evident. iv) Heavy: 66-80% degree of use with key forage plants closely cropped. Low value forage plants are generally being grazed. v) Severe: 80-100% degree of use indicated by key forage plants grubbed and weakened from continuous grazing of plant regrowth. Low value forage plants are providing most of the grazing load and are closely cropped. Continue walking and entering the “use class” of each key species at each second step until at least 100 points have been classified. Unless utilization is extremely even, several rows of the form will have checks or marks. (6) When the step transect is completed, calculate utilization by adding the checks or marks for each Use Class and enter the result in the Grazed Plant column. (7) Multiply the Midpoint number (a) by the Grazed Plant number (b) and enter in the Current Use column. Total both the Grazed Plants (6) and Current Use (7) columns and enter the results in the blocks marked (c) and (d). The estimated utilization of the Key Species is obtained by dividing the number in (d) by the number in (c). Enter this number in the lower right block in the form. Box 2. Degrees of use for the Resource Response Unit and meaning relative to grazing impacts. i) 0-5% The response unit shows little evidence of grazing use. Only preferred areas and plants are grazed. ii) 6-20% The Response Unit has the appearance of very light grazing. The herbaceous forage plants may be topped or slightly used. Current seedstalks and young plants are little disturbed. Trailing to grazing by livestock is not evident. iii) 21-40% The response unit may be topped, skimmed, or grazed in patches. The low-value herbaceous plants are ungrazed and 60 to 80% of the number of current seedstalks of herbaceous plants remain intact. Most young plants are undamaged. iv) 41-60% The response unit appears uniformly grazed as natural features will allow. Fifteen to 25% of current years seedstalks of herbaceous plants remain intact. No more than 10 % of the number of low-value herbaceous forage plants are utilized. . v) 61- 80% The response unit has the appearance of complete utilization. Herbaceous species are almost completely utilized, with less than 10 percent of current seedstalks remaining. Greater than 10 % of the number of low-value herbaceous forage plants have been utilized. vi) 81-94%. The response unit has a mown appearance and there are indications of repeated grazing. There is no evidence of reproduction or current seedstalks of herbaceous species. Herbaceous forage species are completely utilized. The remaining stubble of preferred grasses is grazed to the soil surface. vii) 95- 100%. The response unit appears to have been completely utilized. More than 50 percent of the low-value herbaceous plants have been utilized. 155
Back cover photo:
Study team pauses to celebrate the conclusion of the field study in 2011: from left to right T. Sheehy, D. Sheehy, M. Hale, D. Damiran, D. Tsogoo, S. Chimgee, and Sh. Batsukh.