MONITORING INVERSIONS FROM GROUND-BASED REMOTE SENSING INSTRUMENTS DURING TEMPERATURE, HUMIDITY, AND CLOUD PROFILING CAMPAIGN (TUC) Tim Hewison, Catherine Gaffard, John Nash, Met Office, University of Reading, Meteorology Building 1U20, Earley Gate, Reading RG6 6BB, UK mailto:
[email protected] Tel:+44 118 3787830 Dominique Ruffieux, Reto Nater, Heinz Berger, Marjorie Perroud and Beatriz Andrade MeteoSwiss, Aerological Station, Payerne, CP.316, Switzerland ABSTRACT During winter 2003-04, several instruments were deployed at Payerne, Switzerland in support of COST Action 720, which aims to develop integrated groundbased remote-sensing stations for atmospheric profiling. In this short paper, we examine the accuracy of observations and temperature and humidity retrievals from microwave radiometers. We also investigate how cloud radar and wind profiler data could add extra information in a case study of fog formation and dissipation.
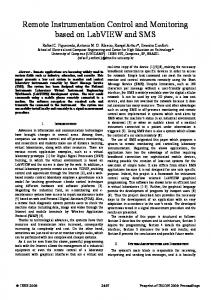
angles, down to 15° elevation. These neural networks were trained on 10 years of high-resolution radiosonde profiles from Payerne, using a radiative transfer model [2] to simulate the observations of a radiometer. Retrievals were validated by comparison with coincident radiosonde profiles, measured by SRS sensors. Figure 1 shows the results from all radiosonde flights during the first part of the experiment in all weather conditions.
1. INTRODUCTION Short-range weather forecasting of fog or stratus depends on accurate knowledge of boundary layer temperature inversions and hydrolapses. Such features develop rapidly, so they are not well represented by synoptic radiosonde profiles. Ground-based remote sensing instruments offer the potential to provide regular information on temperature and humidity profiles in real time. Retrievals from passive groundbased sounders typically have rather poor vertical resolution. This may be improved by combination with information from active instruments. During the Temperature, Humidity, and Cloud profiling campaign (TUC) of winter 2003-04, a number of sensors were operated at Payerne, Switzerland. The TUC experiment and supporting instrumentation are described in [1]. For this study, we will use data from Radiometrics MP3000 microwave radiometer. The accuracy of radiometer measurements can be assessed by comparison with forward-modelled radiosonde profiles in clear sky conditions. This radiometer was supplied with an algorithm to retrieve profiles of temperature, humidity and liquid water cloud by combining observations near the 22 GHz water vapour line and in the 50-60 GHz oxygen band with prior information from a statistical climatology. 2.
STATISTICAL ASSESSMENT OF NEURAL NETWORK RETRIEVALS Two neural networks were used to retrieve profiles of temperature, humidity and liquid water cloud from the microwave radiometer’s zenith view and a range of 7
Figure 1 - Validation of Radiometrics MP3000 retrievals against SRS sondes 5/11/03-19/1/04, Payerne These results show the uncertainty (SD) of the temperature profiles increases with height, from 0.5 K near the surface to 2.0 K at 4 km. The dashed curve in the upper panel of Figure 1 show the temperature retrieved in the lowest 1 km from the elevation scan are a little better than those retrieved from the zenith view only. This can be partly explained by the larger number of observations being used, which should reduce the uncertainty in the retrieval.
There is also a positive bias in the temperature retrievals of 1-1.5 K below 1 km, but a negative bias at higher levels. This is partly due to the limited vertical resolution of the retrievals, as there is often a sharp temperature inversion at ~1 km. The negative bias at higher levels may be caused by the retrieval ‘balancing’ the positive bias at low levels. However, it could also be introduced by the bias in the radiative transfer model used to train the neural network. This is investigated further in Section 3. The bias in the temperature retrievals above 2 km was found to be largest for cold, dry conditions, but was largely independent of the amount of cloud present. This is further evidence of a bias in the radiative transfer model in the 51-52 GHz channels, which provide most of the information used in the temperature profile at these levels. The lower panel of Figure 1 shows the bias and standard deviation of the retrieved water vapour profiles, expressed as Relative Humidity. Although, this includes the effects of errors in the temperature profile, it allows comparison with surface hygrometers. For the zenith retrievals, the uncertainty (SD) increases from 6 %RH near the surface to 16 %RH above 1 km. The humidity retrievals from the elevation scan have a much larger SD, which suggests another source of error. This may be due to the higher sensitivity of the water vapour channels to terrestrial emission. 3. THE ABILITY TO RETRIEVE INVERSIONS The statistical assessment of the retrieved profiles in Section 2 does not explicitly test the ability to retrieve inversions, which are of great interest to forecasting boundary layer phenomena. This can be assessed by comparing the properties of the temperature inversions in the retrieved profiles with those calculated from the significant levels from coincident radiosondes. The average and standard deviation of the vertical extent and temperature contrast of all inversions retrieved by 2 radiometers and measured by the radiosonde are shown in Figure 2. This shows that AMSUWARA’s algorithm tends to retrieve inversions which are too weak and too shallow, except in foggy situations where its retrievals do not match the observed range of depths. The Radiometrics zenith algorithm tends to retrieve temperature inversions with the correct amplitude, but often overestimates the depth of the inversion, as a result of limited vertical resolution. However, it is better able to retrieve the depth of surface inversions (not shown).
Figure 2 – Comparison of average (colour bars) and standard deviation (error bars) of vertical extent (upper panel) and temperature contrast (lower panel) of all temperature inversions measured by coincident SRS radiosondes (black), and retrieved by ASMUWARA (blue) and Radiometrics MP3000 at zenith (red) radiometers at Payerne 5/11/03-19/1/04 4.
COMPARISON OF OBSERVED AND MODELLED BRIGHTNESS TEMPERATURES IN CLEAR AIR
Observed brightness temperatures can be compared with modelled values in clear sky conditions to check for consistence. High-resolution radiosonde data were used as input to a radiative transfer model using MPM93 [3] and Rosenkranz’98 [2] absorption. The brightness temperature difference (model-observation) is plotted against the modelled brightness temperature in each channel in Figure 3. Figure 3 shows that the Rosenkranz’98 tends to have a small positive bias with respect to the observations for the water vapour channels in more humid situations. This is smaller than previously found using RS80 sondes [4], which are believed to be dry-biased. This model also has a significant negative bias with respect to observations at 51-52 GHz channels in cold conditions. This is consistent with the negative bias observed in retrieved temperature profiles above 2 km. 5. FOG CASE STUDY Figs. 4-8 show the time series of atmospheric profiles measured by microwave radiometer, cloud radar, wind profiler and radiosondes on 1/12/03 – with a shallow fog layer dissipating and re-forming at Payerne. Initially, the radiosonde had an isothermal profile to 1.5 km (a.g.l.), similar to the zenith and elevation scan retrievals from the Radiometrics MP3000.
Figure 3 – Comparison of Modelled and Observed zenith brightness temperatures for the 12 channels of Radiometrics MP3000. 19 SRS soundings in clear conditions during 5/11/03-19/01/04 at Payerne. × = Rosenkranz’98 [2], ∆ = MPM93 [3] As the surface continued to cool radiatively a thin layer (0-300 m) becomes saturated by 05:00, and a shallow layer of fog formed (visibility ~100 m). This deepened until it dissipates rapidly at 12:00 following the arrival of dense mid-level cloud. This produced occasional precipitation, seen by the cloud radar and wind profiler, which evaporated in the dry air above the surface inversion. The increased surface temperature, caused the fog to thin (visibility~1-3 km). After sunset ~16:00, radiative cooling reduced the surface temperature to allow fog to reform. In Figure 8, the retrievals from the Radiometrics MP3000 generally follow the temperature inversion as it lowered during the afternoon and evening. However, they lack the sufficient resolution to pick out the detailed structure which produced the wind profiler signals. They were also biased at 05:00 by putting too much weight on the surface sensor in a very shallow super-adiabatic layer. The time series of radiometer retrievals show a weak diurnal temperature cycle at the surface, associated with the fog’s formation and dissipation. They also show warming and drying above the fog top from 5001000 m – a trend also evident in the radiosonde profiles. In this case, the fog’s development was driven
by surface energy exchange, but the remote sensing observations provided valuable information on the arrival of cloud above the fog layer, which would help short-range forecasting of the fog’s thinning. 6. REFERENCES [1] D.Ruffieux, T.Hewison, C.Gaffard, R.Nater, B.Andrade, M.Perroud, P.Overney, 2004: “The COST720 Temperature, Humidity and Cloud Profiling Campaign: TUC”, Microrad’04 Proceedings. [2] P.W.Rosenkranz, 1998: "Water vapor microwave continuum absorption: A comparison of measurements and models," Radio Science, Vol.33, No.4, pp.919-928. [3] H.J.Liebe, G.A.Hufford and M.G.Cotton, "Propagation modeling of moist air and suspended water/ice particles at frequencies below 1000GHz," AGARD 52nd Specialists' Meeting of the Electromagnetic Wave Propagation Panel, Paper No. 3/1-10, Palma de Mallorca, Spain, 17-21 May 1993. [4] T.J.Hewison, C.Gaffard and J.Nash, 2003: “Validation of Microwave Radiometer Measurements in Clear Air”, ISTP Proceedings, Leipzig, Germany.
Figure 4 - Time/height series of temperature (upper), relative humidity (middle) and cloud water density (lower) retrieved from zenith view of Radiometrics MP3000 on 1/12/03
Figure 6 - Time/height series of temperature (upper), relative humidity (middle) and cloud water density (lower) retrieved from elevation scan of Radiometrics MP3000 on 1/12/03
Figure 5 - Backscatter signal from 78GHz Cloud Radar on 1/12/03
Figure 7 - Signal to Noise ratio from Wind Profiler (Low mode) on 1/12/03
Figure 8 - Profiles of Temperature (solid lines) and Dew Point (dashed lines) measure by SRS Radiosondes (black) and retrieved by Radiometrics MP3000 in zenith view (red) and elevation scan (green) at 23:00, 05:00, 11:00, 17:00 and 23:00 UTC on 1/12/03, from left to right.