The structure has no expansion joints and no bridge bearings. Temperature ... (swelling, shrinkage, creep) and to detect cracks and settlements. 2. Monitoring ...
Proceedings, 11th FIG Symposium on Deformation Measurements, Santorini, Greece, 2003.
MONITORING OF BRIDGE DEFORMATIONS USING EMBEDDED FIBER OPTICAL SENSORS Werner Lienhart, Fritz K. Brunner Graz University of Technology, Engineering Geodesy and Measurement Systems, Steyrergasse 30, 8010 Graz, Austria
Abstract A new bridge construction for the widening of roads on alpine slopes is used in Austria for the first time. The new bridge construction is based on a continuous concrete slab which is tightly connected to concrete columns. The structure has no expansion joints and no bridge bearings. Temperature induced strain cannot dissipate and will lead to stresses within the bridge deck. Therefore, a monitoring program was established to measure internal deformations using eight fiber optical sensors of type SOFO. We present results from the hardening period of the concrete and verify the precision of 2.2 µm of the measuring system. We also demonstrate that a combination of fiber optical sensors and temperature sensors allows to separate pure thermal expansion effects from mechanical strain.
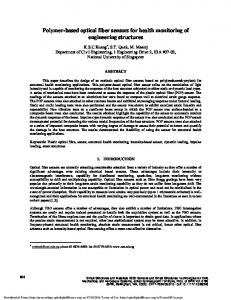
1. Introduction Existing roads in alpine regions are very often too narrow for today's requirements. Common techniques for their widening like retaining walls are very expensive and difficult to apply in steep terrain. A new bridge construction was developed by the Consulting Engineers Office Eisner, Graz. A prototype of the new design was built near Schladming, Austria in 2002. The bridge is about 150 m long and supported by 30 concrete columns as shown in figure 1-left. A cross section (figure 1-right) shows that two thirds of the concrete bridge deck rest on existing ground whilst the remaining third cantilevers out. Further details of the bridge construction are given in Högler and Lienhart (2003).
Fig. 1: New bridge construction for the widening of roads in steep terrain, Högler and Lienhart (2003)
The advantages of the new construction are its low production and maintenance costs mainly due to the absence of expansion joints and bridge bearings. However, temperature induced strain cannot dissipate and will lead to stresses within the bridge deck. Experiences with monolithic structures are scarce. Measurements of a monolithic bridge near Stuttgart, Germany were only reported by Pötzl and Koch (2001). It is intended to use the new design more often in Austria. Therefore, it was decided to monitor the prototype in detail. The aims of the monitoring program are to measure the influence of temperature changes on the structure, to observe the evolution of the material properties (swelling, shrinkage, creep) and to detect cracks and settlements.
2. Monitoring program
2.1 Embedded sensors For the monitoring of the strain in the concrete slab we proposed the use of fiber optical deformation sensors (FOS). Due to financial constraints only three measurement profiles were selected in the curved sections of the bridge (figure 2). The length of the sensors was selected with 5 m. Each sensor measures the change of length between two distinct points about 5 m apart. The sensors were embedded in the concrete slab. The measurement principle and the installation of the sensor will be discussed in chapter 3 and chapter 4. For the separation of the measured strain from temperature effects, six pairs of resistance temperature detectors (RTD) were embedded. Each pair consists of two sensors, one close to the bottom of the bridge deck and one close to the top of it. Thus, vertical and horizontal temperature gradients can be computed. An additional sensor was installed to measure the air temperature.
Fig. 2: Position of eight fiber optical sensors (white) in three measurement profiles (MP), six pairs of resistance temperature detectors (black squares) and air temperature sensor (black dot)
2.1 Geodetic methods With the embedded sensors only the local behaviour of the bridge can be monitored. In order to measure the change of length of the entire bridge four reflecting targets were mounted on the bridge deck. The position of these targets is determined by geodetic radiation measurements in combination with a traverse. The height changes of the concrete deck are determined by precise levelling at more than 20 points.
3. Fiber optical sensors Fiber optical sensors are used for deformation monitoring of civil structures since the late 1980s. Today, a variety of sensors is available to measure different parameters like
displacement, strain or temperature. An overview of the different types of sensors can be found in Inaudi et al. (2000). We decided to use the commercially available SOFO System (Inaudi et al., 1994) for measuring displacement. The manufacturer SMARTEC specifies a resolution of 2 µm and a precision of better than 0.2% of the measured deformation (Inaudi et al., 1998).
3.1 Measurement principle The SOFO system is based on a low coherence double Michelson interferometer in tandem configuration. In principle, a Michelson interferometer splits the amplitude of a light wave into two components which propagate along different paths. When the two components are recombined interference will occur which can be observed with a detector (Measures, 2001, p 76). The SOFO system consists of two Michelson interferometers. One 'measuring interferometer' which is made of the optical fibers of the sensor and an 'analyzing interferometer' in a portable reading unit, see figure 3.
Fig. 3: SOFO System (after Inaudi and Vurpillot, 1999) An LED (1) sends light with a coherence length of 30 µm to the sensor. There it is split by an optical coupler (2) into two components, each traveling along one fiber of the sensor. The light waves are reflected by mirrors at the end of both fibers and are recombined by the coupler. The length difference of both fibers is larger than the coherence length, hence the two light beams will not interfere. The combined light wave travels to the analyzing interferometer where it is once more split into two components by an optical coupler (3). The first component is reflected by a fixed mirror, whereas the second one is reflected by a moveable mirror (4). Both components are recombined and finally the intensity of the combined light wave is measured by a photodiode. The movable mirror scans along the measurement range, and a triple coherence peak is observed at the photo diode, see figure 4-left. The central peak (C) is obtained when the analyzing interferometer is balanced i.e., both of its light paths have equal length, whereas the side peaks (L and R) correspond to the mirror position where the length difference of the analyzing arms corresponds to the length difference of the two fibers (∆L) within the sensor. The exact position of the peaks can be determined by computing the center of gravity of the peaks, see figure 4-right. The advantage of using low coherence interferometry instead of high coherence interferometry is that absolute measurements are possible because interference can only occur within the coherence length. Therefore, it is not necessary to establish a permanent connection between reading unit and sensors. The measurement principle is described in detail in the original paper of Inaudi (Inaudi et al., 1994).
Fig. 4: Result of a mirror scan: all three peaks (left), enlargement of right peak (right)
3.2 Temperature compensation As mentioned above every SOFO sensor consists of two fibers (figure 5). The measurement fiber is connected to two anchor points and follows changes of the structure. However, the fiber will also change its length and its refractive index due to temperature changes. The second fiber (reference fiber) helps to compensate this effect. This fiber is also fixed to the anchor points but due to its extra length it will not experience strain if the structure changes. However in case of temperature changes both fibers will change their length and refractive index by the same amount. Since the system measures the difference of travel times within the fibers, any temperature effect on the fibers cancels out.
Fig. 5: Sensor of the SOFO System (after Inaudi and Vurpillot, 1999)
4. Installation of sensors During the installation of the sensors great care has to be taken to achieve a survivability of more than 95% as reported by Inaudi et al., 2000. In our application, the sensors were mounted under the reinforcement bars (figure 6) where they were held but not fixed with cable ties. This way pouring of the concrete does not cause problems, see figure 6-right. However, the fiber optical cables are very fragile in the case of bending. Special caution is required at the points where the cables exit the bridge. All eight sensors survived the installation. But unfortunately one sensors was destroyed later by drilling a hole into the concrete deck.
Fig. 6: Installation of the sensors and pouring of the concrete
5. Results
5.1 Hardening of concrete In this paper we present the results of measurement profile 3. In this profile four fiber optical sensors were embedded but only sensor 4 (figure 7-left) is in the cantilevered part of the bridge. Due to the low stiffness of the sensors it is possible to observe the hardening of the concrete at its initial phase. Figure 7-right shows the behaviour of the concrete during the first 48 hours after pouring. Measurements started after all sensors were entirely covered with concrete. The swelling of the concrete lasted 10 to 12 hours with an elongation between 0.05 mm and 0.13 mm for the 5 m sensor length. Remarkable is the smoothness of the curves. Especially if considering that for every single measurement the respective sensor was connected to the measurement unit and then disconnected again.
Fig. 7: Measurement profile 3 (left), hardening of the concrete during the first 48 hours (right) In order to assess the precision of the system two time intervals A and B are examined (marked in gray in figure 7-right). For the following investigation the shrinkage behaviour of the concrete was considered describable by a polynomial. A second order polynomial was used to describe the shrinkage effect in both intervals and for each of the four sensors. The deviations of the actual measurements from the fitted curve were considered as random deviations and used to calculate standard deviations. The results are given in table 1. Table 1: Standard deviations (std) calculated using deviations from fitted shrinkage curves Interval A
B
Sensor 1 2 3 4 1 2 3 4
No. of measurements 41 41 40 43 76 73 76 76
std [µm] 1.7 1.7 1.6 1.9 2.3 1.1 2.9 2.8
All standard deviations can be combined into a pooled standard deviation of 2.2 µm. This value is very close to the resolution given by the manufacturer.
5.2 Long term monitoring The last section of the concrete deck was constructed in September 2002. After closing the shrinkage gaps and the application of the asphalt, the bridge was opened to the public in November 2002. Measurement runs were made in September, October, November 2002 and February 2003. Figure 8-left shows one representative result for each measurement epoch and sensor. The position of the sensors was already shown in figure 7-left. Clearly, a trend is visible. Possible sources of this trend are phenomena like shrinkage, creep, temperature changes and other deformations. In the following we will concentrate on the influence of temperature changes. Figure 8-right displays the temperatures interpolated for the FOS positions using the measured temperatures. During the swelling period the temperature reached almost 35°C and decreased to about -3°C in winter (week 11 to 20). Both graphs show similar patterns. We want to emphasize that the FOS are temperature compensated. Therefore, every correlation between measurements and temperature is a correlation between the changes of the structure and its temperature.
Fig. 8: Long term monitoring: length changes (left), temperature (right) This effect is more clearly visible by plotting the length changes versus temperature, see figure 9. The line with the arrows corresponds to a typical thermal coefficient of expansion of concrete (11.5ppm). The length changes of sensor 1 are almost parallel to this line. Therefore all changes in this section of the bridge can be explained by temperature changes.
Fig. 9: Long term monitoring: length changes versus temperature
However, the situation changes for the other sensors where the same temperature change causes smaller effects. The difference between the calculated length changes and the observed values is structural strain. Abrupt changes are visible between the measurements of October and November. So far, the sources of these effects could not be verified. These are currently discussed with structural engineers. A continuation of the measurements is necessary to better understand these patterns.
6
Summary
In this paper we have presented an application of fiber optical sensors to monitor the internal deformations of a bridge deck. Due to the low stiffness of the sensors and the high precision of the system it is possible to measure phenomena like hardening of concrete which can hardly be observed using traditional geodetic techniques. The in-field precision of the system has been verified as 2.2 µm. We have shown that a combination of fiber optical sensors and temperature sensors allows to separate thermal expansion effects from other sources. The monitoring of the structure is being continued. A comparison of the measured deformations with simulations by FE models is planned as the next step of the investigation.
Acknowledgements We would like to thank the Consulting Engineers Office Eisner and the Austrian Industrial Research Promotion Fund (FFF) for partly funding this monitoring project, and R. Lummerstorfer and F. Zobl for their invaluable support in the field work.
References Högler H. and W. Lienhart (2003). Integrales Brückenbauwerk zur Straßenverbreiterung und erste Deformationsmessungen mit faseroptischen Sensoren. Proc. GESA Symp. 2003, Braunschweig, in print Inaudi D., A. Elamari, L. Pflug, N. Gisin, J. Breguet and S. Vurpillot (1994). Low-coherence deformation sensors for the monitoring of civil engineering structures. Sensors and Actuators, 44, 125-130. Inaudi D., S. Vurpillot, N. Casanova and P. Kronenberg (1998). Structural monitoring by curvature analysis using interferometric fiber optic sensors. Smart Materials and Structures, 7, 199-208. Inaudi D. and S. Vurpillot (1999). Monitoring of concrete bridges with long-gage fiber optic sensors. Journal of Intelligent Material Systems and Structures, 10, 280-292. Inaudi D., N. Casanova, S. Vurpillot, B. Glisic, P. Kronenberg and S. Lloret (2000). Lessons learned in the use of fiber optic sensor for civil structural monitoring. Proc. 6th Intern. Workshop on Material Properties and Design, Present and Future of Health Monitoring, Bauhaus University Weimar, Sept. 2000, 79-92. Measures R. M. (2001). Structural Monitoring with Fiber Optic Technology, Academic Press, New York, 716p. Pötzl M. and R. Koch (2001). Erkenntnisse aus Messungen an der fugenlosen Brücke über das Nesenbachtal in Stuttgart. Beton und Stahlbetonbau, 96, 670-678.